Your browser does not fully support modern features. Please upgrade for a smoother experience.
Please note this is an old version of this entry, which may differ significantly from the current revision.
Subjects:
Biochemical Research Methods
若虫杂交种是若虫科仙女的多年生水生草本植物。它是芬芳,多彩,不可缺少的主植物在净水功能。
- Nymphaea hybrid
- ultrasound-assisted
- cellulase
1. 引言
若虫杂交种是若虫科仙女的多年生水生草本植物[1]。它芳香,多彩,是净水功能中不可缺少的主要植物[2,3]。在过去的几十年里,科学家们越来越关注Nymphaea,发现一些Nymphaea植物的提取物显示出良好的抗氧化[4],美白[5],抗菌[6],抗炎[7],保肝[8],预防糖尿病和痴呆症[9,10]的效果。黄酮类化合物和多酚主要是若虫的活性物质,其良好的抗氧化和细胞保护活性令人印象深刻[4,11]。因此,对黄酮类化合物和多酚类若虫的深入研究,在功能性食品、医药和化妆品行业具有广泛的应用前景。然而,关于Nymphaea杂交的研究一直集中在香料应用的芳香成分上,而关于类黄酮和多酚以及其他活性成分的研究只有少数。
合适的提取方法对于制备天然植物活性提取物非常重要。近年来,专家们探索了具有更好的提取效率,增强的绿度和更短的提取时间的新方法,例如微波[12],超声波[13],超临界提取[14]和酶水解[15]。超声辅助纤维素酶提取(UCE)是从天然植物中提取活性成分的新方法之一[16]。酶提取的基本原理是在温和的反应条件下使用酶作为催化剂破坏细胞结构,以便可以更快地释放活性成分[17]。此外,据报道,在优化条件下利用其热效应,机械波动效应和空腔效应,超声处理可以增强酶活性[16]。UCE不仅可以提高提取效率,还可以提高提取物的数量[18,19,20,21,22,23,24,25,26,27,28]。如我们所知,关于从Nymphaea杂交种中提取类黄酮和多酚的研究很少,特别是关于如何充分提取类黄酮的报告很少。因此,本文选择UCE配合响应面法(RSM)开发类黄酮和多酚杂交的黄酮和多酚提取工艺。
天然植物提取物通常是由多种活性成分组成的复杂混合物。最近的研究表明,类黄酮和多酚是Nymphaea提取物的最大二级代谢物组,并且在生物活性中起重要作用[29]。大孔树脂法通常用于进一步富集粗提取物中的活性成分[30]。它具有吸附效率高,操作简单,成本低,可重复使用,设备简单[31,32,33,34,35]等优点。
氧化应激是衰老和大多数与年龄有关的疾病的主要危险因素之一。它导致ROS水平超过细胞的抗氧化能力,导致氧化损伤[36]。有相当数量的化学[37]和细胞[38]测试用于评估用于筛选天然植物提取物的活性成分的体外抗氧化活性。化学测试操作简单,成本低,通常用于抗氧化和抗炎测定,如DPPH,ABTS和其他自由基清除测定,还原能力和透明质酸酶抑制测定[39]。细胞方法通过模拟人体环境来评估抗氧化剂,越来越普遍。常用的细胞包括成纤维细胞、人角质形成细胞和B16细胞[40]。越来越多的研究已经对活性物质如何降低UVA / UVB或H进行了研究2O2- 诱导人细胞氧化应激[41]。
2. 单因素实验
采用超声辅助纤维素酶法制备NHE。该过程包括用纤维素酶酶酶水解,然后超声提取类黄酮和多酚。采用单因素实验和RSM对制备过程进行优化。为了探索不同条件的影响,我们在单因素实验中开发了四个因素和五个实验程序的水平。选择纤维素酶用量、液固比、酶水解时间和乙醇浓度等因素,确定其对黄酮含量的影响。如图1a所示,类黄酮含量首先随着液固比从20:1(mL/g)增加到40:1(mL/g),然后下降到40:1(mL/g)到60:1(mL/g)的范围内。NHE类黄酮含量的条件达到最大值,液固比为40:1(mL/g)。溶剂与固体接触面积的增加有利于活性物质的扩散[27],因此类黄酮含量随着液固比的增加而增加。当溶剂过量时,纤维素酶的有效浓度和非目标活性物质溶解的底物浓度增加,减少纤维素酶和底物的减少,导致NHE的类黄酮含量下降[22,42]。图1b显示,类黄酮含量随着纤维素酶量从2%增加到4%而增加,但当纤维素酶的添加量高于4%时,类黄酮含量开始下降。纤维素酶可以将细胞壁分解成更小的分子,有利于活性物质的释放。过量的纤维素酶可能会产生粘稠的酶溶液,不利于破坏细胞井和酶促反应过程[43]。如图1c所示,在酶解时间60min处,类黄酮含量达到最大值。然而,类黄酮含量在60 min后没有变化,可能是由于类黄酮的扩散平衡。乙醇的浓度对活性组分的提取速率有影响。根据类似混溶性的原理,乙醇的浓度对活性组分的提取速率有影响[43]。如图1d所示,当乙醇浓度为50%时,类黄酮含量达到最大值。
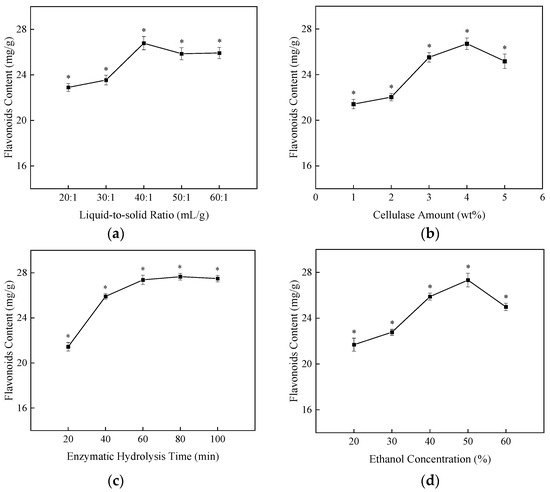
Figure 1. The influence of different factors on the content of flavonoids in NHE. (a) Liquid-to-solid ratio, (b) Cellulase amount (wt%), (c) Enzymatic hydrolysis time (min), (d) Ethanol concentration (%). The data shows as the mean ± S.D. (n = 3). *: p < 0.05 compared between groups.
3. Response Surface Design
Based on the results of the single factor experiments, the liquid-to-solid ratio (A), cellulase amount (B) and ethanol concentration (C) were selected as the independent variables for optimizing the extraction process using the flavonoids content as an index. The results of the Box–Behnken experiment were shown in Table 1. According to different experiments, the flavonoids content of NHE was 20.67–27.06 mg/g. As in Table 2, multiple regression analysis was used to analyze the experimental data. Through the analysis of the multivariate regression fitting, the relationship between the response variables (flavonoids content of NHE, Y) and the quadratic regression equation is shown in the formula as follows:
Y = 26.79 + 0.46A + 0.53B + 0.59C − 0.46AB − 0.39AC + 0.41BC − 3.03A2 − 1.28B2 − 1.67C2
Table 1. Scheme and experimental results of Box–Behnken.
| NO. | A/(mL/g) | B/(%) | C/(%) | Flavonoids Content (mg/g) |
|---|---|---|---|---|
| 1 | 40:1 | 4 | 50 | 26.62 |
| 2 | 40:1 | 5 | 60 | 25.66 |
| 3 | 30:1 | 3 | 50 | 21.30 |
| 4 | 40:1 | 5 | 40 | 23.34 |
| 5 | 40:1 | 3 | 40 | 22.83 |
| 6 | 50:1 | 4 | 60 | 22.73 |
| 7 | 40:1 | 4 | 50 | 26.40 |
| 8 | 40:1 | 4 | 50 | 27.06 |
| 9 | 30:1 | 4 | 60 | 22.30 |
| 10 | 50:1 | 4 | 40 | 22.65 |
| 11 | 30:1 | 4 | 40 | 20.67 |
| 12 | 40:1 | 4 | 50 | 26.92 |
| 13 | 30:1 | 5 | 50 | 23.02 |
| 14 | 50:1 | 3 | 50 | 22.85 |
| 15 | 40:1 | 4 | 50 | 26.95 |
| 16 | 50:1 | 5 | 50 | 22.72 |
| 17 | 40:1 | 3 | 60 | 23.52 |
Table 2. Variance analysis of Box–Behnken regression model results.
| Source | Sum of Squares | df | Mean Squares | F-Value | p-Value |
|---|---|---|---|---|---|
| Model | 71.7596 | 9 | 7.9733 | 67.6019 | <0.0001 *** |
| A | 1.6801 | 1 | 1.6801 | 14.2445 | 0.0069 ** |
| B | 2.2521 | 1 | 2.2521 | 19.0949 | 0.0033 ** |
| C | 2.7817 | 1 | 2.7817 | 23.5852 | 0.0018 ** |
| AB | 0.8540 | 1 | 0.8540 | 7.2411 | 0.0310 * |
| AC | 0.5987 | 1 | 0.5987 | 5.0763 | 0.0589 |
| BC | 0.6680 | 1 | 0.6680 | 5.6636 | 0.0489 * |
| A2 | 38.6989 | 1 | 38.6989 | 328.1105 | <0.0001 *** |
| B2 | 6.9468 | 1 | 6.9468 | 58.8986 | 0.0001 *** |
| C2 | 11.7205 | 1 | 11.7205 | 99.3726 | <0.0001 *** |
| Residual | 0.8256 | 7 | 0.1179 | ||
| Lack of Fit | 0.5251 | 3 | 0.1750 | 2.3293 | 0.2159 |
| Pure Error | 0.3006 | 4 | 0.0751 | ||
| Cor Total | 72.5852 | 16 | |||
| R2 | 0.9886 | ||||
R2 = Coefficients of determination. Significance: * p < 0.05, ** p < 0.01 and *** p < 0.001.
The variance analysis of the Box–Behnken regression model results in Table 2 was obtained. The F-value of the equation model is 67.6, and the p-value is 0.0001 (p < 0.001), indicating that the model has an extremely significant statistical difference, and the model is meaningful. The high correlation coefficient value (R2 = 0.9886) indicates that more than 98.86% of the response variability is explained by the model. The p-value of lack of fit is 0.2159, the F-value of lack of fit is 2.3293 and the three linear coefficients, three quadratic coefficients and two interaction terms are significant and interact. The results indicate that the quadratic regression model fitted well with the actual situation, and the model could be used to analyze the flavonoid content of NHE.
According to the result of regression analysis, the response surface 3D map and the contour plot maps were drawn in Figure 2. The 3D diagram can intuitively reflect the influence of the interaction of each factor on the response value, and through it, we can find the best parameters and the interactions among the parameters. According to the p-value, we can determine two interaction coefficients (AB, BC). Figure 2a shows the interaction between the liquid-to-solid ratio and the cellulase amount (AB) displayed significantly (p < 0.05). The flavonoid content increases with the increasing liquid-to-solid ratio and cellulase amount, while at a higher liquid-to-solid ratio (40:1–60:1 mL/g) and cellulase amount (4–6%), the interaction effect was not obvious. When the amount of cellulase reaches a certain point, the flavonoid content may decrease with the increase in cellulase amount and enlarge the liquid-to-solid ratio. The reason for this may be due to the appropriate cellulase amount and an enlargement of the liquid-to-solid ratio will improve the solubility and increase the mass transfer rate, but the excessive cellulase amount with too high a liquid-to-solid ratio will affect the reaction efficiency and mass transfer efficiency, resulting in a flavonoid content decrease with the liquid-to-solid ratio. A significant interaction effect (p < 0.05) between cellulase amount and ethanol concentration (BC) was also observed in Figure 2c.
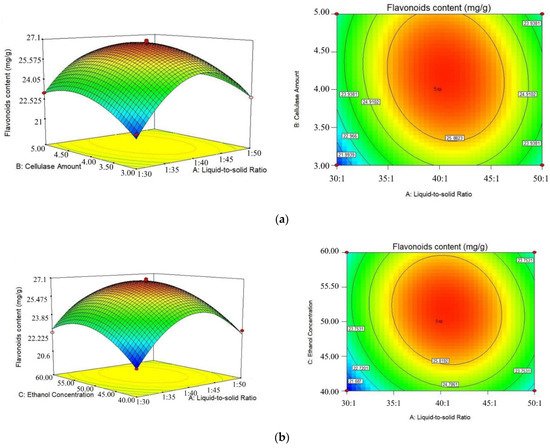
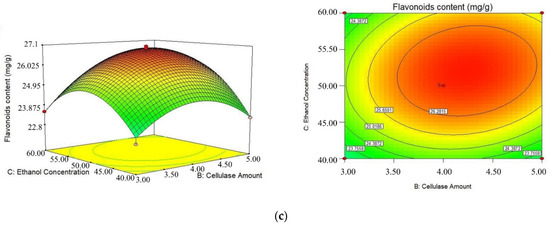
Figure 2. Response surface 3D and contour plots of different factors to effect the flavonoid content of NHE. (a) Liquid-to-solid ratio and cellulase amount; (b) Liquid-to-solid ratio and ethanol concentration; (c) Cellulase amount and ethanol concentration.
According to the response surface experiment, the optimal process conditions for extraction were as follows: the liquid-to-solid ratio was 40.45:1 (mL/g), cellulase amount was 5.23% (w/w), the ethanol concentration was 52% (v/v). Under such conditions, the predicted flavonoid content of NHE was 26.92 mg/g. To verify these optimal conditions, the experiment was repeated five times and the average actual flavonoid content of NHE was 27.26 ± 0.64 mg/g (n = 5), which was close to the predicted value and proved the validity of the models.
This entry is adapted from the peer-reviewed paper 10.3390/molecules27061914
This entry is offline, you can click here to edit this entry!