Your browser does not fully support modern features. Please upgrade for a smoother experience.
Please note this is an old version of this entry, which may differ significantly from the current revision.
Subjects:
Energy & Fuels
With the ever-increasing capacity and size of utility-scale photovoltaic (PV) power plants, reaching the scales of gigawatts and hundreds of hectares, automation is increasingly becoming a matter not only of scientific interest, but also of economic importance. Therefore, the autonomous procedure and classification of faults task must still be explored to enhance the accuracy and applicability of the aIRT method.
- aerial infrared thermography (aIRT)
- PV power plant
- PV monitoring
- deep learning
- automatic fault detection
- PV reliability
1. Applications of Automatization Algorithms
1.1. Automatic Path Planning
In an automatic aIRT mission, the UAV flies over a set of waypoints that cover all modules of the PV plant. Therefore, an optimized path-planning algorithm aiming at an optimal path for time and battery efficiency is essential [51]. Figure 2 depicts the coverage area by a UAV based on the field of view (FoV) and resolution of the camera on board as well as the essential parameters used for path planning [51].
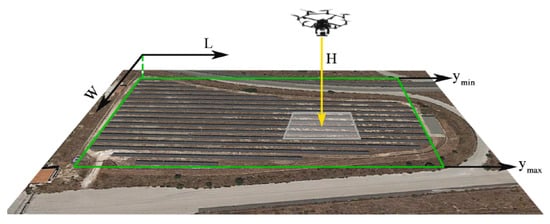
Figure 2. Path planning procedure of a PV power plant [51].
Available market software packages already provide an automatic flight based on a so-called “lawn mower” flight pattern. However, they do not always provide the most efficient flight and do not guarantee a centralized view to the PV arrays, especially in power plants installed over complex topography.
Studies aiming at optimizing path planning include different approaches to the problem. In the study developed by Salahat et al. [52], the traveling salesman shortest path algorithm was used to generate a path that includes a randomly selected set of modules that represent the entire PV plant, allowing an optimization of the battery use. Ding et al. [53] based their method on density clustering, boustrophedon path planning and Bezier curves. Luo et al. [54] also based their algorithm for path planning optimization on Bezier curves in a joint approach with particle swarm optimization (PSO), taking into consideration the flight attitude, gimbal limitation and path length.
Image stitching and DIP techniques were used by Henry et al. [55] to find contours of the power plant and generate a “lawn mower” path over it. A similar approach, using DL, was adopted by Moradi Sizkouhi et al. [51,56], which was also complemented with a dynamic path planning, which deviates the previous flight plan to take closer photos when faults are detected. Pérez-González et al. [57] also used DL to detect the area of the PV plant and then used different algorithms to determine the best flight path, wherein exact cellular decomposition boustrophedon and grid-based wavefront coverage algorithms produced the best results.
Other real-time algorithms have been proposed that calculate the optimized path of the UAV during the flight. In Roggi et al. [58], the UAV corrected the pre-planned “lawn mower” path according to the images that it acquired and the image processing techniques that are applied. A vision-based flight control was also proposed by Xi et al. [59], which performs a real-time direction and velocity correction.
1.2. Detection of PV Systems
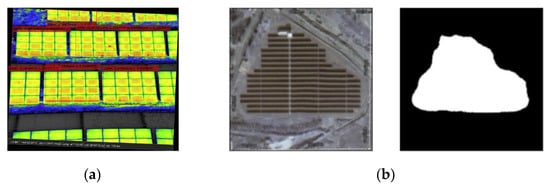
Although not always related to aerial inspections, the detection of PV systems in aerial imagery (UAV or satellite imagery) has been proposed by many authors and even used for path planning before the aIRT flight [56,57]. Table 2 presents a summary of methods used in the literature for detecting PV systems in aerial imagery. The table presents the best metrics obtained in each study, the type of image data used as input and the type of detection output obtained with each method. The detection output was classified into three categories:
- (a)Boxes: the output is given by the coordinates of a box or polygon placed around the PV system;
- (b)Mask: the output is a binary image where the pixels corresponding to the segment of the PV system are represented by the value 1 and the rest of the image is represented by 0;
- (c)Binary: for each image, the presence or absence of a PV system is the result of the algorithm (1 or 0).
Figure 3 shows two examples of two types of detections, by the coordinates of boxes around the detected PV panels (left) and masks of the segment of the PV system (right). Besides developing an algorithm for the detection of PV arrays, Wu et al. [60] also matched them to their string identifiers.
1.3. Detection of PV Modules
The detection of the area of the modules is an important step in the image processing task, which is required for both detecting modules with defects and locating them in the power plant.
Table 2. Summary of methods for detecting PV systems using aerial imagery.
| [Ref]/Year | Algorithm | Best Results | Output Type | Images |
|---|---|---|---|---|
| [38] 2016 | RF and DL | Pr: 90% | Mask | Aerial imagery |
| [60] 2017 | Feature description vector according to PV modules’ different colors | - | Boxes | UAV |
| [62] 2017 | Adaptive clustering method based on k- means | Loss rate is lower than 5% | Mask | Aerial imagery |
| [63] 2017 | GLCM algorithm | Pr: 93.16% | Mask | aIRT |
| F1: 77.8% | ||||
| [64] 2018 | DIP and k-means classifier | Pr > 99% | Boxes | Aerial imagery |
| [65] 2018 | DL (Segnet) | Pr: 90% | Mask | Aerial imagery |
| [66] 2018 | DL (PolyCNN) | IoU: 79.5% | Mask | Google Earth |
| [67] 2019 | DL (Faster R-CNN, based on the classifier ResNet-50) | Pr: 92.9% | Boxes | Google Earth |
| [49] 2019 | DL (Res-UNet) | Ac: 97.11% | Mask | System IRT images |
| [68] 2020 | DL (Mask R-CNN and VGG16) | Ac: 96.99% | Mask | UAV |
| [47] 2020 | DL (U-net) | F1: 82% | Mask | Google Earth |
| [69] 2020 | DL | F1: 92.2% | Binary | Satellite imagery |
| [70] 2020 | DL | Pr: 92.66% | Mask | Google Earth |
| Re: 97.43% | ||||
| [71] 2020 | DL (CNN for semantic segmentation) | Average error of 5.75% | Mask | UAV |
| [72] 2020 | k-means, SVM and CNN | MCC: 0.17 | Mask | Identify solar on rooftops |
| [61] 2020 | DIP (edge detection) and DL (R-CNN) | Pr: 92.25% | Mask | Panels in aIRT images |
| [73] 2021 | DL algorithms | F1: 95.38% | Mask | Aerial imagery |
| [74] 2021 | DIP (transform invariant low-rank textures (TILT) algorithm for orthographic view and Otsu’s method for segmentation) | - | Mask | Panels in aIRT images |
| [75] 2021 | Unsupervised segmentation parameter optimization (USPO) and RF classifier | F1: 98.7% | Mask | UAV |
| [57] 2021 | DL server | - | Mask | UAV |
| [51] 2022 | Mask R-CNN structure | Ac: 96.99% | Mask | UAV |
The first attempts to automatize the segmentation of the PV modules in IRT images appear to have been made in 2015, with images obtained with a moving cart, using simple DIP methods [76]. Other attempts were described in Menéndez et al. [77], Montanez et al. [78] and Wu et al. [79]. Uma et al. [80] did the same using a k-means clustering algorithm. In 2021, Xie et al. [81] used a Segnet, a CNN used for segmentation.
For aerial images, Tribak and Zaz [82], Salamanca et al. [83] and Perez et al. [84] published results on detecting PV modules in aerial visual images, and many studies used different techniques to detect and segment PV module boundaries in aIRT data. Table 3 shows the studies related to DIP and DL algorithms. In this case, the detection result of the algorithm can be given by a box or polygon around the PV module, a mask of the segment of the module or lines that mark the borders of the modules in a PV panel.
The best metric among the studies was obtained with a combination of many algorithms (DIP, SVM and DL) [85]. On the other hand, the worst metrics were obtained with simple DIP filters [86]. It is important to note that not all studies are comparable, because not all have presented metrics for their performance, and they have different dataset sizes, which make the comparison difficult. The studies described by Carletti et al. [87] and Bommes et al. [88], besides detecting the PV module, also developed ways to track the modules in subsequent frames of a video. A tracking system was also developed by Xie et al. [89] using an AlexNet CNN.
Table 3. Summary of methods for detecting PV modules in aIRT using DIP and DL algorithms.
| [Ref]/Year | Algorithm | Best Results | Output Type |
|---|---|---|---|
| [48] 2016 | DIP (normalization and thresholding) | F1: 92.76% | Boxes |
| [90] 2017 | DIP (edge extraction by Hough transform) | - | Boxes |
| [91] 2017 | DIP (thresholding) | Pr: 96.9% | Mask |
| [92] 2017 | RANSAC (random sample consensus) algorithm | - | Boxes |
| [93] 2017 | DIP (not detailed) | Pr: 82% | Boxes |
| [94] 2017 | DIP (thresholding in HSV color space) | - | Mask |
| [95] 2018 | DIP (template matching algorithm) | F1: 83.0% | Boxes |
| [87] 2020 | DIP (canny edge and morphological filters) | F1: 87% | Boxes |
| [86] 2020 | DIP (ACM LS and filtering by area, Hough transform) | Re: 70% | Boxes |
| [96] 2020 | DIP (thresholding in HSV color space and MSER algorithm) | Ac: 98% | Boxes |
| [97] 2020 | DL (YOLOv3) | F1: 95% | Boxes |
| [85] 2020 | DIP + support vector machine (SVM) and DL (Mask R-CNN) | F1: 98.9% | Boxes |
| [98] 2020 | DIP (Hough line detection, Sobel operator) | - | Lines |
| [99] 2020 | DIP (Sobel and canny operator, HoughPLine) | Pr: 90.91% | Lines |
| [100] 2020 | DIP (LSD algorithm and k-means clustering) | Pr: 77.3% | Mask |
| F1: 86.3% | |||
| [101] 2020 | DIP (k-means clustering and thresholding) | Ac: 98.46% | Mask |
| [88] 2021 | DL (Mask R-CNN) | Pr: 90.01% | Mask |
| F1: 90.51% | |||
| [102] 2022 | DIP (geometry coercion, clustering and angularity-based segment filtering) | - | Mask |
1.4. Orthomosaicking
The localization of faults within a power plant is a challenging issue that can be addressed by creating an orthomosaic of the PV power plant [103]. Image mosaicking, also known as image stitching, is a computational technique that detects overlapping key points in spatially subsequent photos and uses them to create a so-called panorama picture [94].
To improve the sight perspective and enable an expanded view of the localization of faults in both visual and thermal images of PV power plants, some researchers used commercially available software packages to create orthomaps with aerial imagery. Lee and Park [104] and Zefri et al. [105] used the software Pix4D capture to process thermal and visual images and create orthographic images with temperature information. Oliveira et al. [103] compared the use of two software packages (DroneDeploy and ContextCapture) to create an orthomosaic of a 1 MW PV power plant. Higuchi and Babasaki [106] used the software OpenDroneMap to generate the orthographic image of a 2 MW PV power plant.
Grimaccia et al. [94], Aghaei et al. [27] and Ismail et al. [107] have proposed methods for the orthomosaicking of visual images of PV power plants using DIP techniques. Tsanakas et al. [108] used the method of aerial triangulation, and Lafkih and Zaz [109] and Zefri [102,110] used the SIFT technique to perform the task. To optimize the mosaicking of visual PV images, Qi et al. [111] used a Faster R-CNN to detect key points in aerial sequence images in the world coordinate system, so it avoids redundant information generated by traditional methods. López-Fernández et al. [92] developed a tool that creates a 5D point cloud of the power plant, where each coordinate point has a temperature and an intensity value associated with it. After segmenting the modules in a dataset, Costa et al. [73] used a sliding window algorithm with overlapping pixels, combining frames side by side to reconstruct orthomosaics of power plants.
1.5. Soiling
A common cause of hot spots in PV power plants is soiling and shadow over the modules, which hinders the evaluation of results since they are not considered real defects of the PV modules [6]. Cipriani et al. [112] approached this issue by using a CNN to differentiate hot spots caused by faults from soiling, obtaining an accuracy of up to 98%.
Another solution to the problem is the analysis of the visual images that are normally taken together with the IRT images in the UAV, which enables the operator to discard hot spots caused by soiling. Automation of the task of detecting soiling in individual modules was proposed by Yang et al. [113], Pivem et al. [114] and Qasem et al. [115] using DIP techniques. Similar techniques were employed by Wen et al. [116], and by Karaköse and Firildak [117] to detect shadows over PV systems. Hanafy et al. [43] compared different ML algorithms (KNN, NN, RF and SVM) to classify modules in different categories of cleanliness and obtained an accuracy of over 90% using an SVM algorithm. Mehta et al. [37] proposed a method that uses a weakly supervised CNN-based classification network to predict power loss, detect soiling and categorize it given a PV module image. This method obtained an accuracy of about 87% on a test dataset of about 50 images.
1.6. Detection and Classification of Faults
The manual assessment of aIRT imagery is a time- and computing-consuming task; therefore, its automation is the most explored part of the aIRT framework in the literature. This detection can either be processed on board, during the UAV flight, as shown in the example in Figure 4, or in a computer software, after the acquisition of images has been carried out by the UAV (Figure 5). Both Figure 4 and Figure 5 show the procedure of the inspections for the two different approaches, including all tasks being automatized in each case.
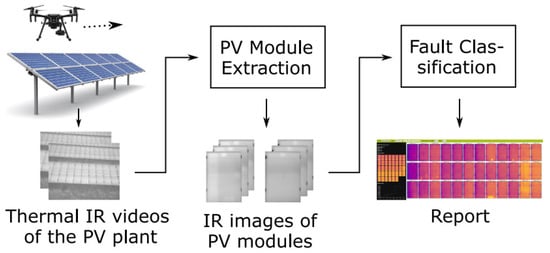
Figure 4. Overview of a tool for semi-automatic inspection of large-scale PV plants using IRT videos acquired by a UAV [88].
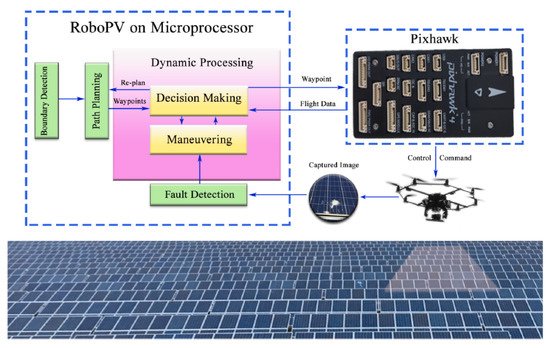
Figure 5. Overview of the on-board software package RoboPV, developed to perform the autonomous aerial monitoring of large-scale PV plants using UAVs [51].
In 2002, Pilla et al. [118] used the Sobel and canny edge operators to detect cracks in IRT PV cell images. In 2003, Wang et al. [119] used thresholding and a fuzzy classifier to detect faults in IRT images. After that, in 2011, Vergura and Falcone [120] used DIP techniques to analyze IRT images for faults. Since then, many other studies have used mostly DIP techniques to segment faults in IRT images.
1.7. Other Applications
Imaging techniques have been employed in some other applications to facilitate the analysis of PV modules. An example is the detection of blurred images that was addressed by Tribak and Zaz [176] with image processing techniques in order to filter frames of videos before employing mosaicking techniques. Similar techniques were used by Shen et al. [177] to correct the angle distortion of IRT images.
2. Current Insights
This research has shown that different automatization algorithms, including DIP, DL and classification techniques, have been employed for automating different tasks of the aIRT procedure for inspecting PV power plants. Among the conclusions, this review showed that only a few among the selected studies have assessed two important aspects of the autonomous inspection procedure, namely, the optimization of the flight path (nine papers), and the detection of soiling (eight papers). These two topics are of great importance to increase time efficiency in aIRT and therefore should be further investigated. The latter goal of detecting soiling over PV modules and differentiating it from actual faults of the modules was investigated by some authors, e.g., Dunderdale et al. [170] and Arosh et al. [159], together with the detection and classification of other faults.
For the task of performing the orthomosaicking of aIRT images to facilitate the localization of the faults in the field, four papers employed existing software to perform the task, while ten studies approached the development of algorithms to create the orthomosaic of the PV plant. However, most of the proposed methods are based on DIP techniques; therefore, the resulting mosaic consists of a simple image, without additional GPS information. The correlation of orthomosaic images with GPS coordinates and the identification of modules and strings according to the site nomenclature are areas that require further investigation.
Another approach to the challenge was developed by Wu et al. [60], with the development of an algorithm that detects PV arrays in power plants and performs the automatic correlation with their string identifiers. This is a promising strategy that could also be used to facilitate the localization of detected faults in the field through aIRT. Besides the study carried out by Wu et al. [60], another 20 studies among the selected literature focused on the development of algorithms to detect PV systems and panels in aerial imagery. However, only three of these studies focused on aerial IRT images of the PV plants, obtaining up to 93.16% precision in the results [63]. On the one hand, 18 papers presented the results of developed algorithms for the detection of individual PV modules in aIRT images, of which three of them applied DL techniques. Although the methods are hardly comparable given their different structures for results (i.e., mask, box or line), their different dataset sizes and the different evaluation metrics used, a method that combined many algorithms (DIP, SVM and DL) for detecting PV modules in aIRT images and obtained an F1 score of 98.4% can be highlighted [85]. On the other hand, the worst metrics were obtained with simple DIP filters [86], which although providing fast results with small datasets required for training, are characterized by a lack in generalization. This is important for the replication of the algorithm in images acquired in different conditions and with a different quality. The algorithms proposed by Carletti et al. [87], Xie et al. [89] and Bommes et al. [88] also performed the tracking of the modules in subsequent frames of an aIRT video. This task is of utter importance for the cross-correlation of detected modules and faults, as well as their location in PV plants.
Most of the selected studies have assessed autonomous fault detection and classification in PV plants through visual (12 papers), IRT (22 papers) and aIRT images (43 papers). Among these studies, 35% used DL techniques for the detection or classification of PV faults, with an increase in developed algorithms using CNNs in recent years. Still, DIP-based algorithms also presented high accuracy results, even though most of them use smaller datasets, and therefore their replication in other sets of data is possibly not feasible. The combination of DL or DIP techniques with classifier algorithms was a promising approach in recent studies. In the field, fault detection can either be processed on board, during the UAV flight, or subsequently through a post-processing procedure after the flight. For the first case, the high computational requirements and the processing time of DL are still a challenge, as even in high-performing computers, the processing of a set of images of a large-scale PV power plant (that consists of some gigabytes of data) can take hours when using a DL algorithm. In the same way as in the detection of PV systems and modules, many types of outputs for the algorithms are possible, namely the segmentation of the faults, the detection of damaged modules or even the classification of faults in separate classes. The classes also differ among authors, and these differences represent a great challenge not only for the comparison between studies, but also for the exchange of data, experiences and algorithms among researchers in PV community, which hinders the advancements in this area. The exchange of data to enable the development of larger and more generalized datasets that consider different environmental conditions is also deaccelerated by data protection clauses.
Besides the different result types, the different evaluation metrics (or the lack of them), dataset sizes and image resolutions of the inputs also make the comparison between studies difficult. However, in general, the algorithms with the highest metrics are the ones dedicated to detecting and classifying a few types of faults compared to those that carry out the classification of many classes of faults. This proves that detection and classification of multiple faults is a complex task and further investigation is required. On this subject, the algorithm developed by Bommes et al. [88] can be highlighted for its encouraging results, with an accuracy of 90% in the detection and classification of faults in ten different anomaly types. In summary, to achieve the goal of an entirely autonomous aIRT procedure, advances in some of the tasks related to the technique must be achieved. Even tasks that were already the focus of many research studies, such as the detection and classification of faults, should be further explored to contemplate different types of datasets and conditions. The exchange of data and academic collaborations are fundamental to allow for a fully automatic procedure that not only detects modules and faults on PV modules but also provides information about the type and location of the faults, in a simple and accessible manner, to enable quick remediation measures.
This entry is adapted from the peer-reviewed paper 10.3390/en15062055
This entry is offline, you can click here to edit this entry!