2. Cell–Fibre Interaction Imaging and Fibre Surface Characterisation
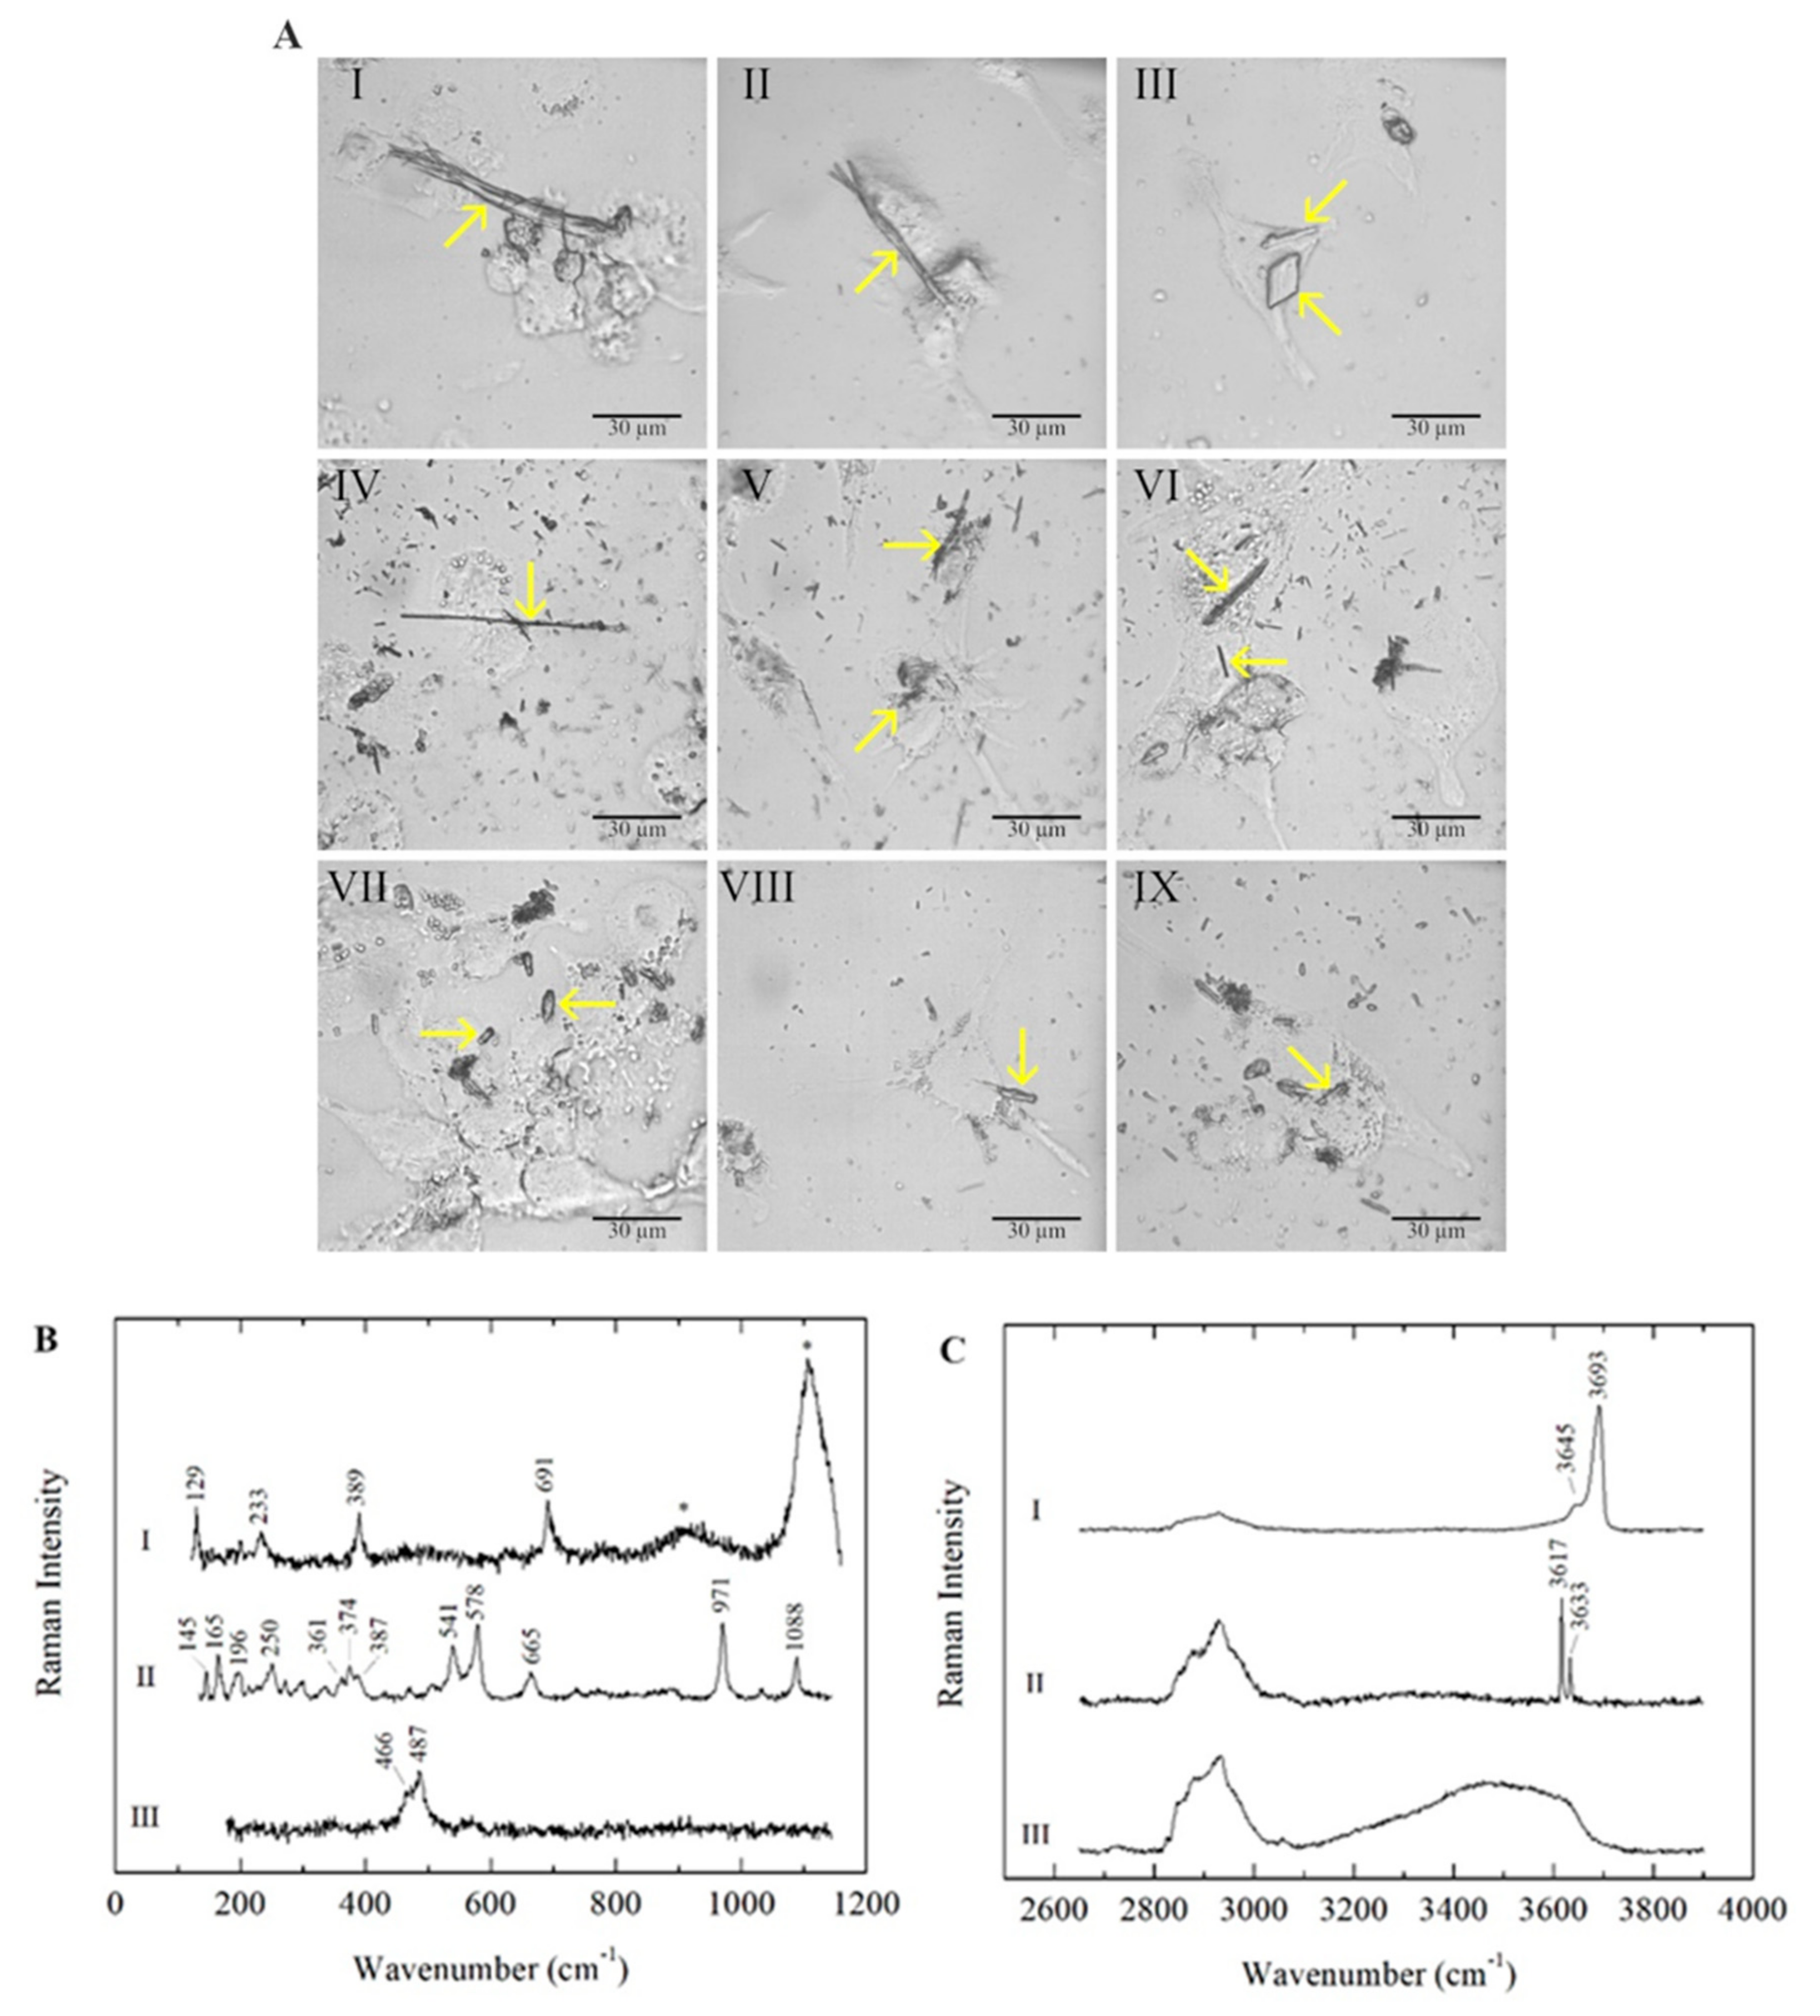
In all three types of polarised macrophages (M0, M1 and M2), the mineral fibres were detected inside the cells and identified by micro-Raman analyses after 24 h of incubation. As expected, chrysotile (CHR), crocidolite (CRO) and erionite (ERI) fibres showed different morphologies (Figure 1A).
Figure 1. (A) Microscope images of M0, M1 and M2 macrophages in the presence of mineral fibres chrysotile, crocidolite and erionite. Panels I, II and III: chrysotile-treated M0, M1 and M2 macrophages, respectively. Panels IV, V and VI: crocidolite-treated M0, M1 and M2 macrophages, respectively. Panels VII, VIII and IX: erionite-treated M0, M1 and M2 macrophages, respectively. Typical morphologies of the fibres are highlighted with yellow arrows. The scale bar represents 30 μm. (B) Raman spectra of the mineral fibres chrysotile (I), crocidolite (II) and erionite (III) in M0 macrophages, acquired in the low-wavenumber spectral range. Photoluminescence bands of Cr3+ emissions are marked with asterisks (*). (C) Raman spectra of the mineral fibres chrysotile (I), crocidolite (II) and erionite (III) in M0 macrophages, acquired in the high-wavenumber spectral range. The Raman bands between ~2800 and 3100 cm−1 are attributed to CH stretching modes due to the cellular signals.
In all three investigated mineral fibres, impurities consisting of non-fibrous micrometric crystals were detected inside the cells along with fibrous phases, as previously reported in the literature (
Table 1). In CHR-treated macrophages, bundles of curvilinear chrysotile fibres with splayed/frayed terminations and thinner and shorter single fibres were observed (
Figure 1A, panels I, II and III); minor contributions of other minor fibrous and lamellar phases (balangeroite and antigorite, respectively) were also detected in addition to the non-fibrous content. CRO fibres showed a thin and rigid morphology with variable lengths (
Figure 1A, panels IV, V and VI). ERI fibres were typically shorter than the other mineral fibres, exhibiting a more uniform size distribution (
Figure 1A, panels VII, VIII and IX). The mineral fibres inside the three types of differentiated phagocytic cells were identified by their characteristic Raman spectra, acquired in both the low- and high-wavenumber spectral ranges, and the positions of the main peaks were highlighted (
Figure 1B,C). For serpentine minerals, the lattice and internal vibrational modes were similar in different polymorphs, demonstrating that OH stretching signals are distinctive characteristics for the identification of the mineralogical phase in CHR-treated cells
[29][30]. In addition to CHR (curve I in
Figure 1B,C), the lamellae of antigorite and balangeroite fibres were detected as minor contributions (
Table 1)
[31]. Additionally, micrometric crystals consisting of impurities were observed in CHR-treated macrophages, highlighting the presence of iron compounds (
Table 1)
[32]. Furthermore, in the low range, it was possible to detect the photoluminescence bands of Cr
3+ emissions at ~671 and 680 nm due to the presence of chromium as a trace element in the CHR fibres (marked with asterisks in curve I in
Figure 1B)
[33]. In CRO-treated macrophages, CRO was identified by its peculiar Raman spectrum (curve II in
Figure 1B,C)
[34][35], and minor phases—including iron-bearing micro-crystals—were observed (
Table 1)
[36][37]. Erionite was the main fibrous mineral phase detected in ERI-treated macrophages, with minor tabular clinoptilolite
[38]. Here, iron-bearing impurities—as identified in SEM and TEM analyses in previous studies
[28]—were not observed through micro-Raman analyses, as they are generally smaller than the minimum detectable size, considering the spatial resolution of the spectrometer. It is noteworthy that for all three types of polarised macrophages, the Raman signals of cells were always found along with those of the analysed mineral fibres, and no differences in the signals were detected for each mineral fibre in the three types of differentiated macrophages. Cellular signals were especially clear from their CH stretching bands in the spectral range ~2800–3100 cm
−1 (
Figure 1C).
Table 1. General information on the mineral fibres investigated in this study. Impurities detected in the present work and in
[28][32][36][37]. Fibre lengths and widths from Reference
[9].
| Mineral Fibre |
Impurities |
Fibre Length (µm) |
Fibre Width (µm) |
Chrysotile
(Balangero, Turin, Italy) |
Antigorite, balangeroite, calcite, clinochlore, diopside, dolomite, magnetite, microcline, plagioclase, talc, mackinawite, hematite, ilmenite, lepidocrocite, Fe-Ni sulphide, Fe-Mg carbonate |
* Min: 4.02
Mean: 34.7
** Max: 188 |
Min: 0.18
Mean: 0.59
Max: 1.17 |
Crocidolite
(UICC) |
Hematite, magnetite, quartz, talc, lizardite, calcite, siderite, minnesotaite |
Min: 2.52
Mean: 16.1
Max: 131 |
Min: 0.23
Mean: 0.64
Max: 1.98 |
Erionite
(Jersey, Nevada, USA) |
Clinoptilolite, iron-rich nanoparticles, iron oxides/hydroxides, nontronite |
Min: 3.23
Mean: 9.39
Max: 55.0 |
Min: 0.25
Mean: 0.55
Max: 6.70 |
* Minimum; ** Maximum.
3. Acute Toxicity of Mineral Fibres
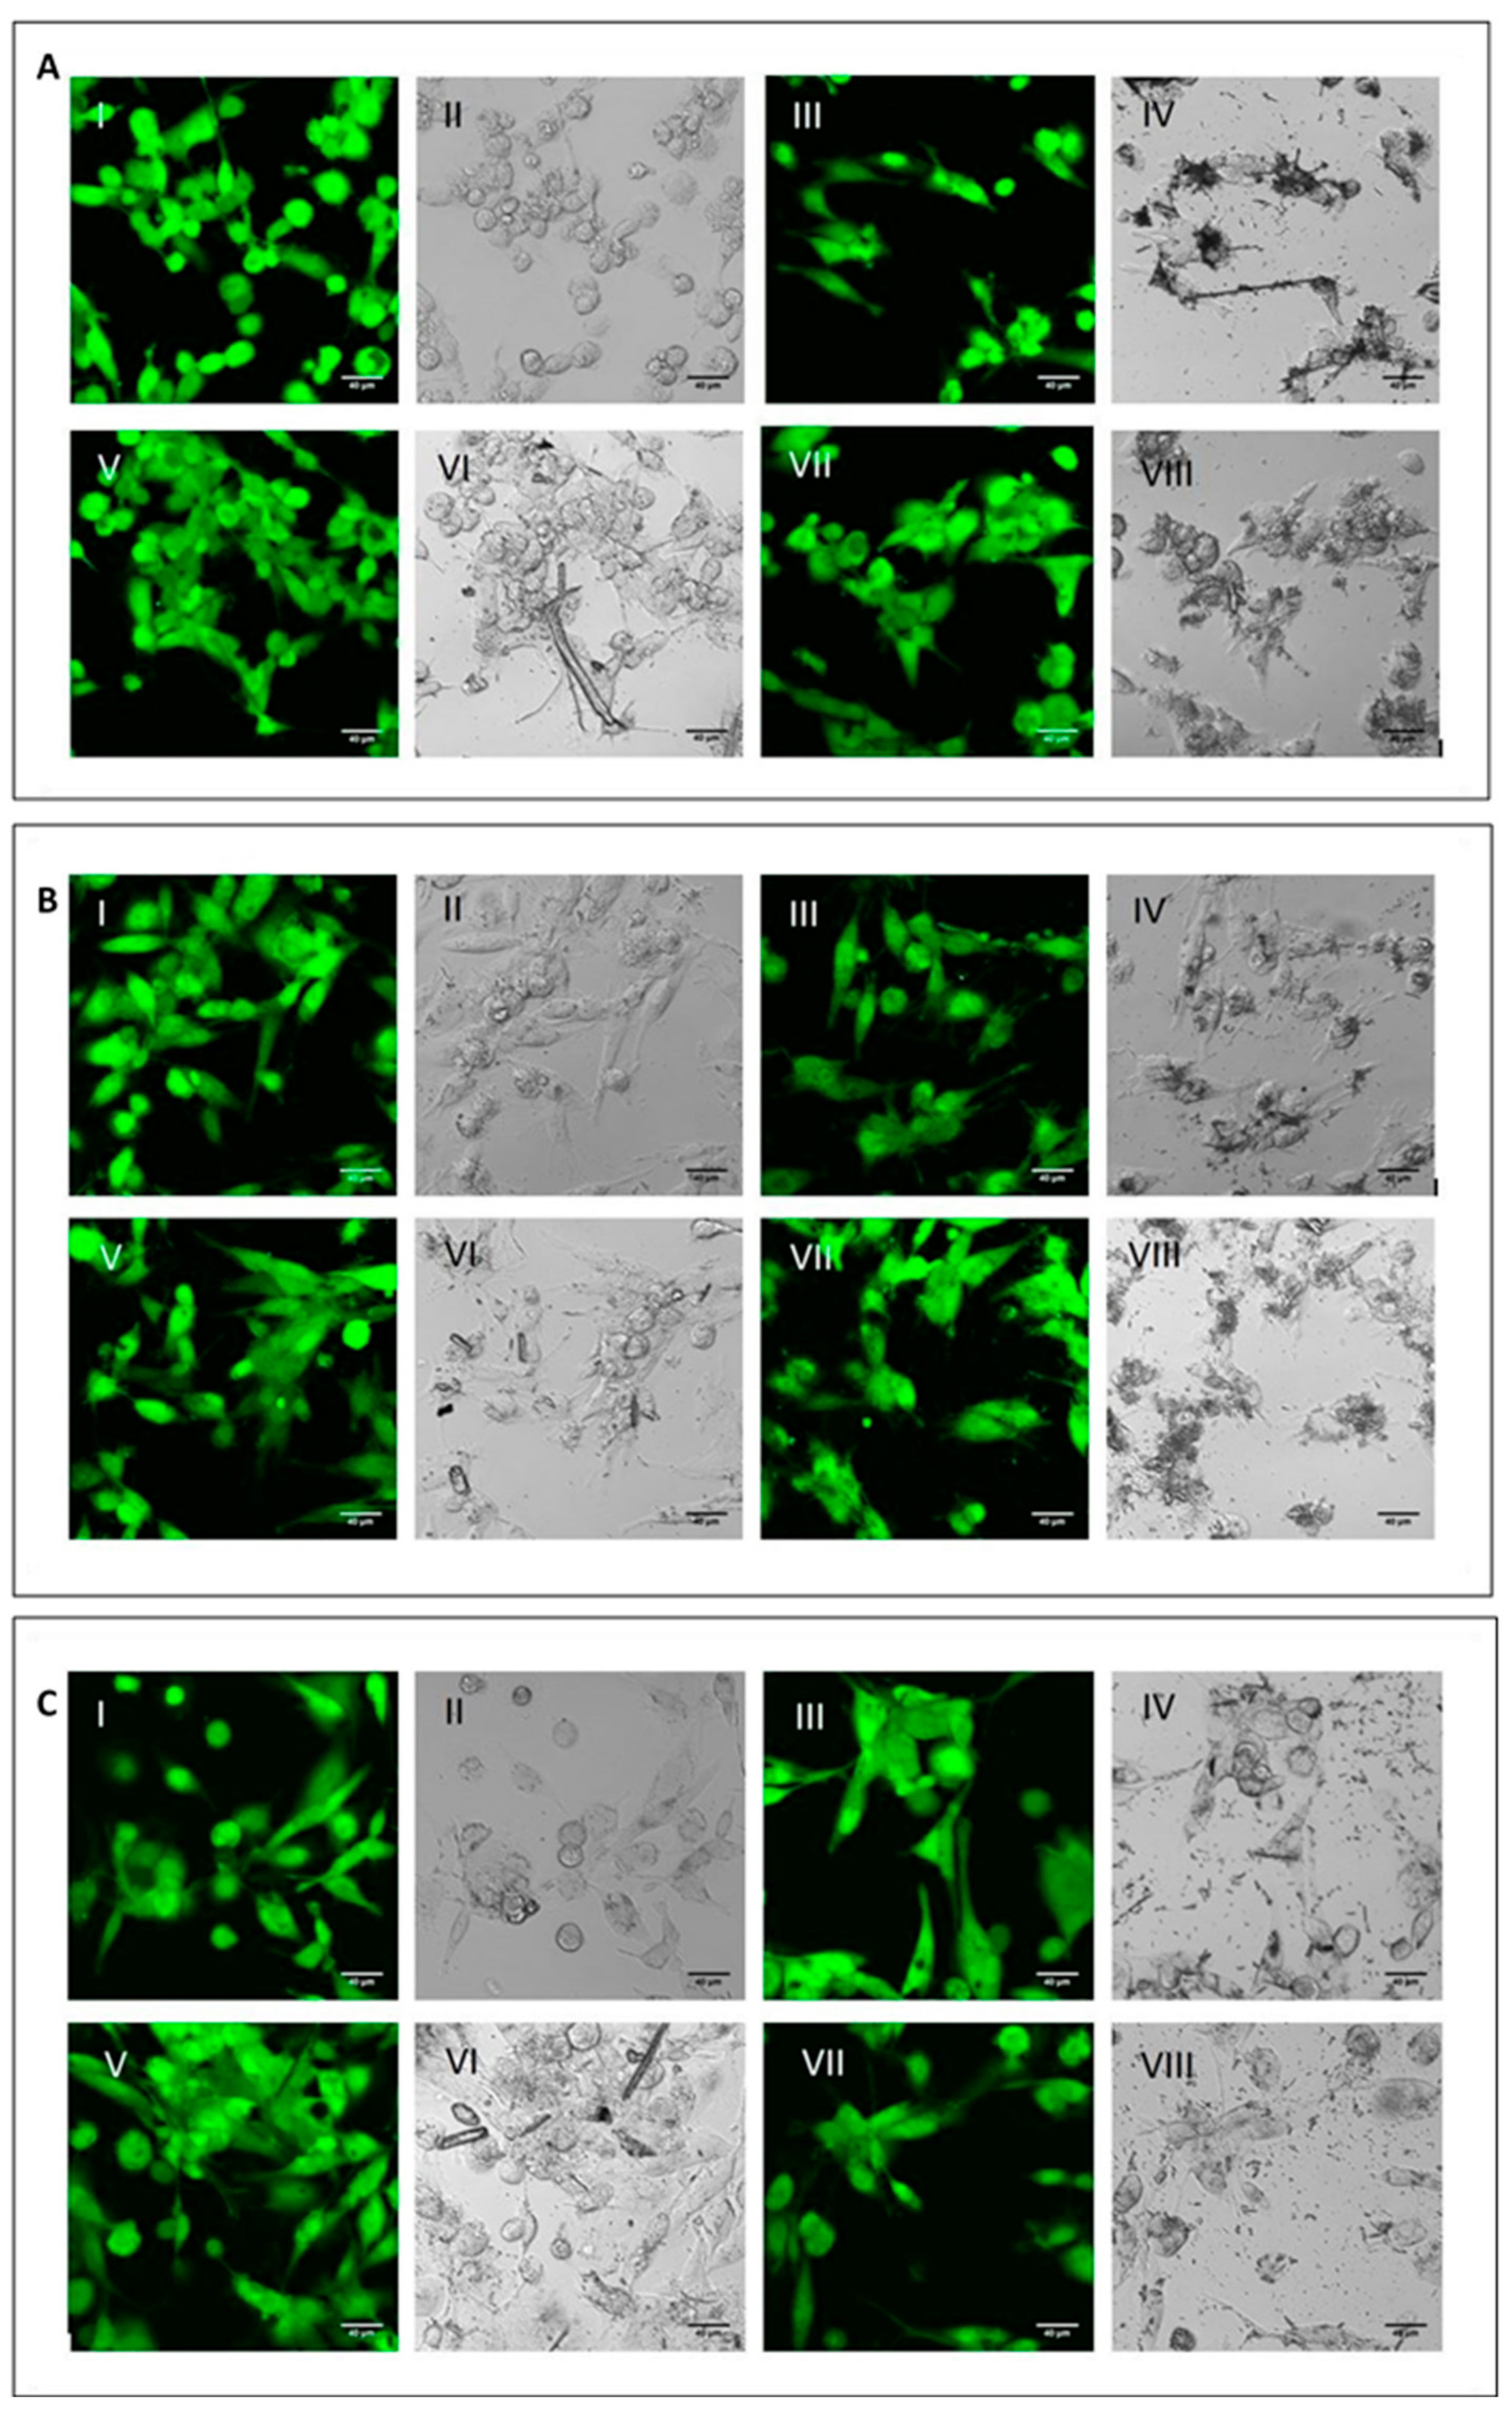
To analyse the cell viability and the phagocytic ability of M0, M1 and M2 macrophages, the differentiated cells were incubated with the three mineral fibres. After 4 h of incubation, researchers used calcein-AM staining—a green-fluorescent dye used to label live cells—to determine if the phagocytic cells had engaged and internalised the particles and if this had already affected cell viability (Figure 2).
Figure 2. Qualitative evaluation of short-term cytotoxicity. (A) Visualisation by confocal microscopy analysis (2.5 × digital zoom) in fluorescence mode (panels I, III, V and VII) and in phase contrast (panels II, IV, VI and VIII) of M0 macrophages following 4 h of incubation in the presence or absence of mineral fibres at 50 µg/mL and staining with calcein-AM. Panels I-II: control; panels III-IV: CRO; panel V-VI: CHR; panels VII-VIII: ERI. The white bar represents 40 µm. (B) Visualisation of pro-inflammatory M1 macrophages in the same conditions as cells in panel (A). (C) Visualisation of alternatively activated M2 macrophages in the same conditions as cells in panel (A).
For all three macrophage types, M0 (
Figure 2A), M1 (
Figure 2B) and M2 (
Figure 2C), there were no differences in fluorescence positivity between control cells (panels AI-II, BI-II and CI-II for M0, M1 and M2 macrophages, respectively) and fibre-treated cells (panels III-IV CRO, panels V-VI CHR and panels VII-VIII ERI, respectively). In fact, in all experimental conditions, cells showed intense green cytoplasmic fluorescence, meaning that after 4 h of treatment with the fibres, no signs of cytotoxicity were visible yet. Nonetheless, in all types of macrophages, it was possible to observe the presence of the different types of mineral fibres inside the cytoplasm of the cells when the size of the fibres was short enough to allow their phagocytosis. From a qualitative point of view, M2 macrophages showed a higher number of mineral fibres dispersed at the bottom of the well, especially for CRO (panel C-IV) and ERI (panel C-VIII), compared to M0 and M1 macrophages (panels A and B), which had already captured many fibres or were in direct contact with them. The observed phenomenon may indicate that M2 macrophages are less able to engulf the mineral fibres compared to the other two phenotypes. This is plausible since this type of macrophage polarisation should have a more anti-inflammatory role
[7].
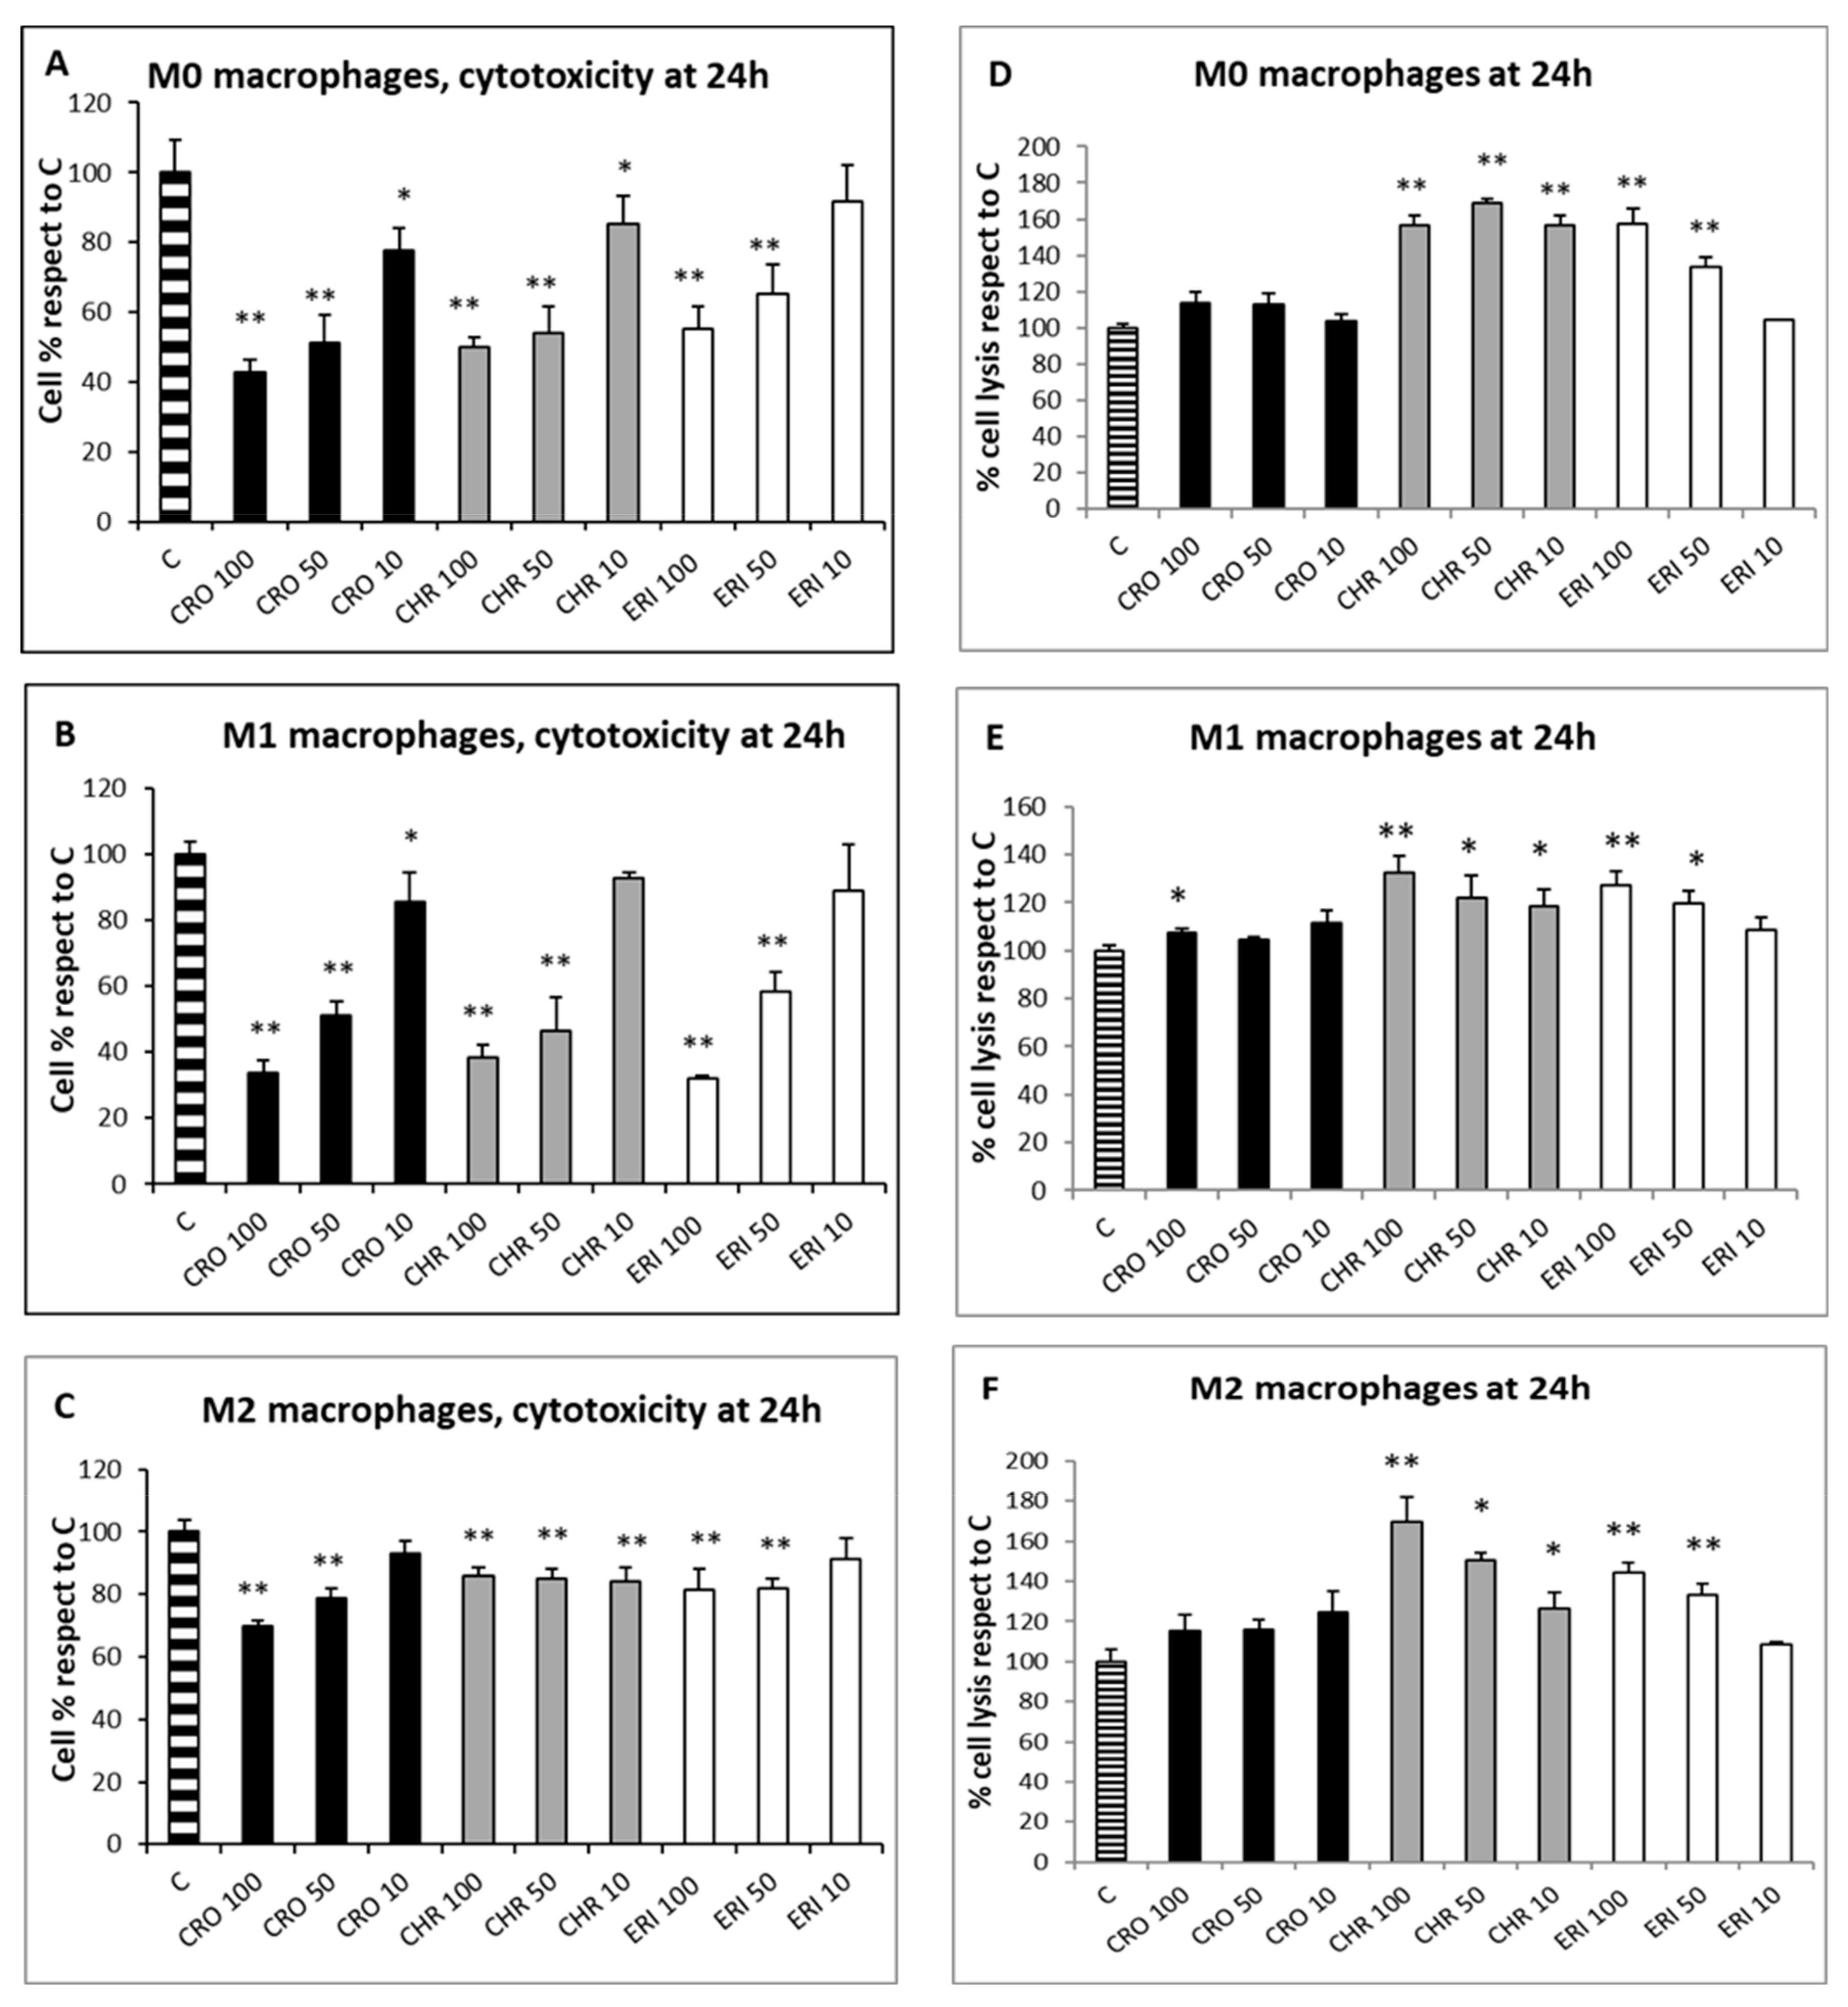
Since the qualitative assessment of macrophage viability by calcein staining showed no significant signs of toxicity after 4 h of fibre treatment, the MTT test was used to evaluate the cytotoxic effects of CRO, CHR and ERI (Figure 3, panels A–C, black, grey and white bars, respectively) in macrophages after 24 h. This assay measures mitochondrial enzyme activity by quantifying resultant alterations of energy metabolism and, ultimately, cell death. The viability index showed that there was a dose-dependent toxic effect resulting in a significant cell death rate in both M0 and M1 macrophages after exposure to all three fibres, while CRO exhibited a similar behaviour only in M2 cells. In M0 macrophages (Figure 3A, black bars), CRO caused a dose-dependent cell death rate of 57%, 49% and 22% at 100, 50 and 10 µg/mL, respectively, compared to control cells. Similarly, CHR (grey bars) induced cell death rates of 49%, 46% and 14% at the same fibre concentrations compared to control cells. In M0 macrophages, ERI (white bars) showed slightly lower toxicity compared to asbestos fibres, with significant death rates (45% and 35%) only at the two highest fibre concentrations (100 and 50 µg/mL, respectively) compared to control cells.
Figure 3. Cell toxicity evaluation and cell lysis assessment after exposure to mineral fibres. (A) M0 macrophage cytotoxicity evaluation by the MTT test at 24 h in the presence of 100, 50 and 10 μg/mL of the mineral fibres CRO (black bars), CHR (grey bars) and ERI (white bars). Results are expressed as cell percentages relative to control cells (striped bar) and are the mean ± SD of three independent experiments performed in quadruplicate. Asterisks indicate the significance in a paired Tukey test (ANOVA, p < 0.0001; Tukey vs. C: * p < 0.05, ** p < 0.005, respectively). (B) Pro-inflammatory M1 macrophage cytotoxicity evaluation in the same conditions as (A). ANOVA, p < 0.000005; Tukey vs. C: * p < 0.05, ** p < 0.005, respectively. (C) Alternatively activated M2 macrophage cytotoxicity evaluation in the same conditions as (A). ANOVA, p < 0.000001; Tukey vs. C: ** p < 0.005. (D) Cell lysis assessment measured by quantification of LDH release in the cell medium at 24 h in M0 macrophages after incubation with 100, 50 and 10 μg/mL of the mineral fibres CRO (black bars), CHR (grey bars) and ERI (white bars). Results are expressed as percentage of cell lysis relative to control cells (striped bar) and are the mean ± SD of three experiments performed in quadruplicate. Asterisks indicate significance in paired Tukey test (ANOVA, p < 0.0005; Tukey vs. C: ** p < 0.005). (E) Cell lysis assessment measured in the same conditions as (D) in pro-inflammatory M1 macrophages. ANOVA, p < 0.01; Tukey vs. C: * p < 0.05, ** p < 0.005, respectively. (F) Cell lysis assessment measured in the same conditions as (D) in alternatively activated M2 macrophages. ANOVA, p < 0.01; Tukey vs. C: * p < 0.05, ** p < 0.005, respectively.
Exposure to the three mineral fibres also induced a relevant cytotoxic effect in M1 macrophages (Figure 3B). The dose-dependent cell death rate after exposure to CRO was higher in M1 cells than in M0 cells (66%, 49% and 14% at 100, 50 and 10 µg/mL, respectively, compared to control cells). CHR at 100 and 50 µg/mL was also more cytotoxic in M1 than in M0, with cell death percentages ranging from 61% to 53%, respectively, compared to control cells. Regarding ERI, a strong cytotoxic effect was observed at 100 and 50 µg/mL (68% and 41%, respectively, compared to control cells).
M2 macrophages (
Figure 3C) demonstrated a dose-dependent cytotoxic effect during exposure to CRO, although the cell death rates were lower than those found in M0 and M1 cells, with percentages ranging from 30% to 21% at 100 and 50 µg/mL, respectively, compared to control cells. CHR showed minor but significant cytotoxicity; cell death values were similar at all concentrations and around 14–15% compared to control cells (
p < 0.005 vs. C for all). Finally, ERI slightly induced cell death in M2 cells only at 100 and 50 µg/mL, with a 19% reduction in viability at both concentrations compared to control cells (
p < 0.05 vs. C for both). Overall, CRO and CHR showed a higher acute toxicity rate, strongly affecting energy metabolism and causing a significant cell death rate, than ERI in M0, M1 and M2 macrophages. In particular, for CRO treatment, their results are in line with a previous work
[22], where a similarly high THP-1 macrophage cytotoxicity rate was observed in the first 24 h of exposure. Furthermore, lower fibre-induced cytotoxicity was observed in M2 macrophages compared to the other two phenotypes; this finding can be ascribed to their anti-inflammatory role and consequent lower phagocytic activity, leading to a reduced cell death rate due to frustrated phagocytosis.
To assess the nature of macrophage cell death, two analyses were performed: the lactate dehydrogenase (LDH) assay, which can be considered a cell death marker since the leakage of this cytosolic enzyme in the cell medium occurs following plasma membrane disturbance, and the annexin/propidium iodide positivity assay, measured by confocal microscopy to establish the level of cellular apoptosis. The LDH assay was performed on the three types of differentiated macrophages in contact with the fibres at three concentrations (100, 50 and 10 µg/mL) for 24 h to quantify cell death caused by plasma membrane damage (Figure 3D–F). The assay showed that, for all of the polarised macrophages, the rates of cellular damage observed after exposure to CRO were comparable to the control (Figure 3D–F black bars). Conversely, all types of differentiated macrophages showed a certain degree of plasma membrane cell damage during treatment at all concentrations of CHR (grey bars) and at the two highest concentrations of ERI (100 and 50 µg/mL, white bars). In particular, in M0 cells (Figure 3D), the degree of cellular damage induced by CHR was not dose-dependent, and the relative values of LDH release were 1.56-, 1.68- and 1.56-fold higher than control cells at 100, 50 and 10 µg/mL, respectively, while for ERI, significant dose-dependent plasma membrane cell damage was observed, with values 1.58- and 1.33-fold higher than control cells at the two highest fibre concentrations. The trend was similar in M1 macrophages (Figure 3E), although levels of cell membrane damage were observed to be lower compared to M0 cells. In particular, for CHR treatment, the increase in necrotic events compared to control cells was 1.32-, 1.22- and 1.18-fold at 100, 50 and 10 µg/mL, respectively, while for ERI, it amounted to 1.27- and 1.19-fold compared to control cells at 100 and 50 µg/mL.
The same trend was also evident in M2 cells (Figure 3F), since all tested concentrations of CHR induced an increase in cell lysis in the culture (1.69-, 1.50- and 1.26-fold increase at 100, 50 and 10 µg/mL, respectively), as was also observed with 100 and 50 µg/mL of ERI (1.44- and 1.33-fold for 100 and 50 µg/mL, respectively).
In general, in all differentiated macrophages, exposure to CRO was not able to induce cell lysis, meaning that the high rates of cytotoxicity, measured by the alteration of energy metabolism through the MTT test at 24 h for the same fibre (
Figure 3A–C), are the result of other death mechanisms. On the other hand, significant levels of cell lysis were observed after treatment with CHR or ERI. Indeed, in the case of ERI, their results confirm recent findings in the U937 monocyte cell line model, which also demonstrated the direct damage of cell membranes in contact with the fibres
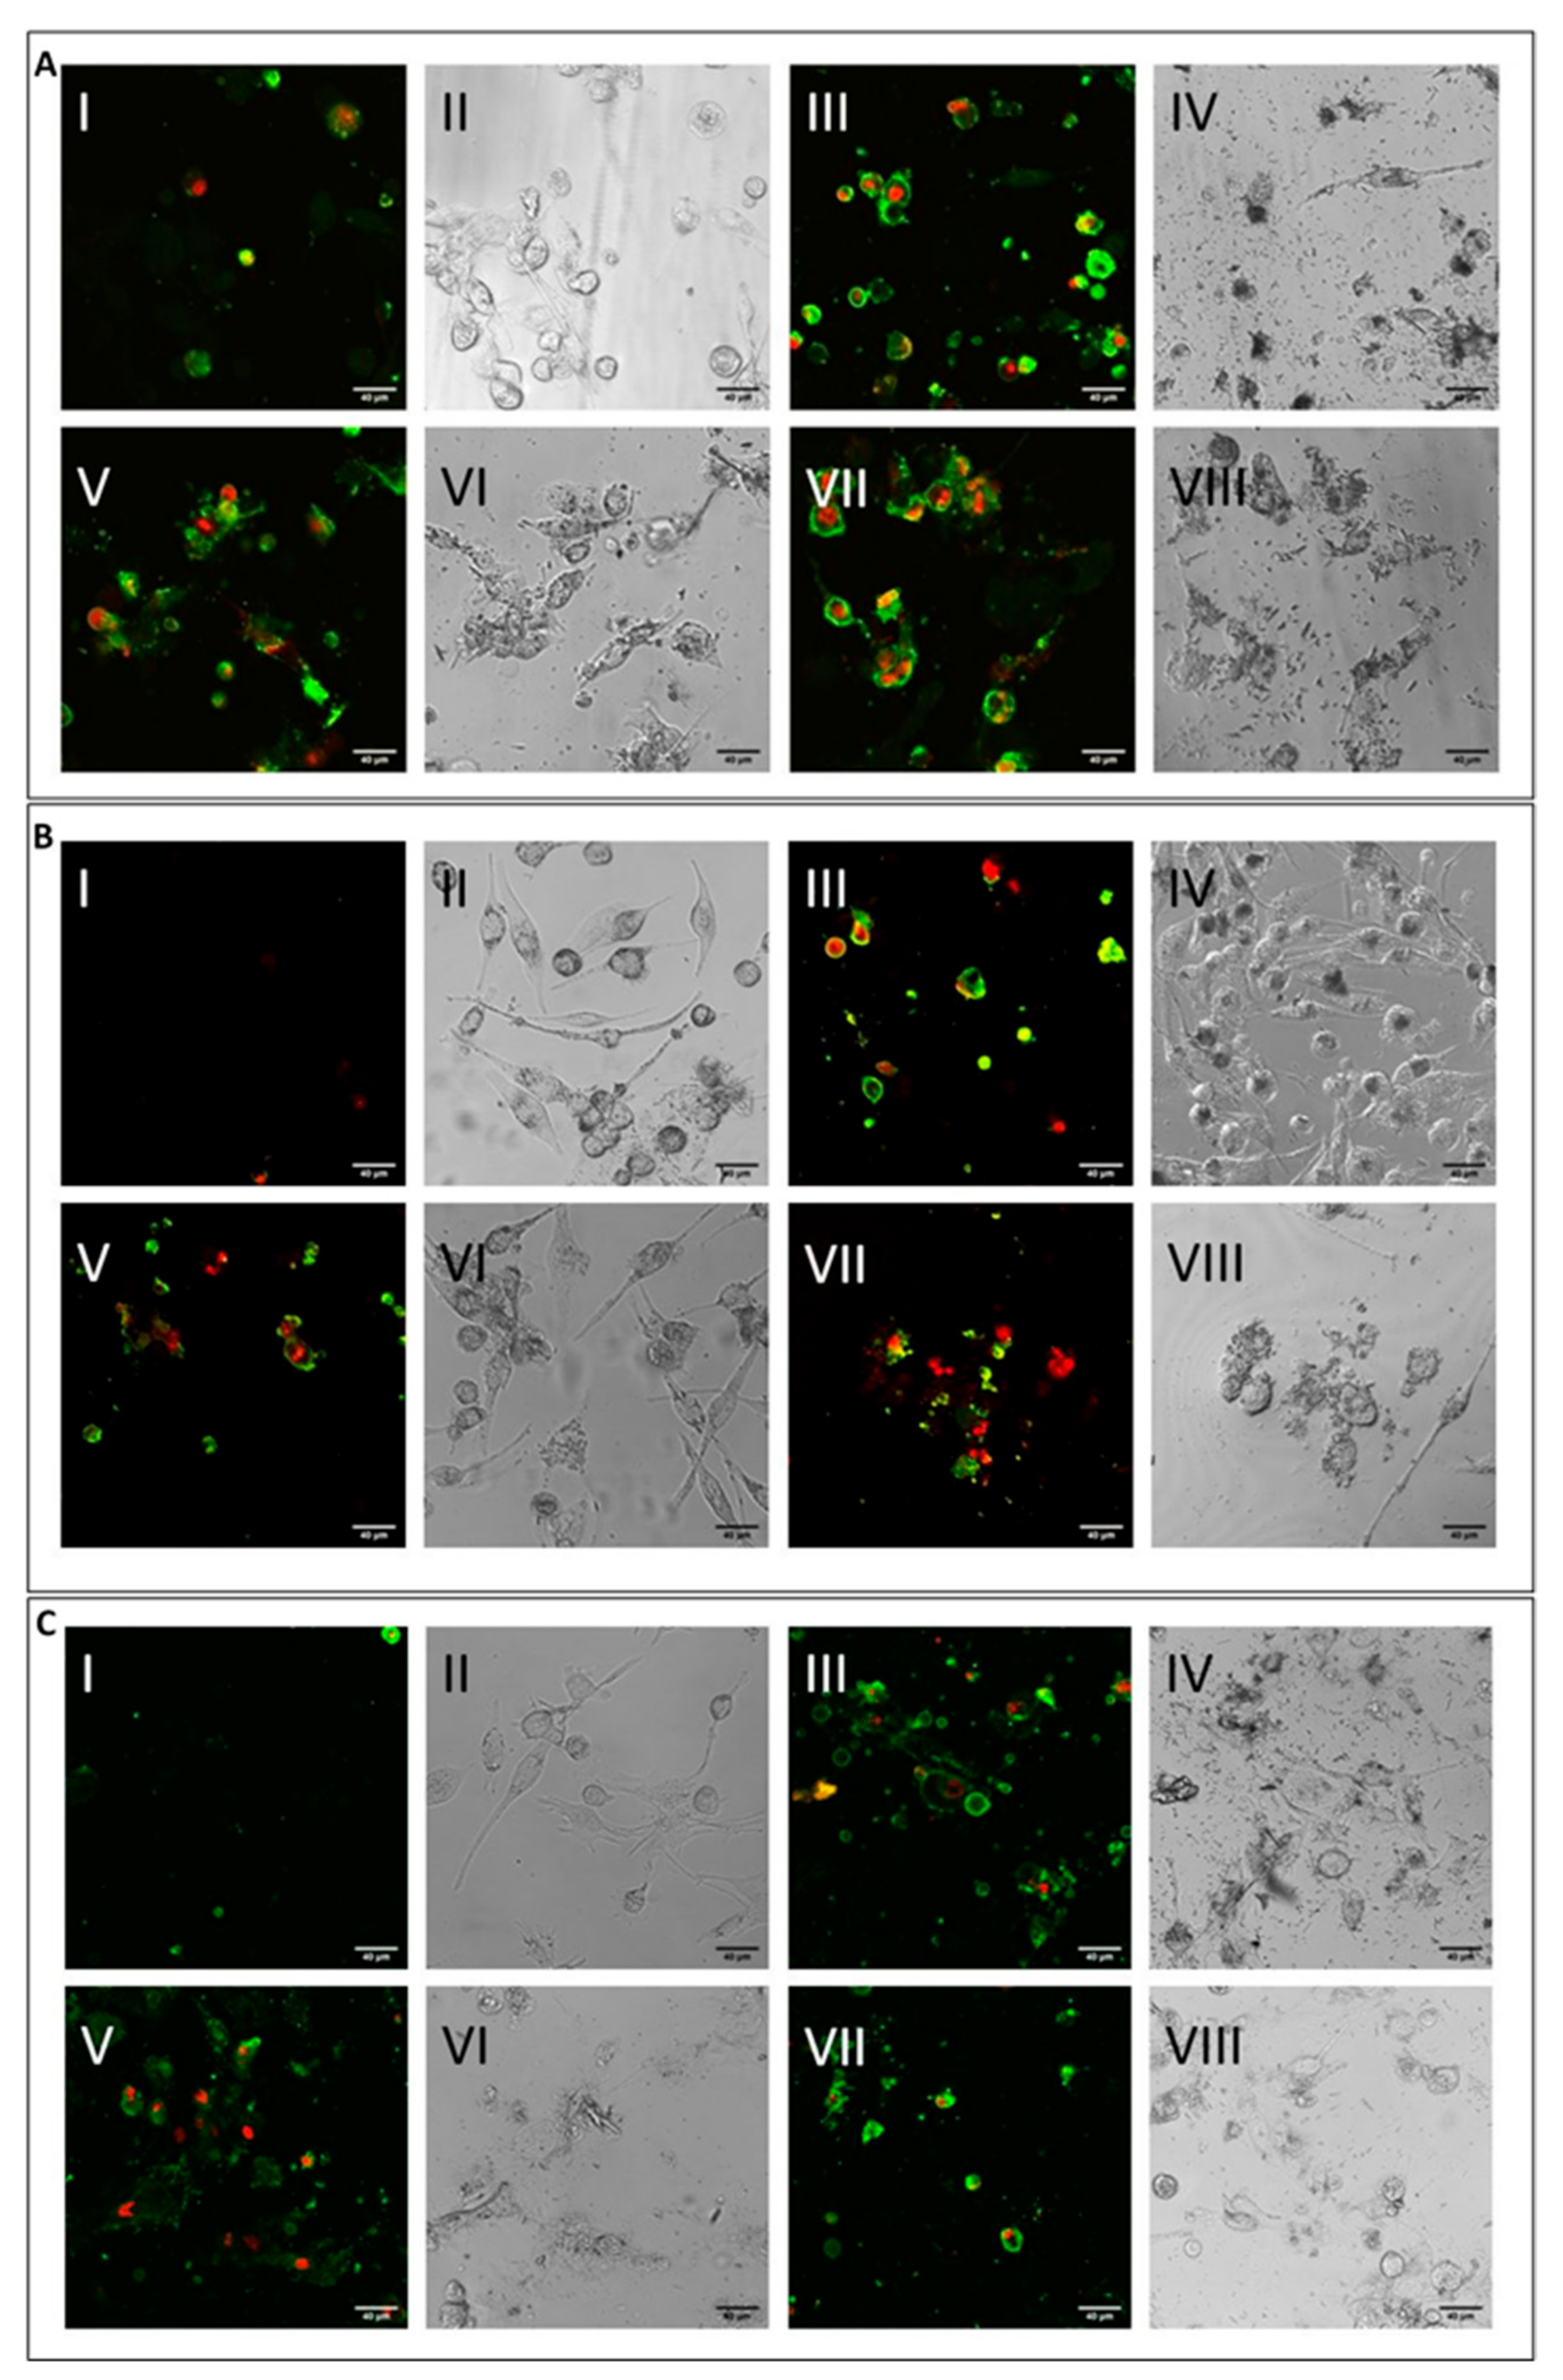
[39]. The level was higher for CHR compared to ERI, and this result may point towards multifactorial cytotoxic activity, with cell membrane alteration at least partially capable of inducing cell death. To test this hypothesis, cells were treated with the mineral fibres for 24 h and analysed by confocal microscopy using annexin/propidium iodide staining to both qualitatively (
Figure 4) and quantitatively (
Figure 5) assess their apoptotic state. Confocal microscopy analysis indicated that in all types of differentiated macrophages (
Figure 4A, M0 macrophages; 4B, M1 macrophages; 4C, M2 macrophages), although at different rates, all fibres (
Figure 4A–C: panels III-IV CRO, panels V-VI CHR and panels VII-VIII ERI, respectively) caused the significant induction of both early (only green positivity) and late apoptosis (concomitant green/red positivity) compared to control cells (
Figure 4A–C: panels I-II in each figure).
Figure 4. Cell apoptosis assessment by confocal microscopy analysis. (A) Visualisation by confocal microscopy (2.5 × digital zoom) in fluorescence mode (panels I, III, V and VII) and in phase contrast (panels II, IV, VI and VIII) of M0 macrophages following 24 h of incubation in the presence or absence of mineral fibres at 50 µg/mL and staining of annexin-positive (green) and/or propidium iodide–positive (red) cells. Panels I-II: control; panels III-IV: CRO; panels V-VI: CHR; panels VII-VIII: ERI. The white bar represents 40 µm. (B) Visualisation of pro-inflammatory M1 macrophages in the same conditions as cells in panel (A). (C) Visualisation of alternatively activated M2 macrophages in the same conditions as cells in panel (A).
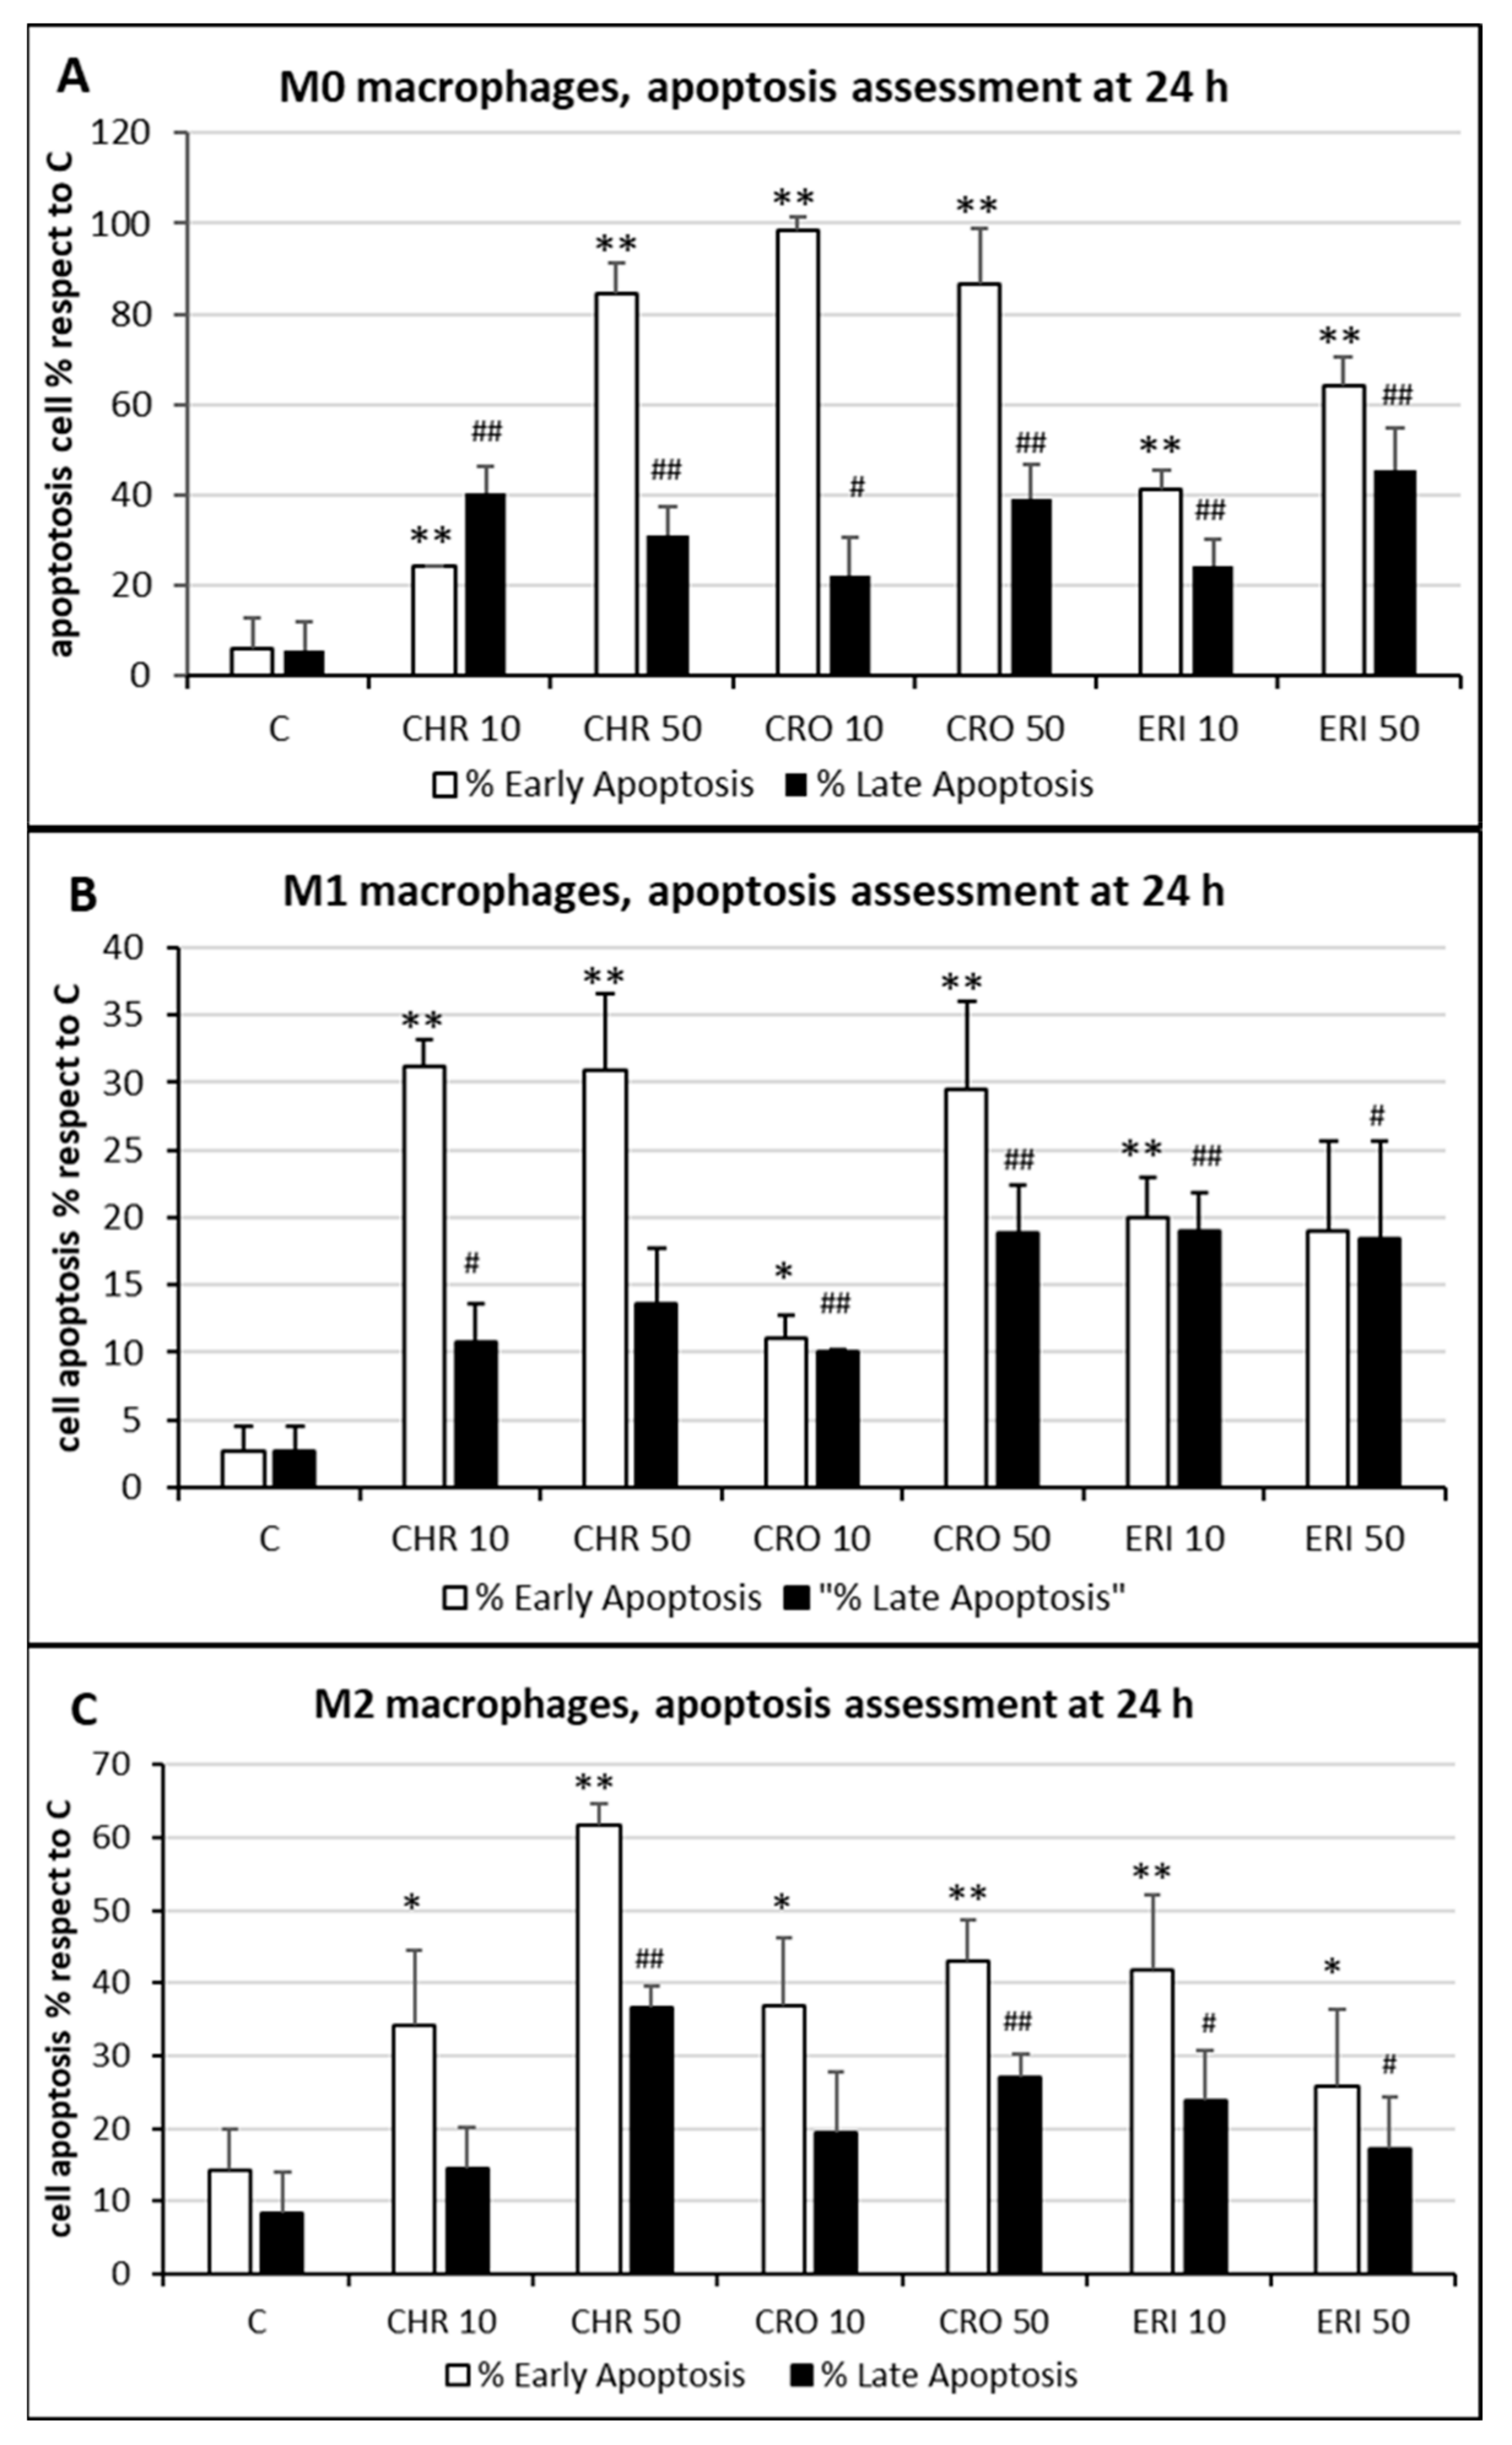
Figure 5. Cell apoptosis quantification. (A) The quantitative analysis of early (annexin-positive, white bars) and late (both annexin-positive and propidium iodide-positive, black bars) apoptotic M0 THP-1 cells treated with 50 and 10 μg/mL of CRO, CHR and ERI relative to the total number of cells observed by confocal microscopy after 24 h; results are the mean ± SD of counts from five microphotograph. Asterisks indicate significance in Tukey test (ANOVA for white bars p < 0.000001; Tukey vs. C, ** p < 0.005, respectively; ANOVA for black bars p < 0.0005, Tukey vs. C, ## p < 0.005, # p < 0.05, respectively). (B) The same analysis in pro-inflammatory M1 macrophages. ANOVA for white bars p < 0.00005; Tukey vs. C, ** p < 0.005, * p < 0.05, respectively; ANOVA for black bars p < 0.0001, Tukey vs. C, ## p < 0.005, # p < 0.05, respectively. (C) The same analysis in alternatively activated M2 macrophages. ANOVA for white bars p < 0.00001; Tukey vs. C, ** p < 0.005, * p < 0.05, respectively; ANOVA for black bars p < 0.00005, Tukey vs. C, ## p < 0.005, # p < 0.05, respectively.
The quantitative assessment of the apoptotic state, obtained by counting and calculating the mean of only green and red–green cells in five different fields of confocal microscope images for each treatment, is shown in
Figure 5. In M0 cells (panel A), CRO induced the highest levels of early signals of apoptosis at both concentrations tested (white bars, 98% and 86% for 10 and 50 μg/mL CRO, respectively,
p < 0.005 vs. C, for both bars). Early apoptosis signals after exposure to CHR and ERI were nonetheless significant and dose-dependent, although lower than those after exposure to CRO (white bars, 24% and 84% for 10 and 50 μg/mL CHR, and 41% and 64% for 10 and 50 μg/mL ERI, respectively,
p < 0.005 vs. C for all bars). In contrast, regardless of the concentration used, the number of late apoptotic cells after 24h of treatment was similar for all fibres (black bars, from ~20 to ~40%,
p < 0.005 vs. C). These data, showing an increase in apoptotic levels for all fibres, are in agreement with the apoptosis assessment in THP-1 M0 cells in their previous work
[9], which was performed with a shorter incubation time (8 h), indicating further progression of the apoptotic phenomenon in these cells over time. On the other hand, compared to M0 cells, M1 macrophages (panel B) showed slightly reduced levels of apoptosis. Indeed, in M1 cells, the highest rates of early apoptosis were 31% for both 10 and 50 μg/mL CHR (white bars,
p < 0.005 vs. C for all), although all values of early apoptosis were found to be significant compared to control cells (~20% for 10 and 50 μg/mL ERI with
p < 0.005 vs. C for both bars, 11% for 10 μg/mL CRO and 29% 50 μg/mL CRO with
p < 0.05 and
p < 0.005 vs. C, respectively). In addition, all mineral fibres induced late apoptosis to a certain degree (black bars), ranging from ~10% to ~19%, with the highest values measured for 10 and 50 μg/mL ERI and 50 μg/mL CRO (
p < 0.05 vs. C for all bars). Finally, M2 macrophages (panel C) showed the highest rates of early apoptosis after CHR treatment (white bars, 37% and 62% for 10 and 50 μg/mL CHR, respectively,
p < 0.005 vs. C for both) and a lower rate for CRO (37% and 43% for 10 and 50 μg/mL CRO, respectively,
p < 0.005 vs. C for both) and ERI (41% and 26% for 10 and 50 μg/mL ERI, respectively,
p < 0.05 vs. C). Regarding late apoptosis, in these cells, it was significantly increased only by the highest concentrations of CHR and CRO compared to control cells (black bars, 37% for 50 μg/mL CHR and 27% for 50 μg/mL CRO, respectively,
p < 0.005 vs. C for both). Conversely, both concentrations of ERI appeared to induce significant levels of late apoptosis (24% and 17% for 10 and 50 μg/mL ERI, respectively,
p < 0.05 vs. C for both).
Overall, their data indicate that the three types of fibres are able to induce significant damage, resulting in the alteration of energy metabolism, cell membrane lysis and/or apoptosis and likely macrophage activation through phagocytosis. The overall phenomena, together with the incapability of macrophages to completely digest engulfed fibres and the induction of apoptosis resistance in macrophages by the fibres through activation of mitochondrial NOX4 over time
[15], lead to a state of prolonged local inflammation and the release of inflammatory cytokines prodromal to the onset of cancer
[40][41]. Furthermore, macrophages internalising small fibres may survive in the short term and may act as carriers that transport particles towards the inner lung parenchyma and the mesothelium. The chronic inflammatory state caused by undigested fibres in activated macrophages at these new sites, as well as the direct interaction of the transported fibres with epithelial and mesothelial cells, will then set up a favourable microenvironment for cell transformation and carcinogenesis.