Your browser does not fully support modern features. Please upgrade for a smoother experience.
Please note this is an old version of this entry, which may differ significantly from the current revision.
Subjects:
Agriculture, Dairy & Animal Science
Uveal melanoma (UM) remains the most common intraocular malignancy among diseases affecting the adult eye. The primary tumor disseminates to the liver in half of patients and leads to a 6 to 12-month survival rate, making UM a particularly aggressive type of cancer.
- HTR2B
- STAT proteins
- uveal melanoma
1. Introduction
Uveal melanoma (UM) is the most common intraocular malignancy in adults, with an incidence of four to six affected individuals per million in the United States [1]. Despite effective primary therapy, approximately 50% of patients will develop the metastatic disease [2]. Liver metastasis is a dreaded complication of this cancer as patients rarely survive more than five years following the initial detection of metastasis, with a death rate reaching 92% at two years [3]. Microarray analyses identified 12 genes, designated as the UM gene expression signature, that can distinguish between UM primary tumors that are at low or high risk of progressing towards the liver metastatic disease. The human gene encoding the 5-Hydroxytryptamine receptor 2B (HTR2B), also known as the serotonin receptor 2B, turns out to be the most discriminating among the class II genes for the identification of UM patients at high risk of evolving toward formation of liver metastases [4,5,6]. The serotonin receptors to which HTR2B belongs are gathered into a family of proteins that can be divided in seven subfamilies (HTR1-7). Interestingly, HTR2B has been described as an oncogene in hepatocellular carcinoma (HCC), prostate, small intestine and breast cancers [7,8,9], but as a tumor suppressor in ovarian cancer [10]. In addition to its function as a neurotransmitter, serotonin plays a role in its development, and most of its biological actions are transmitted within the cell through the activation of a few signal transduction pathways including the phospholipase C (PLC), the Receptor Tyrosin Kinase (RTK)/Phosphatidylinositol-4,5-bisphosphate-3-kinase (PI3K)/Extracellular signal-Regulated Kinase (ERK)/mammalian target of rapamycin (mTOR), the RAF/Mitogen activated protein Kinase Kinase (MEK)/ERK and the Janus kinase/Signal Transducer and Activator of Transcription proteins (JAK/STAT) pathways [10,11,12,13,14,15]. Although the serotonin-mediated activation of the JAK/STAT pathway has been shown to rely essentially on the 5-HT1A or 5-HT2A receptors [14,16,17,18], recent evidence also suggests that the HTR2B receptor might participate as well in the activation of this signal transduction pathway in uveal melanoma [19].
2. Expression of HTR2B Responds to Stimulation by IL4 and IL6 in Uveal Melanoma
The previous experiments demonstrated that all UM cells express STAT proteins to different levels. However, this does not necessarily reflect the activation status of these transcription factors in unstimulated cells. We therefore verified both the total and phosphorylated STAT1, STAT3 and STAT5 proteins present in all our UM cell lines. These STAT family members were selected for this analysis as they are the most often involved in cancer development and also because they are expressed to relatively high levels in UM cells. As shown on Figure 3A, a large proportion of the STAT1, STAT3 and STAT5 proteins expressed by T97 and T108 is phosphorylated. On the other hand, T142 also expresses phospho-STAT3 but has no detectable phospho-STAT1 or phospho-STAT5. As for T142, T143 UM cells also had no detectable phospho-STAT1 nor phospho-STAT5 and only a weak level of phospho-STAT3. As T142 has a barely detectable level of total STAT1 and no activated STAT1, we therefore selected this UM cell line to verify whether it would respond to stimulation of STAT1 activation by interleukins 4 (IL-4) and 6 (IL-6). As expected, control T142 UM cells expressed no detectable level of total or phosphorylated STAT1 (Ctl; Figure 3B). However, the addition of either IL-4 or IL-6 dramatically increased expression of total STAT1 (Figure 3B,C). Furthermore, both these interleukins proved to be very efficient at activating STAT1, since as little as 100 pM considerably increased phosphorylation of this transcription factor in T142 cells relative to the unstimulated controls (Figure 3B).
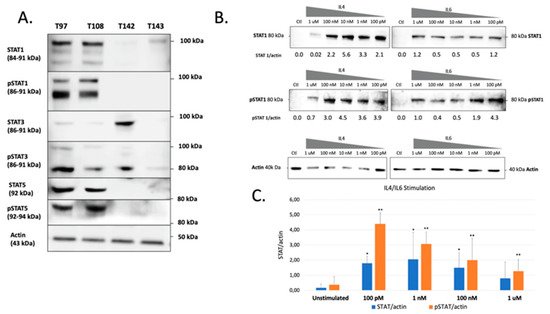
Figure 3. Western blot analysis of total and phosphorylated STAT1, STAT3 and STAT5 in UM cell lines. (A) Proteins from the UM cell lines T97, T108, T142 and T143 were Western blotted using antibodies that recognize only the phosphorylated (phospho-STAT1, phosphor-STAT3 and phosphor-STAT5) or total (comprising both inactive and phosphorylated) STAT1, STAT3 or STAT5 proteins (STAT1, STAT3 and STAT5). T97 and T108 UM cells express phosphorylated STAT1, STAT3 and STAT5 whereas T142 and T143 only express moderate and low levels of phospho-STAT3, respectively. The molecular mass of each STAT isoform is indicated in parenthesis. Actin is shown as a control. (B) Western blot analysis of either total (STAT1) or phosphorylated (pSTAT1) STAT1 in T142 UM cells that have been grown alone (Ctl) or in the presence of increasing doses (100 pM to 1 µM) of IL-4 and IL-6. The ratio of total (STAT1/actin) and phosphorylated (pSTAT1/actin) STAT1 over that of actin is also shown for both IL-4 and IL-6 stimulation. (C) Graph representation of the STAT/actin and pSTAT/actin ratios in either unstimulated or IL-4/IL-6 stimulated T142 UM cells. The addition of either IL-4 or IL-6 dramatically increased expression of total STAT1. Actin is shown as a control. * and **: Values considered to be statistically significant from those obtained for unstimulated total (STAT/actin) and phosphorylated (pSTAT/actin) STAT1, respectively (p value < 0.01).
That three DREs with a perfect match to the STAT consensus sequence could be found in the HTR2B gene promoter and 5′-flanking sequence does not warrant that they would resolve the appropriate activated STAT response in vitro. In order to verify whether expression of HTR2B indeed responds to activated STAT proteins, we cultured both T142 and T143 UM cells in the presence of varying concentrations (100 pM to 1 µM) of IL-4 and IL-6 and evaluated whether this would alter expression of HTR2B at the protein level. Consistent with the results shown on Figure 3, expression of HTR2B considerably increased in both T142 (4.7-fold increases in the HTR2B/actin ratio in the presence of IL-4 and IL-6 relative to negative controls, respectively) and T143 UM cells (7.7- and 11.5-fold increases in the HTR2B/actin ratio in the presence of IL-4 and IL-6 relative to controls, respectively) when as little as 100 pM of either IL-4 and IL-6 were added to the culture medium, relative to untreated cells (negative controls) (Figure 4). The HTR2B/actin ratio remained fairly stable as the concentration of both IL-4 and IL-6 is increased to 1 µM. We therefore conclude that expression of HTR2B increases in response to STAT-mediated interleukin signaling.
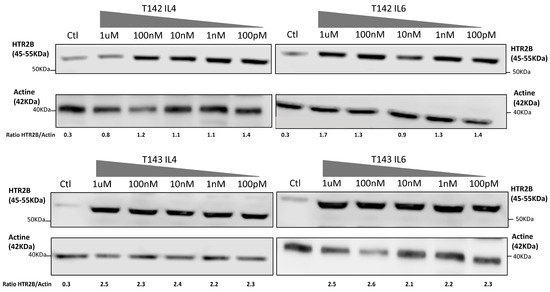
Figure 4. Expression of HTR2B in response to stimulation with IL-4 and IL-6. Expression of HTR2B was monitored by Western blot in both T142 and T143 UM cells cultured either alone (Ctl) or in the presence of increasing concentrations of IL4 and IL6 (100 pM to 1 µM). Values shown beneath each blot correspond to the ratio of the HTR2B signal over that of actin. Both IL-4 and IL-6 considerably increased expression of HTR2B in T142 and T143 UM cells relative to untreated cells (negative controls).
3. Contribution of the STAT Family of Transcription Factors to the Expression of the Serotonin 2B (HTR2B) Receptor in Human Uveal Melanoma
The increase in the molecular mass of STAT2 (a slight increase in that of STAT5 was also observed) in the metastatic T142 UM cell line relative to its apparent MW in the non-metastatic T143 cell line is believed to result from post-translational modifications (PTMs) in T142 cells that are not occurring in T143 UM cells. Besides PTMs such as phosphorylation, ubiquitination, ISGylation, SUMOylation and acetylation, that do not significantly affect the molecular mass of the affected proteins, STATs have also been shown to be subjected to glycosylation, which, on the other hand, can cause substantial alterations in the electrophoretic mobility of the targeted proteins [37,38]. Indeed, wheat germ agglutinin affinity chromatography revealed that STAT1, STAT3, STAT5A, STAT5B and STAT6 are glucose-modified through the addition of O-linked N-acetylglucosamine (O-GlcNAc) residues on threonine or serine residues [39]. Serine/threonine phosphorylation of STAT1, STAT3 and STAT5 has been shown to contribute to the etiology of certain human cancers and immunodeficiencies [40]. In many cancers, STAT5 activation and its oncogenic gene expression is not only enhanced, but also kept persistent, whereas signaling involving activation of STAT5 is rather transient under physiological conditions. Interestingly, cancer-specific metabolic changes enhance glycosylation, which subsequently modulates STAT5 activity through enhanced tyrosine phosphorylation. Reducing the glycosylation status of the hyper-phosphorylated STAT5A variant, via glucose depletion or hypoxia, has been reported to restore transcription of oncogenic target genes back to their wild type level [41]. Glycosylation of proteins at threonine and/or serine residues, including transcription factors such as Sp1, SMAD4, DeltaLf (Delta-lactoferrin) and Nrf1 (Nuclear factor E2-related factor 1), to name a few, has been suggested to protect them from proteasomal degradation by masking nearby amino acids that are normally ubiquitinated [42,43,44,45,46], therefore increasing their steady-state stability. Therefore, and based on these observations, we can assume that the glycosylation status of both STAT2 and STAT5 might be related to the aggressiveness of the T142 UM cell line by ensuring an abnormally elevated intracellular signalization which also causes an increased expression of their target genes, such as HTR2B. Further experiments aimed at investigating the glycosylation status of STAT proteins in UM cells will surely prove particularly interesting as it may link this PTM to the UM metastatic properties.
The fact that both IL4 and IL6 not only contributed to the activation of STAT1 in T142 UM cells but also somehow restored its expression at the protein level (as very little STAT1 protein could be detected by Western blot in unstimulated UM cells) is particularly interesting, as it suggests STAT1 gene transcription to be under the control of a positive feedback loop in T142 cells. Indeed, STAT1 has been shown to contribute to the transcription of its own gene through the presence of multiple STAT binding sites located within the STAT1 gene proximal promoter, and mutation of these sites was found to disrupt reporter gene activity in response to leukemia inhibitory factor (LIF) [47]. Both the presence of an immune inflammatory phenotype and the tumor size correlates with a poor clinical prognosis in uveal melanoma. Interestingly, abnormally elevated levels of many cytokines, including IL-2, IL-4, IL-6 and IL-8, have been observed in the vitreous of eyes from patients with uveal melanoma [48,49,50,51,52]. IL-6 appears to be an important player in UM tumor progression, as increased expression in the level of this cytokine also correlates with an increased tumor prominence and the presence of both macrophage and Treg infiltration of the primary tumor [48]. Among the tumor hallmarks of UM angiogenesis, the IL6-JAK-STAT3 pathway has been well-described to promote cancer progression as well as immunosuppression in an autocrine manner [53]. In the UM, activation of this signalization cascade also induces the trans-activation of the JunB subunit from the transcription factor AP-1, which, in turn, also promotes UM epithelial-mesenchymal transition and aggressiveness in UM [54].
Systemic therapies, including immunotherapy, have yielded poor results in the treatment of uveal melanoma [55]. Therefore, searching for new immune modulatory targets, incoming immunotherapy biomarkers and combined immune strategies with drugs offer a new therapeutic paradigm. Recent studies have shown an encouraging result in cutaneous melanoma (phase I clinical study) using these approaches [55]. However, despite the common origin from neural crest-derived cells, uveal and cutaneous melanomas have few overlapping genetic signatures. As a consequence, many therapies that have proven effective in cutaneous melanoma have little or no success in uveal melanoma. Immunotherapy with checkpoint inhibition showed promising results in the treatment of cutaneous melanoma, however, it did not appear to be equally effective with uveal melanoma. Moreover, angiogenesis seems to confer a worse prognosis to UM when compared to cutaneous melanoma [56]. Better insight into the molecular and genetic profile of uveal melanoma, such as the interest given in our study to the contribution of STAT family members to the expression of the serotonin receptor HTR2B, will facilitate the identification of new prognostic biomarkers and thus enable us to adapt the existing immunotherapy procedures in order to develop new forms of treatments specifically designed for uveal melanoma patients [57]. STAT family members have been involved in human cancer progression, development, survival, and resistance to treatment. This is especially the case for both STAT3 and STAT5 that are considered either as oncogenes or tumor suppressors, depending on the context and the delicate balance between the different counteracting transcription factors involved [23]. Immunotherapy approaches have been extensively investigated in recent years, and since these transcription factors are key members in the immune system response, it comes as no surprise that they are also embedded in the growing collection of potential new immune modulatory targets. Assessing the STAT signaling pathway and expression of its constituting mediators have been shown to predict sensitivity to immunotherapy and targeted STAT inhibition [23]. Knowing that STAT members are under the control of immune, interleukin/cytokine signals that differ from one patient to another may prove particularly informative as to whether any specific patient is a potential candidate for immunotherapy, depending on his STAT/interleukins/cytokines expression status.
In immunotherapy approaches, most attention is paid to the targeted inhibition of immune checkpoints using monoclonal antibodies, especially against PD-1 (programmed cell death protein 1), a cell-surface receptor that acts to restrain T cell-mediated immune responses when activated by its specific ligand PD-L1 (programmed death ligand 1) [58]. STAT1 and STAT3 are considered as potential biomarkers to define patients who are more likely to respond to immunotherapy, as both these family members induce the expression of PD-L1 [59,60,61]. Consequently, their baseline expression levels could be an indicator of PD-L1 manifestation in the tumor micro-environment, and thus help predict response to anti-PD-L1 immunotherapy [61]. According to recent developments, STAT1 emerged as a potential immunotherapy biomarker. Indeed, in their study, Zemek et al. compared the gene expression profiles of immune checkpoint inhibition responsive and non-responsive tumors in mice and validated their findings in cohorts of patients with cancer treated with immune checkpoint blocking antibodies [59]. They found that responsive tumors were characterized by an inflammatory gene expression signature consistent with an up-regulation of STAT1 signaling. This is particularly appealing in that their findings rendered possible the use of a biomarker-driven approach to patient management in order to properly establish whether a patient would benefit from treatment with sensitizing therapeutics before immune checkpoint blockade. In our study, the presence of a STAT2 protein with an abnormally elevated molecular mass combined to the presence of activated STAT3 distinguishes the T142 metastatic from the other non-metastatic UM cell lines and therefore militates toward a deeper involvement of both STAT2 and STAT3 in the aggressiveness of uveal melanoma. Analysis of the STAT2 and STAT3 expression and activation profiles in additional UM primary tumors and UM cell lines should prove particularly interesting to decipher whether both these mediators can be used as diagnostic markers for the identification of patients at risk of evolving toward liver metastatic disease.
This entry is adapted from the peer-reviewed paper 10.3390/ijms23031564
This entry is offline, you can click here to edit this entry!