This work present a survey for the main methods that calculate how many individuals are in a physical region. We start by reviewing traditional computer vision methods and then review deep learning-based methods.
- deep learning
- computer vision
- Crowd counting
Definition:Crowd counting refers to estimating the number of individuals who share a certain region. The following subsections review different methods that calculate how many individuals are in a physical region.
1. Introduction
Automatic crowd scene analysis refers to investigating the behavior of a large group of people sharing the same physical area [1]. Typically, it counts the number of individuals per region, tracks the common individuals’ trajectories, and recognizes individuals’ behaviors. Therefore, automatic crowd scene analysis has many essential applications. It monitors the spread of the COVID-19 virus [2] via ensuring physical distance between individuals in stores, parks, etc. Securing public events, such as sports championships [3], carnivals [4], new year celebrations [5], and Muslim pilgrimage [6], is another application of automatic crowd scene analysis. Crowd scene analysis supplies surveillance camera systems with the ability to extract anomalous behaviors from a huge group of people [7,8,9]. Furthermore, analysis of crowd scenes of public places such as train stations, super stores, and shopping malls can show the effect of crowd path or the shortcomings of the design. Consequently, these studies can better safety considerations [10,11].
2. Crowd Counting
The following subsections review different methods that calculate how many individuals are in a physical region. For completeness, we start by reviewing traditional computer vision methods and then review deep learning-based methods.
2.1. Traditional Computer Vision Methods
2.1.1. Detection-Based Approaches
Early approaches used detectors to detect peoples’ heads or shoulders in the crowd scene to count them, such as in [16,17]. Counting by detection is usually performed either in monolithic detection or parts-based detection. In monolithic detection, the detection is usually performed based on pedestrian detection methods such as optical flow [18], histogram of oriented gradient (HOG) [19], Haar wavelets [20], edgelet [21], Particle flow [22], and shapelets [23]. Subsequently, the extracted features from the former detectors are fed into nonlinear classifiers such as Support Vector Machine (SVM) [24]; however, the speed is slow. A linear classifier such as linear SVM, hough forests [25], or boosting [26] usually provides a trade-off between speed and accuracy. Then, the classifier is slid over the whole image to detect candidates and to discard the less confident candidates. The results of sliding give the number of people in the scene.
The former methods cannot deal with the partial occlusion problem [27] when it is raised; therefore, part-based detection is adopted. Part-based detection focuses on body parts rather than the whole body such as the head and shoulders as in [17]. Part-based detection is more robust than monolithic, as reported in [17]. Based on 3D shapes [28], humans were modelled with ellipsoids, which was employed as a stochastic process [29] to calculate the number and shape configuration that best explains a segmented foreground object. Later on, Ge et. al [30] extended the same idea with the Bayesian marked point process (MPP) [31] with a Bernoulli shape prototype [32]. Zhao et al. [33] used Markov chain Monte Carlo [34] to exploit temporal coherence for 3D human models across consecutive frames.
2.1.2. Regression-Based Approaches
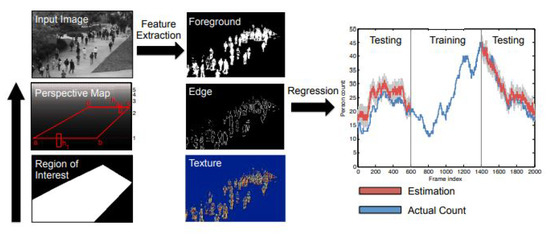
Although counting by detection or part-based approaches achieves reasonable results, it fails in very crowded scenes and under heavy occlusion. Counting by regression tries to mitigate the former problems. Typically, this method consists of two main components. The first component is extracting low-level features, such as Foreground features [35], texture [36], edge features [37], and gradient features [38]. The second component is mapping in a regression function, e.g., linear regression [39], piecewise linear regression [40], ridge regression [41], or Gaussian process regression, to map the extracted features into counts, as in [39]. The complete pipeline of this method is shown in Figure 1.
2.1.3. Density Estimation-Based Approaches
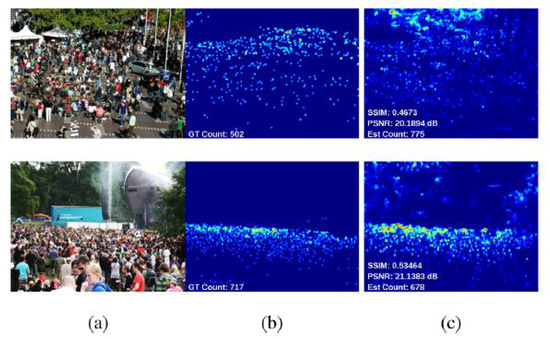
These approaches build a density map to represent the number of individuals per region in an input image, as shown in Figure 2. In [46], the author built density maps via linearly mapping local patch features to its corresponding object. Formulating the problem in this way reduces the complexity of separating each object to count it and reduces the potential of counting errors in case of highly crowded scenes. Estimating the number of objects in this method equates to integration over local batches in the entire image.
2.2. Deep Learning Approaches
Convolutional Neural Networks (CNNs) are similar to plain Neural Networks (NNs) from the perspective that they consist of neurons/receptive fields that have learnable weights and biases. Each receptive field receives a batch input and performs a convolution operation, and then, the result is fed into a nonlinearity function [55] (e.g., ReLU or Sigmoid). The input image to CNN is assumed to be an RGB image; therefore, the hidden layers learn rich features that contribute to the performance of the whole network (hidden layers and classifier). This structure has benefits in terms of speed and accuracy since the crowd scene images have lots of objects that need computationally expensive operations to detect. End-to-end networks mean the network takes the input image and directly produces the desired output.
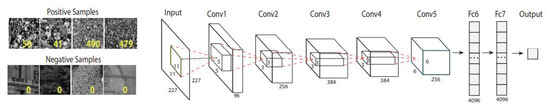
The pioneering work with deep networks was proposed in [56]. An end-to-end deep convolutional neural network (CNN) regression model for counting people of images in extremely dense crowds was proposed. A collected dataset from Google and Flickr was annotated using a dotting tool. The dataset consists of 51 images, each of which has 731 people on average. The least number of counts in this dataset is 95, and the highest count is 3714. The network was trained on positive and negative classes. The positive images were labelled with the number of the objects, while the negative images were labelled with zero.
Network architecture: This network consists of five convolutional layers and two fully connected layers. The network was trained on object classification with regression loss, as shown in Figure 3.
One of the newest state-of-the-art methods for accurate crowd counting came out in [65]. The authors proposed an attention-injective deformable convolutional network called ADCrowdNet that they claim can work accurately in congested noisy scenes. The network consists of two sections: Attention Map Generator (AMG) and Density Map Estimator (DME). AMG is a classification network that classifies the input image into a crowd image or background image. The product of AMG is then used as input to DME to generate a density map of the crowd in the frame. This process is described in Figure 6. ADCrowdNet achieved the best accuracy for crowd counting on the ShanghaiTech dataset [66], UCF_CC_50 dataset [42], the WorldExpo’10 dataset [60], and the UCSD dataset [39]. In [67], Oh et al. proposed an uncertainty quantification method for estimating the count of the crowd. This method is based on a scalable neural network framework that uses a bootstrap ensemble. Method PDANet (Pyramid Density-Aware Attention-based network) [68] generates a density map representing the count of the crowd in each region of input images. This density map is generated by utilizing the attention paradigm, pyramid scale features, decoder modules for crowd counting, and a classifier to assess the density of the crowd in each input image. In DSSINet (Deep Structured Scale Integration Network) [69], structured feature representation learning and hierarchically structured loss function optimization are used to count the crowd. In [70], Reddy et al. tackled the problem of crowd counting by adaptive few-shot learning. In [71], an end-to-end trainable deep architecture was proposed. This approach uses contextual information, generated by multiple receptive field sizes and learning the importance of each such feature at each image location, to estimate the crowd count in input images.
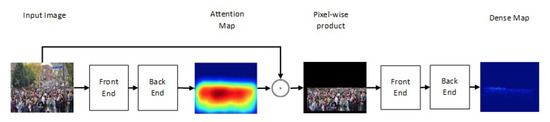
Figure 6. Structure of ADCrowdNet.
This entry is adapted from the peer-reviewed paper 10.3390/jimaging6090095