Your browser does not fully support modern features. Please upgrade for a smoother experience.
Please note this is an old version of this entry, which may differ significantly from the current revision.
Subjects:
Polymer Science
Poly(3,4-ethylenedioxythiophene):poly(styrenesulfonate) (PEDOT:PSS) has the merits of high electrical conductivity and solution processability, and can be dispersed in water. To improve the stretchability of PEDOT:PSS-based transparent electrode films, the intrinsically conducting polymer PEDOT:PSS was blended with highly stretchable nonionic waterborne polyurethane (WPU) and coated on a thermoplastic polyurethane (TPU) film. Nonionic WPU has good compatibility with PEDOT:PSS, without affecting the acidity.
- PEDOT:PSS
- waterborne polyurethane
- stretchable electronics
1. PEDOT:PSS/Nonionic WPU Composite
1.1. Compatibility of PEDOT:PSS and Nonionic WPU
Basically, the PEDOT chains are attached with PSS anions by electrostatic attraction and PSS roles the primary dopants for PEDOT. In this study, the chemical doping level was controlled through additional doping with H2SO4 or neutralization with ammonia. Sulfuric acid induced the PEDOT chains to form a crystalline nanofibril structure, in which positively charged PEDOT and negatively charged PSS were segregated [29]. As explained in more detail in Section 3.1.2, the intrinsic electrical conductivity of PEDOT:PSS influenced the maintenance of sheet resistance at stretched state. Cationic and anionic WPU undergo aggregation due to pH-induced collision. Figure 2a shows the aggregation of both positive and negative ions. Nonionic WPU has good compatibility with PEDOT:PSS over a wide pH range, as well as good dispersion properties, and storage stability. Figure 2b shows the effect of the R–group of WPU on the compatibility with PEDOT:PSS doped with sulfuric acid [23,30].
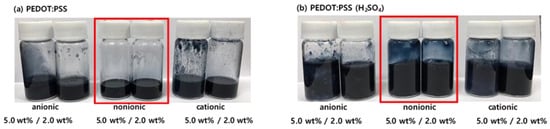
Figure 2. (a) Compatibility of PEDOT:PSS and (b) sulfuric acid-doped PEDOT:PSS with different types of WPU.
Anionic sulfone-containing groups, phosphonates, and carboxylic acids are the most commonly used R–groups. Polyurethane contains cationic groups, tertiary sulfur atoms, or quaternary nitrogen atoms. These ionic groups induce aggregation because the dispersion balance in the emulsion is broken owing to the reaction of the PSS acid.
This characteristic indicates that PEDOT:PSS can be mixed with WPU. The excellent compatibility of PEDOT:PSS with nonionic WPU was further demonstrated by EDS. Figure 3 shows the nitrogen and sulfur distribution in the PEDOT:PSS/nonionic WPU composite with 2.0 wt% WPU, coated on the TPU film. The nitrogen atoms come from the WPU and TPU films, while the sulfur atoms come from PEDOT:PSS. Nitrogen and sulfur were evenly distributed throughout the coating layer. These results indicate that the PEDOT:PSS/nonionic WPU forms a miscible polymer blend. The good miscibility of these two polymers can be attributed to their strong interactions. Hydrogen bonds may form between PSS and WPU because of the oxygen atoms in PSS and the NH groups in WPU. In addition, protons can be transferred from the –SO3H of PSS to the –NH of WPU. As a result, –SO3H is converted to negatively charged –SO3−, whereas –NH is converted to positively charged –NH2+. Therefore, there is a coulombic attraction between PSS and WPU [31].
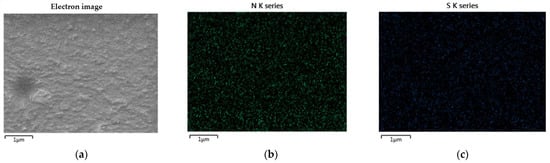
Figure 3. Scanning electron microscope (SEM) images and EDS elemental mapping images: (a) electron image; (b) nitrogen and (c) sulfur distribution in PEDOT:PSS/nonionic WPU (WPU 2.0 wt%) on TPU film.
As shown in Figure 4, The peaks between 3320 and 3335 cm−1 in the FTIR spectra of the films are attributed to the urethane and urea N–H groups. Two peaks located at approximately 3320 and 3450 cm−1 are often observed, which can be assigned to hydrogen bonding and non-hydrogen bonding N–H of the urethane and urea groups [32]. In this case, only a single peak at approximately 3333 cm−1 was visible, suggesting that most of the N–H groups are involved in hydrogen bonding. In this region, oscillatory peaks that gain intensity with the nature of the C=O group and its hydrogen bonding capacity appeared at different wavenumbers in the profile of WPU. Sharp peaks were distinguished at approximately 1720 cm−1, and shoulders were observed at approximately 1700 cm−1, assigned to the C=O groups of free urethane and the polyester groups, and hydrogen-bonded C=O of the urethane groups, respectively [32].
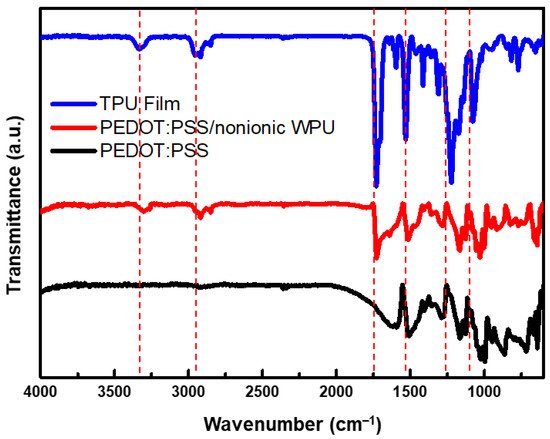
Figure 4. FTIR spectra of TPU film (Bare), PEDOT:PSS/nonionic WPU, and PEDOT:PSS coated on TPU film.
Nonionic WPU has good compatibility with acids. It exhibits good dispersibility and adhesion to the PSSH segments without PEDOT attached. It forms hydrogen bonds and coulombic interactions with PEDOT:PSS [33,34]. Acid doping is required to improve the electrical conductivity of PEDOT:PSS, and sufficient acid doping can be achieved in nonionic WPUs.
1.2. Preparation and Surface Morphology of the PEDOT:PSS/Nonionic WPU
To understand the role of WPU in improving the mechanical properties of PEDOT:PSS, AFM was used to investigate the surface morphology of the samples with and without WPU. The effects of the sulfuric acid doping level on the morphology of the films was observed by AFM imaging. The morphology of sulfuric-acid-treated PEDOT:PSS was uniform (Figure S2a). The AFM image of the film with 2.0 wt% of WPU added to PEDOT:PSS solution shows that WPU was well dispersed, giving rise to a uniform topology (Figure S2d,e).
The effect of the pH of PEDOT:PSS type on the electrical conductivity of the PEDOT:PSS solution with 2.0 wt% WPU is shown in Figure 5. For the PEDOT:PSS sulfuric acid-doped, acid(non-treated), and neutralized samples, the electrical conductivity changed from 799.2 to 248.3 S/cm, 450.0 to 117.3 S/cm, and 300.0 to 102.8 S/cm respectively. This is because WPU plays a non-conductive role in PEDOT:PSS, resulting in lower electrical conductivity. Although the same amount of WPU was added to each, the PEDOT:PSS doped with sulfuric acid/nonionic WPU showed the highest electrical conductivity. Even after the addition of the WPU, the electrical conductivity tended to be the same as the initial value for each PEDOT:PSS with different pH as shown in Figure 5a. In the composite with WPU, the soft WPU segment improved the adhesion to the TPU substrate film and the role of the matrix, resulting in less increase in the sheet resistance, even up to 200% strain (see Figure 5c). When nonionic WPU was used, better electrical conductivity could be obtained even at high strain, due to the compatibility with the sulfuric acid-doped PEDOT:PSS.
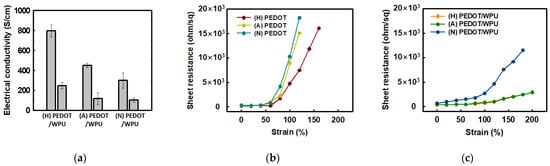
Figure 5. (a) Electrical conductivity of PEDOT:PSS (left) and PEDOT:PSS/nonionic WPU (2.0 wt%) (right) with PEDOT:PSS under different pH conditions; (b) sheet resistance of PEDOT:PSS films when TPU substrates were strained from 0% to 200%. (c) Sheet resistance of PEDOT:PSS films with PEDO:PSS/WPU (2.0 wt% WPU) when TPU substrates were strained from 0% to 200%. (N = PEDOT:PSS (neutral), A = PEDOT:PSS (acid), H = PEDOT:PSS (doped with sulfuric acid)).
1.3. Improvement in Mechanical Properties of PEDOT:PSS/Nonionic WPU
When the WPU loading in the solution of sulfuric acid-doped PEDOT:PSS was increased to 0.1, 0.2, 0.5, 0.7, 1.0, 2.0, 5.0, and 10.0 wt%, the electrical conductivity decreased to 655.0, 654.1, 599.2, 442.6, 336.6, 225.3, 89.8, and 45.4 S/cm, respectively (see Figure 6). The electrical conductivity of the polymer blend decreased sharply when the WPU content exceeded 2.0 wt%.
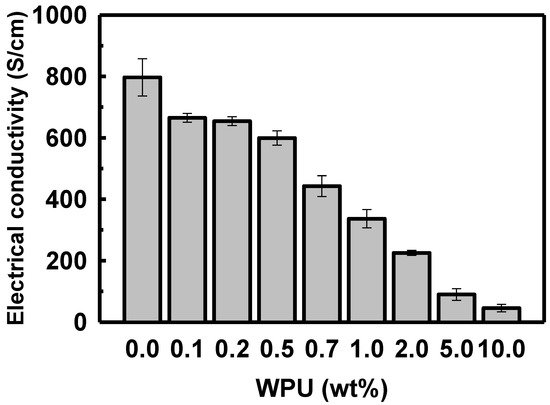
Figure 6. Electrical conductivity of PEDOT:PSS/nonionic WPU with various proportions of WPU in the PEDOT:PSS solution.
As shown in Figure 7, the change of the sheet resistance of PEDOT:PSS/nonionic WPU was observed for specific WPU contents divided into a range of low and high elongation. When the WPU content became more than 0.5 wt%, the sheet resistance was almost maintained even at 50% strain. Since only a little WPU was added, the initial sheet resistance was superior at 44 ohm/sq (Figure 7a,b). However, the initial sheet resistance increased a lot, approximately 400 ohm/sq, and the initial value maintained well even at 100% strain when the WPU content increased to 2.0 wt% (Figure 7c,d).
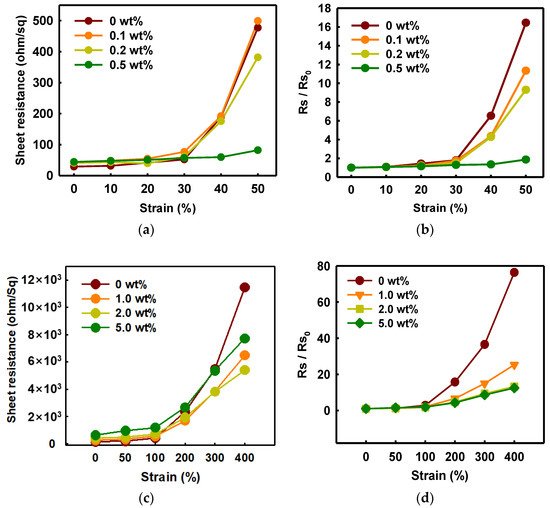
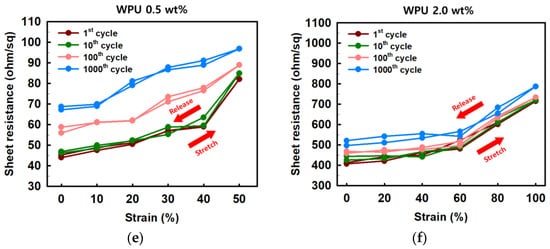
Figure 7. (a) Sheet resistance and (b) normalized sheet resistance of PEDOT:PSS films with various concentrations of WPU when TPU substrates were strained from 0% to 50%. (c) Sheet resistance and (d) normalized sheet resistance of PEDOT:PSS films with various concentrations of WPU when TPU substrates were strained from 0% to 400%. Strain–sheet resistance curves of PEDOT:PSS/nonionic WPU under stretch–release: (e) WPU 0.5 wt% at 50% strain and (f) WPU 2.0 wt% at 100% strain.
Through morphology analysis before and after stretching, the crack that interferes with the electrical pathway was observed. In the case of 50% strain or higher, the only PEDOT:PSS film showed the crack, whereas the PEDOT:PSS/nonionic WPU 0.5 wt% showed the wrinkled surface that dissipated the fore under elongation (see Figure 8(a3,a6)). The morphology images matched the change of sheet resistance of Figure 7. The WPU content required for 50% strain and 100% strain was optimized to 0.5 wt% and 2.0 wt%, respectively.
Figure 8. Scanning electron microscope (SEM) images of (a) PEDOT:PSS only and PEDOT:PSS/nonionic WPU (0.5 wt%) coated on TPU substrate after strain and release with 20 and 50% strain. (b) PEDOT:PSS only and PEDOT:PSS/nonionic WPU (2.0 wt%) coated on TPU substrate after strain and release with 50 and 100% strain. (1) and (4) under 0% strain, (2), (3), (5) and (6) after one stretch-release different strains.
As shown in Figure 7e,f, the stretch–release cycling test was conducted by the PEDOT:PSS/nonionic WPU 0.5 wt% at strain 50% and PEDOT:PSS/nonionic WPU 2.0 wt% at strain 100%. In both cases, the stretchable electrode films showed the superior deformability that presented the recovering with the initial sheet resistance after stretch–release. Even after 1000 cycle repetitions of stretch–release, the sheet resistance only changed by 1.5 times.
1.4. Mechanical Properties of Other Substrate Materials
By comparing the TPU and PDMS substrates, it was possible to observe the change in the adhesion and sheet resistance according to the strain that emerges owing to the difference in the substrate (see Figure 9a). Both the WPU and TPU films have reactive polyester groups; therefore, the adhesion was good. With the PDMS substrate, the sheet resistance increased sharply above 50%, even when WPU was added. Because the PDMS surface is hydrophobic, the strain and coating layers peeled off when subjected to different strains (Figure 9b). the TPU with high surface energy as the substrate film improved the deformability of PEDOT:PSS/nonionic WPU more than the PDMS with low surface energy.
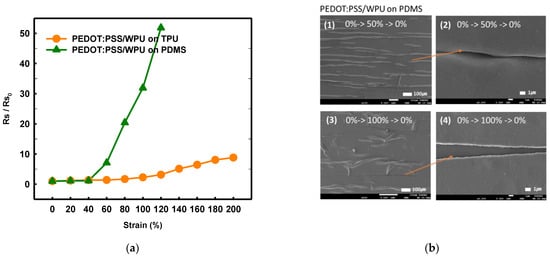
Figure 9. (a) Normalized sheet resistance of PEDOT:PSS/nonionic WPU (2.0 wt%) on TPU film and PEDOT:PSS/nonionic WPU on PDMS under strain from 0% to 200%. (b) Scanning electron microscope images of PEDOT:PSS/nonionic WPU (2.0 wt%) on TPU film and PEDOT:PSS/nonionic WPU on PDMS after strain and release with 50 and 100% strain.
2. Alternating Current Electroluminescent (ACEL) Device
Stretchable ACEL Device Employing PEDOT:PSS/Nonionic WPU Composite Electrodes on TPU Film
The PEDOT:PSS/nonionic WPU composite electrodes on the TPU film were used in a demonstration ACEL device. A ZnS:Cu phosphor mixed with silicone rubber acted as a stretchable light-emitting layer between the two electrodes. Figure 10a shows the structure of the ACEL device manufactured using the solution process. The ACEL device exhibited excellent elastic motion without degradation of the performance, even at 500% strain (Figure 10d). The ACEL device was powered by a rectangular pulse function (pulse voltage of 300 V and frequency of 400 Hz) and showed a maximum luminance of 14.29 cd/m2 from the emission peak at 467 nm, at a voltage of 300 V (Figure 10b,c).
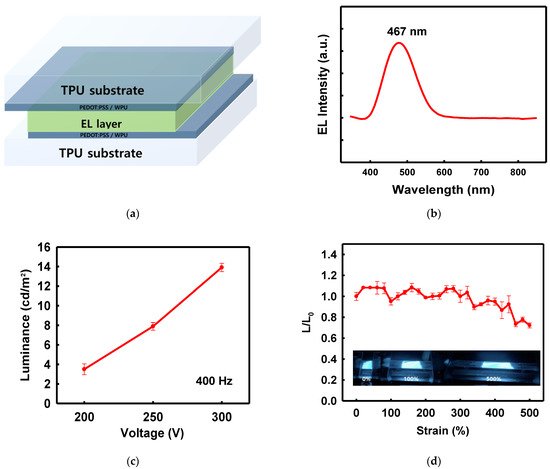
Figure 10. (a) Schematic of device structure, (b) electroluminescence spectrum of the device, centered at 467 nm, (c) luminescence according to voltage change at 400 Hz, (d) L/L0 ratio of the device under strain and photographs of the device under 0, 100, and 500% strain.
Figure 10d shows the deformation-dependent properties of the stretchable ACEL devices. The stretchable ACEL device maintained the 70% of the initial luminance at 500% stretched state, showing very stable emission performance (Figure 10d).
This entry is adapted from the peer-reviewed paper 10.3390/polym14050949
This entry is offline, you can click here to edit this entry!