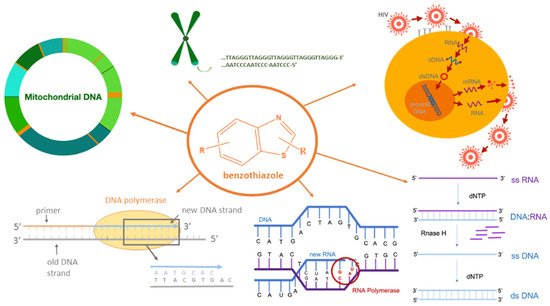
Due to the involvement of DNA:RNA hybrids and triplex helices in many essential functions in cells, this study’s main aim is to detect benzothiazole based moieties with selective binding or spectroscopic response to these nucleic structures compared
to regular (non-hybrid) DNA and RNA duplexes and single-stranded forms.
- benzothiazoles
- competition dialysis
- DNA:RNA hybrids
- ATT triplex
- RNase H
- circular dichroism spectroscopy
[1][2][3][4][5][6][7][8][9][10][11][12][13][14][15][16][17][18][19][20][21][22][23][24][25]1. Introduction
2. Characterization of Compounds in Aqueous Medium
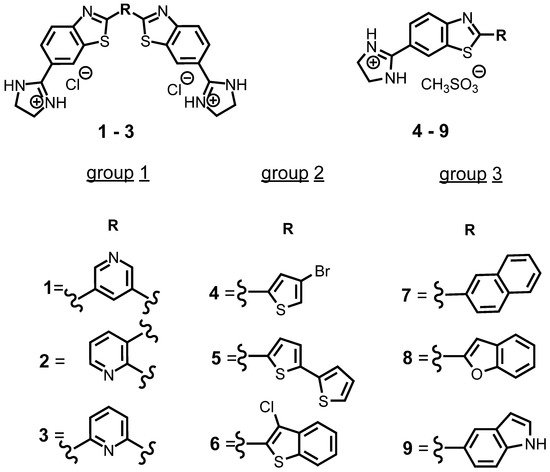
| Compd | UV/Vis λmax (nm) |
ε × 103 /mmol−1 cm2 |
Emission (nm) | Stokes Shift × 10−18 J |
Φf c |
|---|---|---|---|---|---|
| 1 | 330 | 32.1 | 379 | 4.1 | 0.06 |
| 2 | 285/320 b | 31.7/20.6 | 450 | 1.2/1.5 | 0.13 |
| 3 | 330 | 30.7 | 385 | 3.6 | 0.13 |
| 4 | 343 | 44.9 | 416 | 2.7 | 0.37 |
| 5 | 391 | 77.9 | 497 | 1.9 | 0.69 |
| 6 | 342 | 25.1 | 430 | 2.3 | 0.20 |
| 7 | 325 | 35.4 | 444 | 1.7 | 0.38 |
| 8 | 355 | 36.6 | 430 | 2.6 | 0.54 |
| 9 | 343 | 24.2 | 442 | 2.0 | 0.11 |
a Sodium cacodylate buffer, I = 0.05 mol dm−3, pH = 7.0; b in fluorescence titrations λmax was 320 nm; c Absolute fluorescence quantum yield was determined by integrating sphere SC-30, Edinburgh Inst., for argon-purged solutions; QY ± 0.5 °C. [62].
3. Study of Interactions of Benzothiazoles with Nucleic Acids in Aqueous Medium
3.1. Competition Dialysis Assay with 1–9
3.2. Fluorescence Spectroscopy and Isothermal Titration Calorimetry
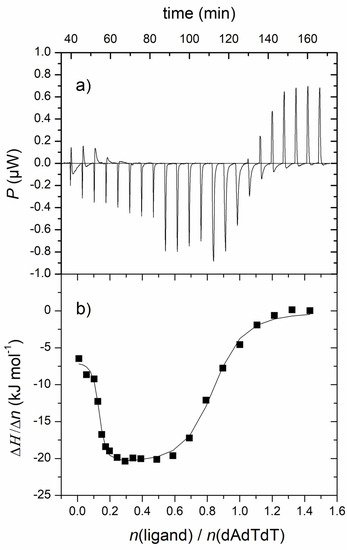
| Complex | n1/n2 | log Ks1/Ks2 | ΔrH1,2°/kJ mol−1 | TΔr1,2S°/kJ mol−1 | ΔrG1,2°/kJ mol−1 |
|---|---|---|---|---|---|
| 1-ATT | 0.7/0.1 | 6.5/8.7 | −21.1/−6.8 | 15.7/43.3 | −36.8/−50.1 |
| n | log Ks | ΔrH°/kJ mol−1 | TΔrS°/kJ mol−1 | ΔrG°/kJ mol−1 | |
| 1-rA-dT | 0.1 | 7.8 | −6.3 | 38.4 | −44.7 |
| 6-ATT b | 0.7 | 7.6 | - c | - c | - c |
| 6-dA-rU b | 0.8 | 8.0 | - c | - c | - c |
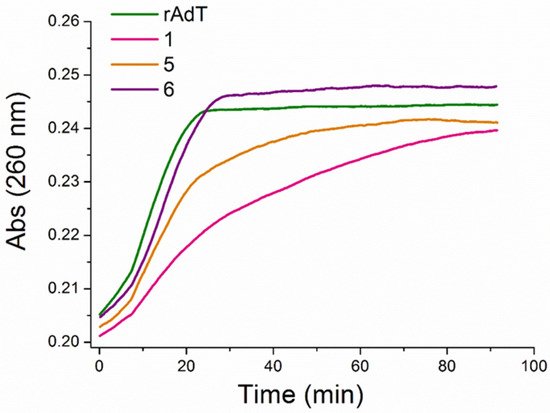
3.3. Thermal Melting Experiments and RNase H Assay
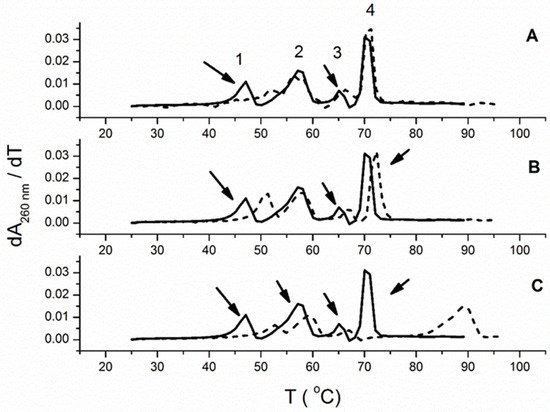
| ΔTm a | |||
|---|---|---|---|
| Polynucleotide | 1 | 5 | 6 |
| poly dA−poly rU | 5.6 | 4 | 5.5 |
| poly rA−poly rU | 2.2 | 1 | 0 |
| poly rA−poly dT | 1.7 | 1.7 | 1.5 |
| poly dA-poly dT | 19.1 | 2.1 | 0 |
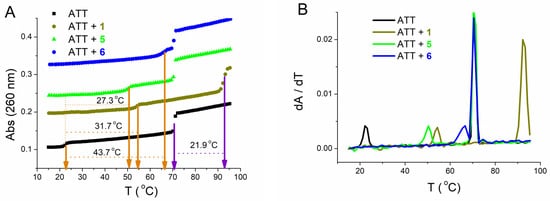
| ΔTm a | |||||||||
|---|---|---|---|---|---|---|---|---|---|
| 1 | 5 | 6 | |||||||
| cr | 0.1 | 0.2 | 0.3 | 0.1 | 0.2 | 0.3 | 0.025 | 0.05 | 0.1 |
| 31.7/21.9 | 32.5/23.9 | - | 27.3/0 | 30.1/0 | 32.8/0 | 36.7/0 | 42.0/0 | 43.7/0 | |
3.4. Circular Dichroism (CD) Experiments
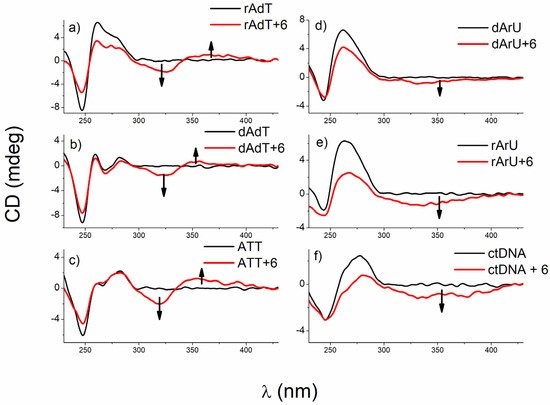
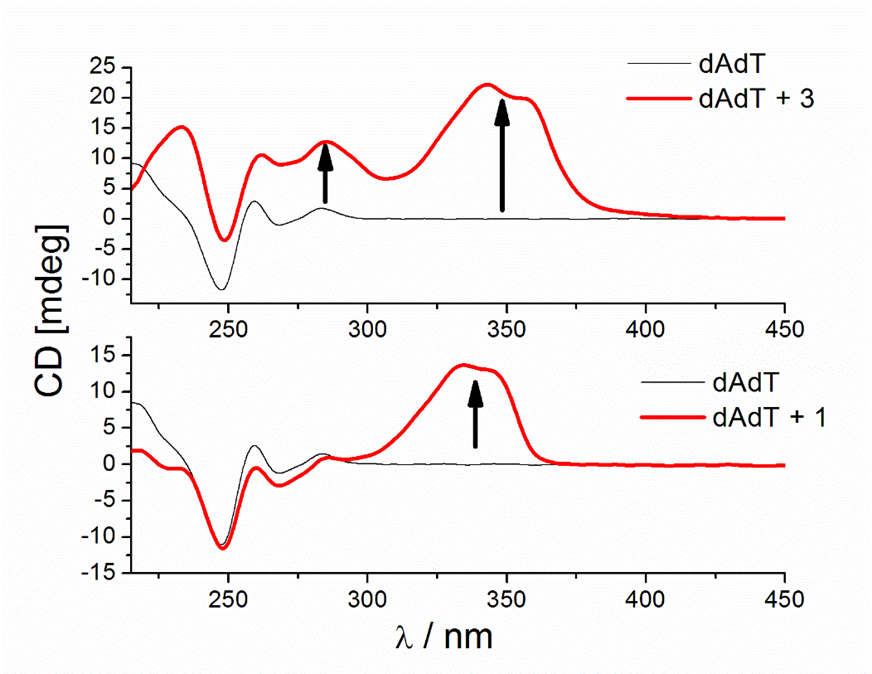
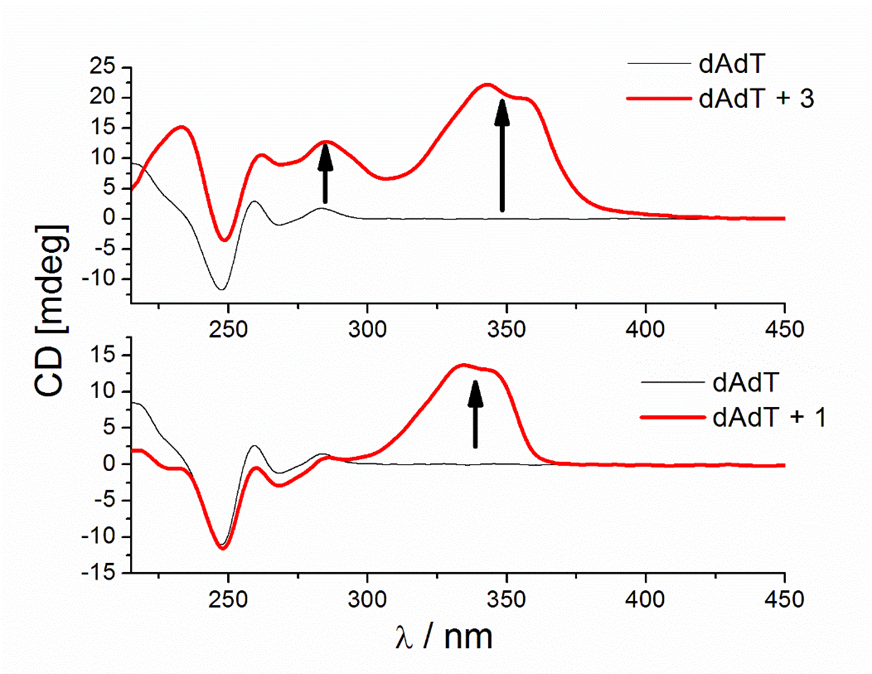


Figure 9. CD titrations of AT-DNA duplex (dAdT) (c = 3.0 × 10⁻⁵ mol dm−3) with 3 (a) and 1 (b) at molar ratios r = [compound]/[polynucleotide] = 0.4 and 0.1, respectively (pH = 7.0, buffer sodium cacodylate, I = 0.05 mol dm−3 + 1 mM EDTA).
Similar strong changes in CD spectra of polynucleotides were noticed with bis-polyaza pyridinophane derivatives that, similarly to compound 3, consist of two chains attached to pyridine as a central unit [66]. The reason that compound 3 induced condensation-like changes, while compound 1 did not, is probably the position of chains on the pyridine ring. Unlike 1, 3 and bis-polyaza pyridinophane derivatives have two chains attached at the same positions on the pyridine ring (2 and 6 positions).
3.2.5. Molecular Modeling
The binding of 6 dimers inside the minor groove of the ATT triplex was also examined by molecular modeling (Figure 10). The mode of binding of 6 with the ATT triple structure suggested by the spectroscopic methods was consistent with the results obtained by molecular modeling.
- Conclusions
The search for small molecules with selective binding to specific sites in DNA or RNA structures is still of intense interest. Such binding can block or interfere with important processes, e.g., transcription, recombination, and DNA repair.
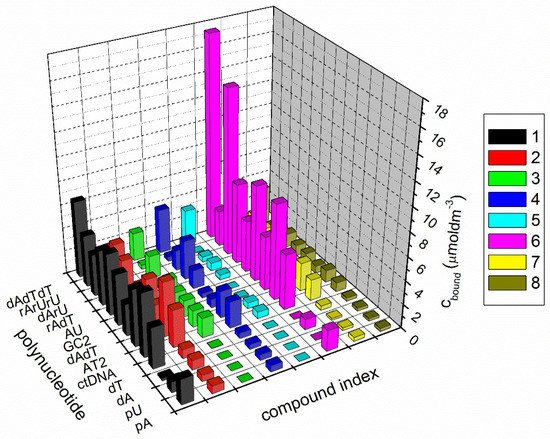
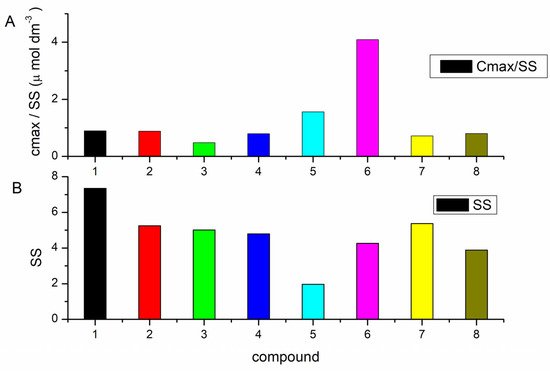
Competition dialysis assay [27,71,72] allows the straightforward evaluation of sequence and structural selectivity of different DNA and RNA binding ligands. In this study it enabled the detection of three benzothiazole compounds, (1, 5, and 6), with preferential binding to DNA:RNA hybrids and ATT triplex in regard to regular (non-hybrid) DNA and RNA duplexes and single-stranded forms. Compound 6 preferentially stabilized dArU hybrid among other ds-polynucleotides. RNase H assay confirmed the results of thermal melting experiment (Table 3) and identified ligand 1 as a potential RNase H inhibitor for the digestion of poly rA-poly dT. While all three compounds demonstrated a strong stabilization effect of ATT triplex, only compound 6, in both thermal melting experiments (Tables 3 and 4), demonstrated selective binding to ATT triplex in regard to AT duplex. Such stabilization could be exploited to inhibit the gene expression involved in cancer, for interference with DNA replication or inducing transcriptional repression, site-specific mutations, and recombination [11].
To the best of our knowledge, among small molecules previously reported [73–77], 6 with the chlorobenzothiophene substituent has the largest stabilization effect on ATT triplex (DTm = 44 at r = 0.1). In addition, 5 (with bithiophene substituent) and, especially, 6 selective stabilization of triplex in the form of dimer inside the minor groove, has not been reported yet. The mode of binding of 6 (inside the ATT minor groove in the form of dimer) was confirmed by CD spectroscopy and molecular modeling. These results were made with long polynucleotides (≥500 base pairs) that can provide a large excess of binding sites along the DNA helical structure and ease the determination of binding modes. To see if the same selectivity of molecule 6 toward ATT base triplets exists in shorter sequences, we performed measurements with the 26-nucleotide-long ATT triplex, possessing the same conformation (B-DNA, Figure 10) as its longer form. The fluorescence and CD experiments performed with 26 mer revealed high affinity and the same ICD profile as with longer sequences, confirming that the pattern of recognition is present regardless of nucleotide chain length.
As the AT-rich repeated sequences are often found in the sites for DNA replication initiation in bacterial, archaeal, and eukaryotic replicons, it would be interesting to confirm identified selectivity with a more distinct AT-rich oligomer sequence, for example, the GATCTATTTATTT of replication origin in E. coli [78]. However, this will be investigated in another study, after careful selection of the oligomers. Compound 6 could differentiate between B- and A-type helices by the mode of binding. While an appearance of negative ICD signals supported intercalation to A-type helices, poly dA-poly rU, and poly rA-poly rU, bisignate CD signal implied the binding of 6 in the form of dimers inside the minor groove of poly rA-poly dT, poly dA-poly dT, and ATT triplex.
In contrast to its regioisomer 1, ligand 3 induced a strong increase in CD intensity of AT-rich sequences (ctDNA at 275 nm, AT-DNA at 260 and 282 nm, and ATT at 282 nm) and strong positive ICD bands around 350 nm (SI). Similar condensation-like changes of the nucleic acid structure could be utilized in pharmaceutics for DNA delivery by viral or non-viral vectors in gene therapy [79–81]. Furthermore, DNA condensation can be applied in the construction of biosensors based on the liquid-crystalline properties of condensed DNA [82]. This result, as well as the identification of ligand 1 as a potential RNase H inhibitor, will be investigated in more detail and will be published elsewhere.
This entry is adapted from the peer-reviewed paper 10.3390/biom12030374
References
- Egli, M.; Saenger, W. Principles of Nucleic Acid Structure; Springer: Berlin/Heidelberg, Germany, 1983.
- Cantor, C.R.; Schimmel, P.R. Biophysical Chemistry; W.H. Freeman: San Francisco, CA, USA, 1980.
- Neidle, S. Oxford Handbook of Nucleic Acid Structure; Oxford University Press: Oxford, UK, 1999.
- Fedoroff, O.Y.; Salazar, M.; Reid, B.R. Structure of a DNA: RNA Hybrid Duplex: Why RNase H Does Not Cleave Pure RNA. J. Mol. Biol. 1993, 233, 509–523. https://doi.org/10.1006/jmbi.1993.1528.
- Radhakrishnan, I.; Patel, D.J. Solution structure of a pyrimidine·purine·pyrimidine DNA triplex containing T·AT, C+ GC and G·TA triples. Structure 1994, 2, 17–32.
- Raghunathan, G.; Miles, H.T.; Sasisekharan, V. Symmetry and molecular structure of a DNA triple helix: D(T)n.cntdot.d(A)n.cntdot.d(T)n. Biochemistry 1993, 32, 455–462. https://doi.org/10.1021/bi00053a009.
- Esguerra, M.; Nilsson, L.; Villa, A. Triple helical DNA in a duplex context and base pair opening. Nucleic Acids Res. 2014, 42, 11329–11338. https://doi.org/10.1093/nar/gku848.
- Šmidlehner, T.; Piantanida, I.; Pescitelli, G. Polarization spectroscopy methods in the determination of interactions of small molecules with nucleic acids—Tutorial. Beilstein J. Org. Chem. 2018, 14, 84–105. https://doi.org/10.3762/bjoc.14.5.
- Stojković, M.R.; González-García, J.; Šupljika, F.; Galiana-Roselló, C.; Guijarro, L.; Gazzè, S.A.; Francis, L.W.; Piantanida, I.; García-España, E. Specific and highly efficient condensation of GC and IC DNA by polyaza pyridinophane derivatives. Int. J. Biol. Macromol. 2017, 109, 143–151. https://doi.org/10.1016/j.ijbiomac.2017.11.156.
- Wang, J.; Wang, W.; Kollman, P.A.; Case, D.A. Automatic atom type and bond type perception in molecular mechanical calculations. J. Mol. Graph. Model. 2006, 25, 247–260. https://doi.org/10.1016/j.jmgm.2005.12.005.
- Case, D.; Betz, R.; Cerutti, D.S.; Cheatham, T.; Darden, T.; Duke, R.; Giese, T.J.; Gohlke, H.; Götz, A.; Homeyer, N.; et al. Amber 16; University of California: San Francisco, CA, USA, 2016.
- Zgarbová, M.; Šponer, J.; Otyepka, M.; Cheatham, I.T.E.; Galindo-Murillo, R.; Jurečka, P. Refinement of the Sugar–Phosphate Backbone Torsion Beta for AMBER Force Fields Improves the Description of Z- and B-DNA. J. Chem. Theory Comput. 2015, 11, 5723–5736. https://doi.org/10.1021/acs.jctc.5b00716.
- Wang, J.; Wolf, R.M.; Caldwell, J.W.; Kollman, P.A.; Case, D.A. Development and testing of a general amber force field. J. Comput. Chem. 2004, 25, 1157–1174. https://doi.org/10.1002/jcc.20035.
- Gmeiner, W.H.; Cui, W.; Sharma, S.; Soto, A.M.; Marky, L.A.; Lown, J.W. Shape-Selective Binding of Geometrical-ly-Constrained bis-Distamycins to a DNA Duplex and a Model Okazaki Fragment of Identical Sequence. Nucleosides Nucleotides Nucleic Acids 2000, 19, 1365–1379.
- Ren, J.; Chaires, J.B. Sequence and Structural Selectivity of Nucleic Acid Binding Ligands. Biochemistry 1999, 38, 16067–16075. https://doi.org/10.1021/bi992070s.
- Yamayoshi, A.; Miyoshi, D.; Zouzumi, Y.-K.; Matsuyama, Y.; Ariyoshi, J.; Shimada, N.; Murakami, A.; Wada, T.; Maruyama, A. Selective and Robust Stabilization of Triplex DNA Structures Using Cationic Comb-type Copolymers. J. Phys. Chem. B 2017, 121, 4015–4022. https://doi.org/10.1021/acs.jpcb.7b01926.
- Kan, Y.; Armitage, B.; Schuster, G.B. Selective Stabilization of Triplex DNA by Anthraquinone Sulfonamide Derivatives. Biochemistry 1997, 36, 1461–1466. https://doi.org/10.1021/bi962335s.
- Ren, J.; Chaires, J.B. Preferential Binding of 3,3‘-Diethyloxadicarbocyanine to Triplex DNA. J. Am. Chem. Soc. 1999, 122, 424–425. https://doi.org/10.1021/ja9934955.
- Tam, V.K.; Liu, Q.; Tor, Y. Extended ethidium bromide analogue as a triple helix intercalator: Synthesis, photophysical properties and nucleic acids binding. Chem. Commun. 2006, 25, 2684–2686.
- Latimer, L.J.P.; Payton, N.; Forsyth, G.; Lee, J.S. The binding of analogues of coralyne and related heterocyclics to DNA tri-plexes. Biochem. Cell Biol. 1995, 73, 11–18. https://doi.org/10.1139/o95-002.
- Rajewska, M.; Wegrzyn, K.; Konieczny, I. AT-rich region and repeated sequences—The essential elements of replication origins of bacterial replicons. FEMS Microbiol. Rev. 2012, 36, 408–434. https://doi.org/10.1111/j.1574-6976.2011.00300.x.
- Vijayanathan, V.; Thomas, T. DNA Nanoparticles and Development of DNA Delivery Vehicles for Gene Therapy. Biochemistry 2002, 41, 14085–14094. https://doi.org/10.1021/bi0203987.
- Kotterman, M.A.; Schaffer, D.V. Engineering adeno-associated viruses for clinical gene therapy. Nat. Rev. Genet. 2014, 15, 445–451. https://doi.org/10.1038/nrg3742.
- Lee, A.; Karcz, A.P.; Akman, R.; Zheng, T.; Kwon, S.; Chou, S.-T.; Sucayan, S.; Tricoli, L.J.; Hustedt, J.M.; Leng, Q.; et al. Direct observation of dynamic mechanical regulation of DNA condensation by environmental stimuli. Angew. Chem. Int. Ed. 2014, 53, 10631–10635. https://doi.org/10.1002/anie.201403499.
- Yevdokimov, Y.M. Double-stranded DNA liquid-crystalline dispersions as biosensing units. Biochem. Soc. Trans. 2000, 28, 77–81. https://doi.org/10.1042/bst0280077.
- Hurley, L.H. DNA and its associated processes as targets for cancer therapy. Nat. Cancer 2002, 2, 188–200.
- Demeunynck, M.; Bailly, C.; Wilson, W.D. Small Molecule DNA and RNA Binders: From Synthesis to Nucleic Acid Complexes; Demeunynck, M., Bailly, C., Wilson, W.D., Eds.; Wiley-VCH: Weinheim, Germany, 2003.
- Escudé, C.; Nguyen, C.H.; Kukreti, S.; Janin, Y.; Sun, J.-S.; Bisagni, E.; Garestier, T.; Hélène, C. Rational design of a triple helix-specific intercalating ligand. Proc. Natl. Acad. Sci. USA 1998, 95, 3591–3596.
- Arya, D.P. New Approaches Toward Recognition of Nucleic Acid Triple Helices. Acc. Chem. Res. 2011, 44, 134–146.
- Nguyen, T.Q.N.; Lim, K.W.; Phan, A.T. A Dual-Specific Targeting Approach Based on the Simultaneous Recognition of Duplex and Quadruplex Motifs. Sci. Rep. 2017, 7, 11969.
- Le, D.D.; Di Antonio, M.; Chan, L.K.M.; Balasubramanian, S. G-quadruplex ligands exhibit differential G-tetrad selectivity. Chem. Commun. 2015, 51, 8048–8050.
- Ranjan, N.; Davis, E.; Xue, L.; Arya, D.P. Dual recognition of the human telomeric G-quadruplex by a neomycin–anthraquinone conjugate. Chem. Commun. 2013, 49, 5796–5798.
- Van Dyke, M.W.; Ohyama, T. Do DNA Triple Helices or Quadruplexes Have a Role in Transcription? In DNA Conformation and Transcription; Springer Science and Business Media LLC: Berlin/Heidelberg, Germany, 2005; pp. 105–126.
- Nadal, A.; Eritja, R.; Esteve, T.; Pla, M. “Parallel” and “antiparallel tail-clamps” increase the efficiency of triplex formation with structured DNA and RNA targets. ChemBioChem 2005, 6, 1034–1042.
- Wang, G.; Seidman, M.M.; Glazer, P.M. Mutagenesis in Mammalian Cells Induced by Triple Helix Formation and Transcription-Coupled Repair. Science 1996, 271, 802–805.
- Jain, A.; Wang, G.; Vasquez, K.M. DNA triple helices: Biological consequences and therapeutic potential. Biochimie 2008, 90, 1117–1130.
- Xi, H.; Kumar, S.; Dosen-Micovic, L.; Arya, D.P. Calorimetric and spectroscopic studies of aminoglycoside binding to AT-rich DNA triple helices. Biochimie 2010, 92, 514–529.
- Sharma, S.K.; Frase, W. Selectivity of a bromoacridine containing fuorophore for triplex DNA. Mon. Chem. 2021, 152, 1013–1016.
- Xue, L.; Xi, H.; Kumar, S.; Gray, D.; Davis, E.; Hamilton, P.; Skriba, M.; Arya, D.P. Probing the Recognition Surface of a DNA Triplex: Binding Studies with Intercalator−Neomycin Conjugates. Biochemistry 2010, 49, 5540–5552.
- Mergny, J.L.; Duval-Valentin, G.; Nguyen, C.H.; Perrouault, L.; Faucon, B.; Rougée, M.; Montenay-Garestier, T.; Bisagni, E.; Hélène, C. Triple Helix-Specific Ligands. Science 1992, 256, 1681–1684.
- Houlard, M.; Artus, J.; Leguillier, T.; Vandormael-Pournin, S.; Cohen-Tannoudji, M. DNA-RNA hybrids contribute to the replication dependent genomic instability induced byOmcg1deficiency. Cell Cycle 2011, 10, 108–117.
- Balk, B.; Dees, M.; Bender, K.; Luke, B. The differential processing of telomeres in response to increased telomeric transcription and RNA–DNA hybrid accumulation. RNA Biol. 2014, 11, 95–100.
- Stuckey, R.; García-Rodríguez, N.; Aguilera, A.; Wellinger, R.E. Role for RNA:DNA hybrids in origin-independent replication priming in a eukaryotic system. Proc. Natl. Acad. Sci. USA 2015, 112, 5779–5784.
- Balk, B.; Maicher, A.; Dees, M.; Klermund, J.; Luke-Glaser, S.; Bender, K.; Luke, B. Telomeric RNA-DNA hybrids affect telomere-length dynamics and senescence. Nat. Struct. Mol. Biol. 2013, 20, 1199–1205.
- Li, T.-K.; Barbieri, C.M.; Lin, H.-C.; Rabson, A.B.; Yang, G.; Fan, Y.; Gaffney, B.L.; Jones, R.A.; Pilch, D.S. Drug Targeting of HIV-1 RNA·DNA Hybrid Structures: Thermodynamics of Recognition and Impact on Reverse Transcriptase-Mediated Ribonuclease H Activity and Viral Replication. Biochemistry 2004, 43, 9732–9742.
- Lombraña, R.; Almeida, R.; Alvarez, A.; Gómez, M. R-loops and initiation of DNA replication in human cells: A missing link? Front. Genet. 2015, 6, 158.
- Saretzki, G. Telomerase inhibition as cancer therapy. Cancer Lett. 2003, 194, 209–219.
- Mergny, J.-L.; Lacroix, L.; Teulade-Fichou, M.-P.; Hounsou, C.; Guittat, L.; Hoarau, M.; Arimondo, P.B.; Vigneron, J.-P.; Lehn, J.-M.; Riou, J.-F.; et al. Telomerase inhibitors based on quadruplex ligands selected by a fluorescence assay. Proc. Natl. Acad. Sci. USA 2001, 98, 3062–3067.
- Su, H.-P.; Yan, Y.; Prasad, G.S.; Smith, R.F.; Daniels, C.L.; Abeywickrema, P.D.; Reid, J.C.; Loughran, H.M.; Kornienko, M.; Sharma, S.; et al. Structural Basis for the Inhibition of RNase H Activity of HIV-1 Reverse Transcriptase by RNase H Active Site-Directed Inhibitors. J. Virol. 2010, 84, 7625–7633.
- Tramontano, E.; Di Santo, R. HIV-1 RT-associated RNase H function inhibitors: Recent advances in drug development. Curr. Med. Chem. 2010, 17, 2837–2853.
- Ren, J.; Qu, X.; Dattagupta, N.; Chaires, J. Molecular Recognition of a RNA:DNA Hybrid Structure. J. Am. Chem. Soc. 2001, 123, 6742–6743.
- Shaw, N.N.; Arya, D.P. Recognition of the unique structure of DNA:RNA hybrids. Biochimie 2008, 90, 1026–1039.
- West, C.; Francis, R.; Friedman, S.H. Small molecule/Nucleic acid affinity chromatography: Application for the identification of telomerase inhibitors which target its key RNA/DNA heteroduplex. Bioorganic Med. Chem. Lett. 2001, 11, 2727–2730.
- Wheelhouse, R.T.; Chaires, J.B. Drug binding to DNA x RNA hybrid structures. Methods Mol. Biol. 2010, 613, 55–70.
- Shi, X.; Chaires, J.B. Sequence- and structural-selective nucleic acid binding revealed by the melting of mixtures. Nucleic Acids Res. 2006, 34, e14.
- Shaw, N.N.; Xi, H.; Arya, D.P. Molecular recognition of a DNA:RNA hybrid: Sub-nanomolar binding by a neomycin–methidium conjugate. Bioorganic Med. Chem. Lett. 2008, 18, 4142–4145.
- Xi, H.; Davis, E.; Ranjan, N.; Xue, L.; Hyde-Volpe, D.; Arya, D.P. Thermodynamics of Nucleic Acid “Shape Readout” by an Aminosugar. Biochemistry 2011, 50, 9088–9113.
- Wheelhouse, R.T.; Garbett, N.C.; Buurma, N.J.; Chaires, J. Probing the Molecular Recognition of a DNA⋅RNA Hybrid Duplex. Angew. Chem. Int. Ed. 2010, 49, 3207–3210.
- Racané, L.; Kraljević Pavelić, S.; Ratkaj, I.; Stepanić, V.; Pavelić, K.; Tralić-Kulenović, V.; Karminski-Zamola, G. Synthesis and antiproliferative evaluation of some new amidino-substituted bis-benzothiazolyl-pyridines and pyrazine. Eur. J. Med. Chem. 2012, 55, 108–116.
- Racané, L.; Sedić, M.; Ilić, N.; Aleksić, M.; Pavelić, S.K.; Karminski-Zamola, G. Novel 2-Thienyl- and 2-Benzothienyl-Substituted 6-(2-Imidazolinyl)Benzothiazoles: Synthesis; in vitro Evaluation of Antitumor Effects and Assessment of Mitochondrial Toxicity. Anti-Cancer Agents Med. Chem. 2017, 17, 57–66.
- Racané, L.; Ptiček, L.; Sedić, M.; Grbčić, P.; Pavelić, S.K.; Bertosa, B.; Sović, I.; Karminski-Zamola, G. Eco-friendly synthesis, in vitro anti-proliferative evaluation, and 3D-QSAR analysis of a novel series of monocationic 2-aryl/heteroaryl-substituted 6-(2-imidazolinyl)benzothiazole mesylates. Mol. Divers. 2018, 22, 723–741.
- Košćak, M.; Krošl, I.; Žinić, B.; Piantanida, I. Fluorescent Analogues of FRH Peptide: Cu(II) Binding and Interactions with ds-DNA/RNA. Chemosensors 2022, 10, 34.
- Ragazzon, P.; Chaires, J.B. Use of competition dialysis in the discovery of G-quadruplex selective ligands. Methods 2007, 43, 313–323.
- Bronowska, A.K. Thermodynamics of Ligand-Protein Interactions: Implications for Molecular Design. In Thermodynamics—Interaction Studies—Solids, Liquids and Gases; IntechOpen: London, UK, 2011.
- Perozzo, R.; Folkers, G.; Scapozza, L. Thermodynamics of Protein–Ligand Interactions: History, Presence, and Future Aspects. J. Recept. Signal Transduct. 2004, 24, 1–52.
- Scatchard, G. The Attractions of Proteins for Small Molecules and Ions. Ann. N. Y. Acad. Sci. 1949, 51, 660–672.
- McGhee, J.D.; von Hippel, P.H. Theoretical aspects of DNA-protein interactions: Co-operative and non-co-operative binding of large ligands to a one-dimensional homogeneous lattice. J. Mol. Biol. 1974, 86, 469–489.
- Chaires, J.B. A thermodynamic signature for drug–DNA binding mode. Arch. Biochem. Biophys. 2006, 453, 26–31.
- Mergny, J.-L.; Lacroix, L. Analysis of Thermal Melting Curves. Oligonucleotides 2003, 13, 515–537.
- Lesnik, E.A.; Freier, S.M. Relative Thermodynamic Stability of DNA, RNA, and DNA:RNA Hybrid Duplexes: Relationship with Base Composition and Structure. Biochemistry 1995, 34, 10807–10815.
- Choi, B.-H.; Yeo, G.; Jung, J.; Lee, B.W.; Han, S.; Cho, T. A Thermodynamic Investigation into the Stabilization of Poly(dA)· 2 Triple Helical DNA by Various Divalent Metal Ions. Bull. Korean Chem. Soc. 2009, 30, 2691–2696.
- Arya, D.P.; Coffee, R.L.; Willis, B.; Abramovitch, A.I. Aminoglycoside−Nucleic Acid Interactions: Remarkable Stabilization of DNA and RNA Triple Helices by Neomycin. J. Am. Chem. Soc. 2001, 123, 5385–5395.
- Berova, N.; Nakanishi, K.; Woody, R. Circular Dichroism Principles and Applications, 2nd ed.; Wiley-VCH: New York, NY, USA, 2000.
- Eriksson, M.; Nordén, B. Linear and circular dichroism of drug-nucleic acid complexes. In Methods in Enzymology; Elsevier BV: Amsterdam, The Netherlands, 2001; Volume 340, pp. 68–98.
- Egli, M.; Saenger, W. Principles of Nucleic Acid Structure; Springer: Berlin/Heidelberg, Germany, 1983.
- Cantor, C.R.; Schimmel, P.R. Biophysical Chemistry; W.H. Freeman: San Francisco, CA, USA, 1980.
- Neidle, S. Oxford Handbook of Nucleic Acid Structure; Oxford University Press: Oxford, UK, 1999.
- Fedoroff, O.Y.; Salazar, M.; Reid, B.R. Structure of a DNA: RNA Hybrid Duplex: Why RNase H Does Not Cleave Pure RNA. J. Mol. Biol. 1993, 233, 509–523.
- Radhakrishnan, I.; Patel, D.J. Solution structure of a pyrimidine·purine·pyrimidine DNA triplex containing T·AT, C+ GC and G·TA triples. Structure 1994, 2, 17–32.
- Raghunathan, G.; Miles, H.T.; Sasisekharan, V. Symmetry and molecular structure of a DNA triple helix: D(T)n.cntdot.d(A)n.cntdot.d(T)n. Biochemistry 1993, 32, 455–462.
- Esguerra, M.; Nilsson, L.; Villa, A. Triple helical DNA in a duplex context and base pair opening. Nucleic Acids Res. 2014, 42, 11329–11338.
- Šmidlehner, T.; Piantanida, I.; Pescitelli, G. Polarization spectroscopy methods in the determination of interactions of small molecules with nucleic acids—Tutorial. Beilstein J. Org. Chem. 2018, 14, 84–105.

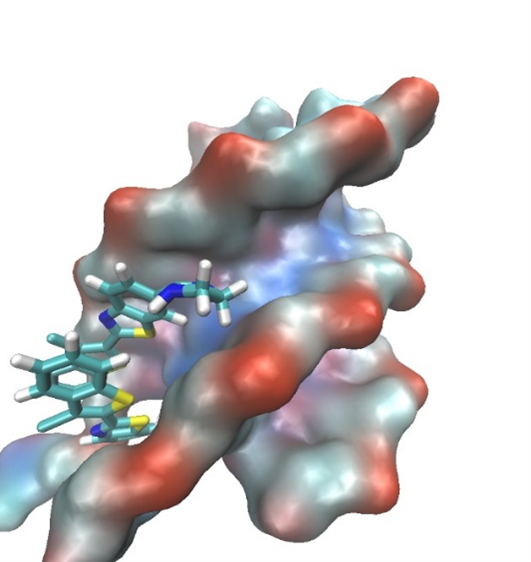
![Figure 10. A complex between ATT (DNA triplex) and dimer of 6 obtained after 200 ns of MD simulation in water. ATT is represented by its solvent accessible surface and ligand is given in stick representation. (complexes were built in PyMOL, wherein the initial position of ligands was de-termined from spectroscopic data. Parametrization was performed by ANTECHAMBER [67] and Leap, the modules available within AMBER16 suite of programs [68,69] using GAFF [70] for the ligands and (a) bsc1 [41] and (b) OL15 [69] for ATT. Neutralized and solvated complexes were minimized, equilibrated, and simulated for 200 ns using the programs sander and pmemd.](/media/item_content/202203/figure10a-6229cf3c08d89.tiff)