Your browser does not fully support modern features. Please upgrade for a smoother experience.
Please note this is an old version of this entry, which may differ significantly from the current revision.
Subjects:
Agriculture, Dairy & Animal Science
The role of hexanal in flavor as an indicator of the degree of oxidation of meat products is undeniable. However, the genes and pathways of hexanal formation have not been characterized in detail.
- hexanal
- RNA-seq
- yellow-feathered broiler
- WGCNA
- SLC27A1
1. Introduction
Volatile organic compounds (VOCs) are the key constituents of meat aroma and flavor and advance the cognition of meat quality [1]. Therefore, it is important to study the changes of VOCs in meat to understand the flavor formation pathway. Hexanal, the main aroma active compound in aromatic rice milk [2] and pea milk [3], was found to be strongly correlated with lipid oxidation [4] and its relative content was increased with the storage time of the samples [5]. Chicory-fed lambs had higher hexanal content and better flavor than ryegrass-fed lambs [6]. The previous analysis of the volatiles detected in the breast muscle of nearly 1000 different breeds of yellow-feathered broiler chickens revealed that hexanal is also the major volatile substance in chicken meat [7]. Therefore, further study of hexanal content in chicken is necessary.
2. Identification of Relevant Modules Associated with Hexanal
The mean value of the 398 samples of hexanal relevant content was 28.14 ± 8.96%. In most samples, the relative content of hexanal ranged from 25–35% (Figure 1A). Researchers then analyzed 15,093 genes to identify the related genes by WGCNA. Based on the sample clustering information, the relationship between phenotypic values and gene expression in the remaining samples after eliminating the six outliers are shown in Figure 1B. After determining a soft threshold at r2 > 0.85 (Figure 1D), 400 genes were randomly selected to show the expression patterns of genes within different modules (Figure 1C). In addition, the results showed the relationship between certain genes and hexanal content (Figure 2).
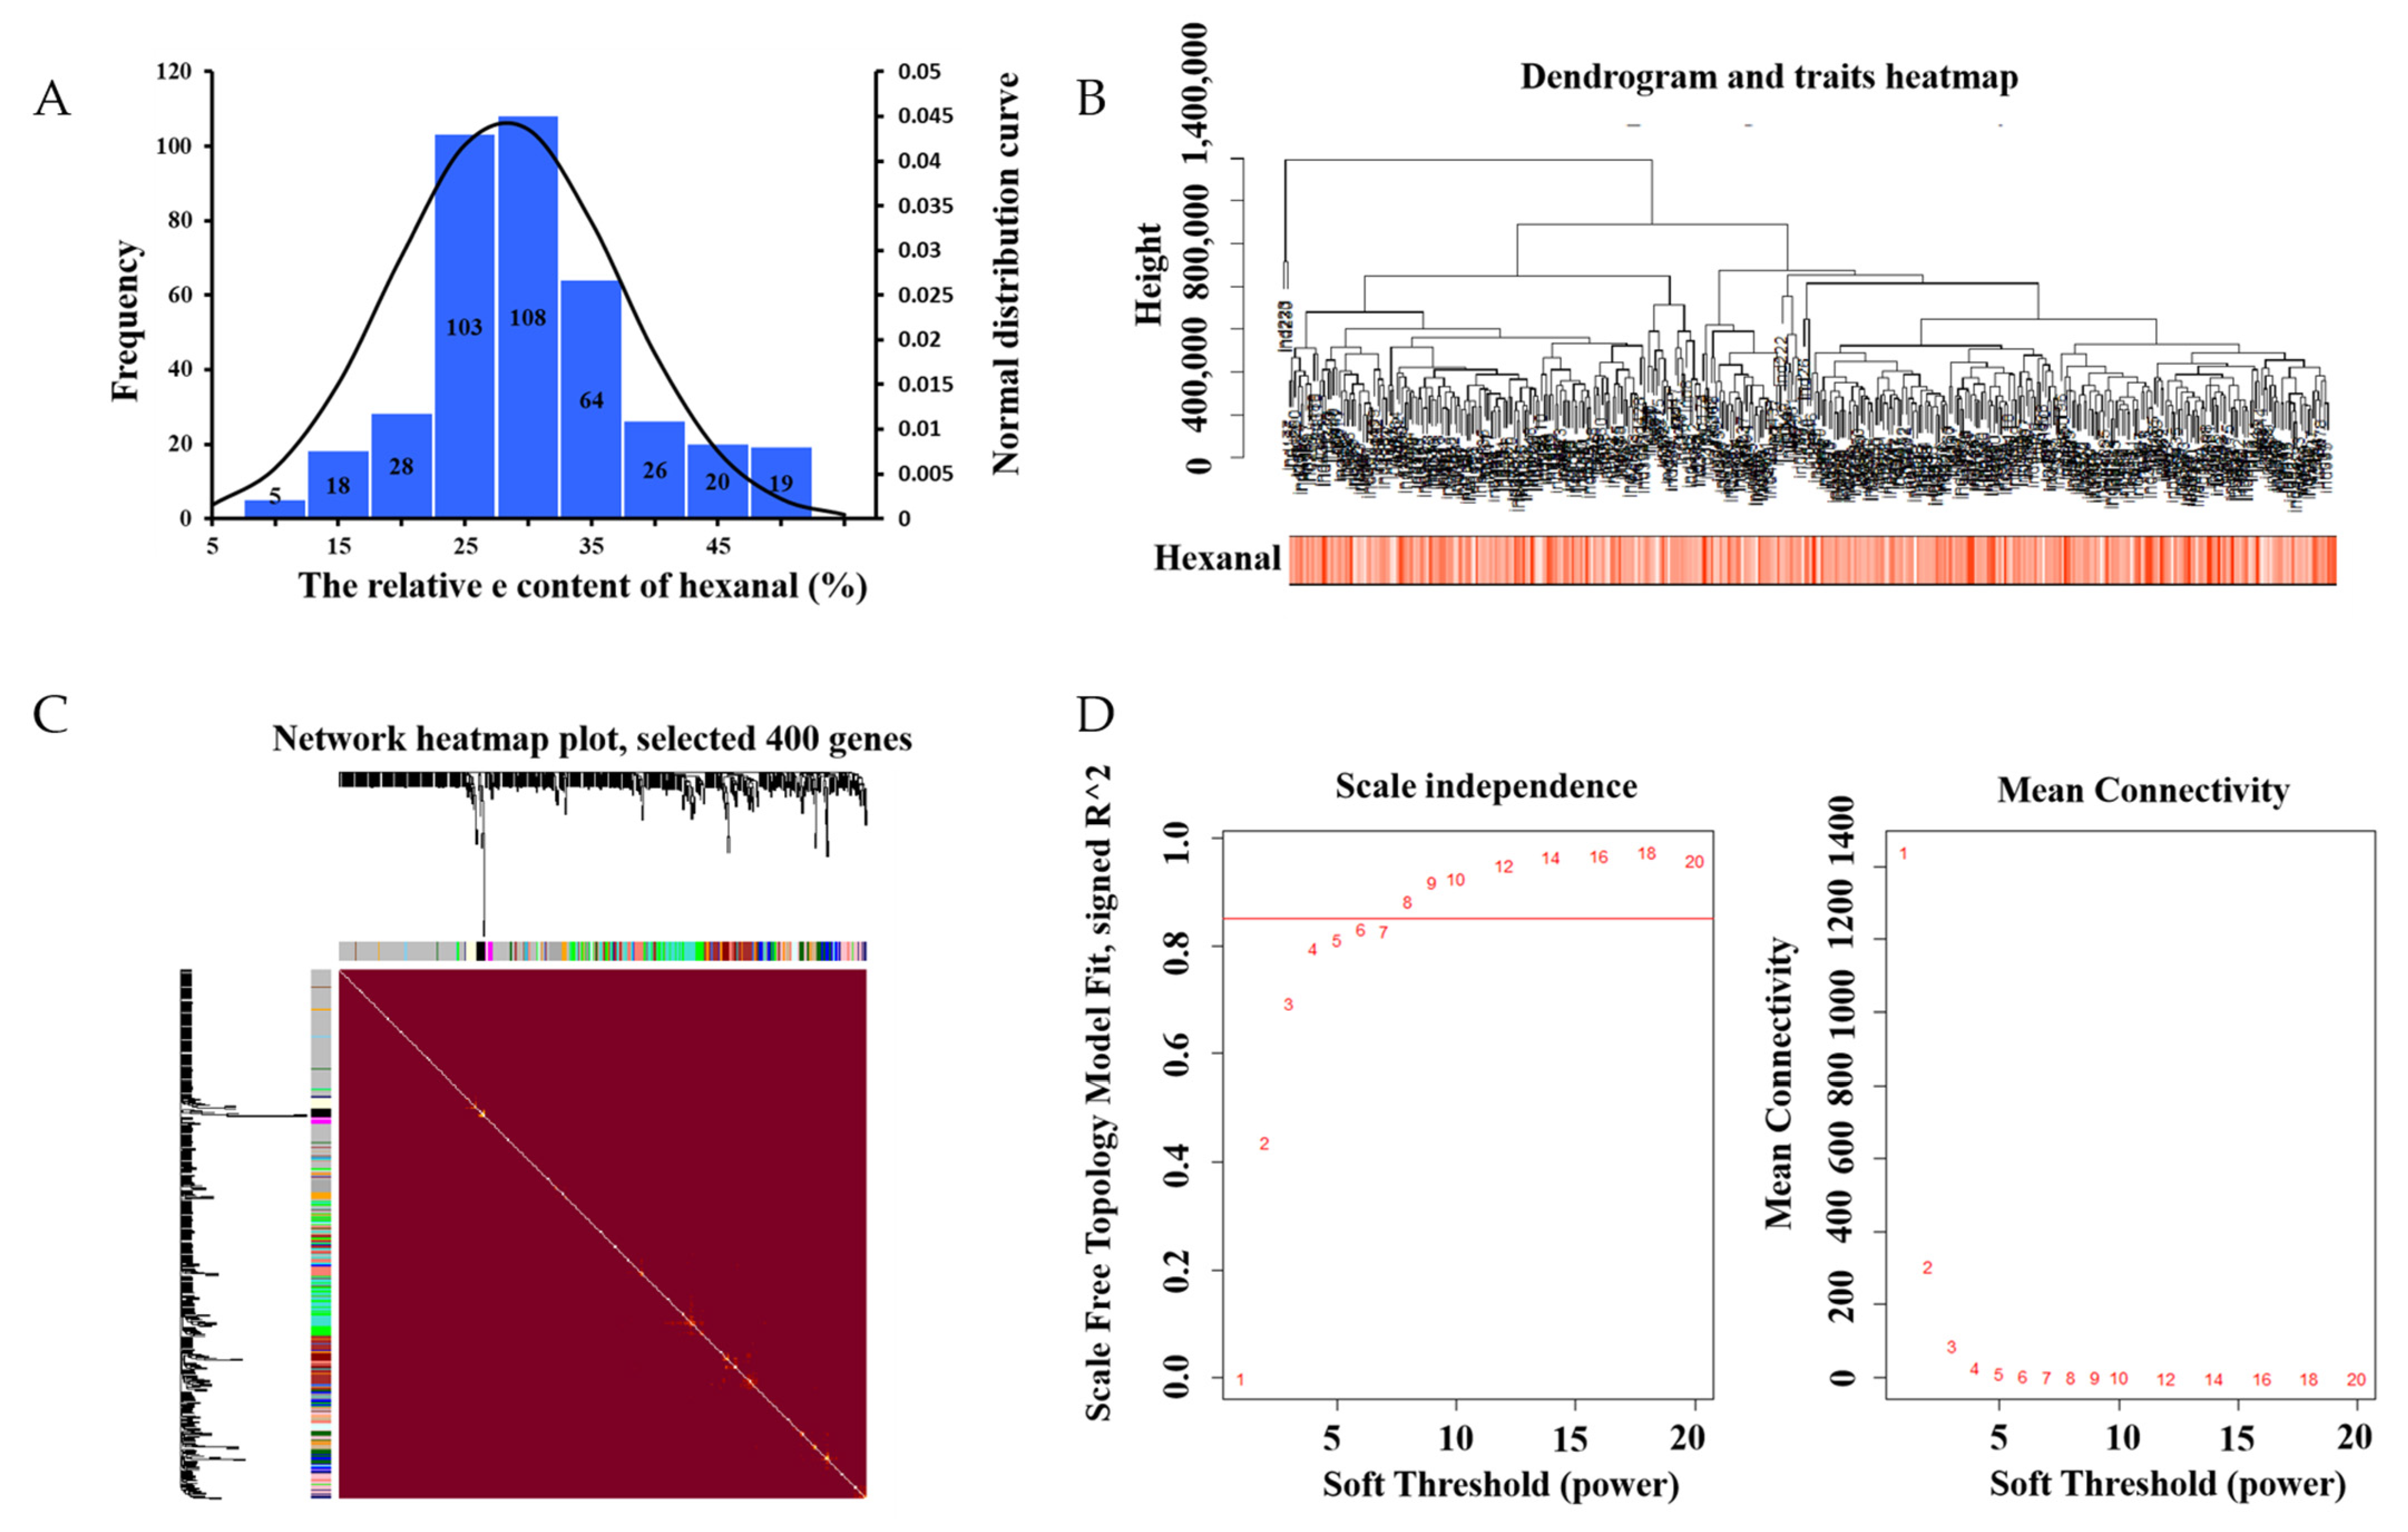
Figure 1. (A) Phenotypic distribution of 398 samples. Histogram of the frequency distribution of hexanal (%). The black line represents the normal distribution curve. (B) Dendrogram and traits heatmap. (C) Clustering dendrograms of genes, with dissimilarity based on topological overlap, together with the assigned module colors. Genes that could not be clustered into one of the two modules are labeled in gray. (D) Scale independence and mean connectivity.
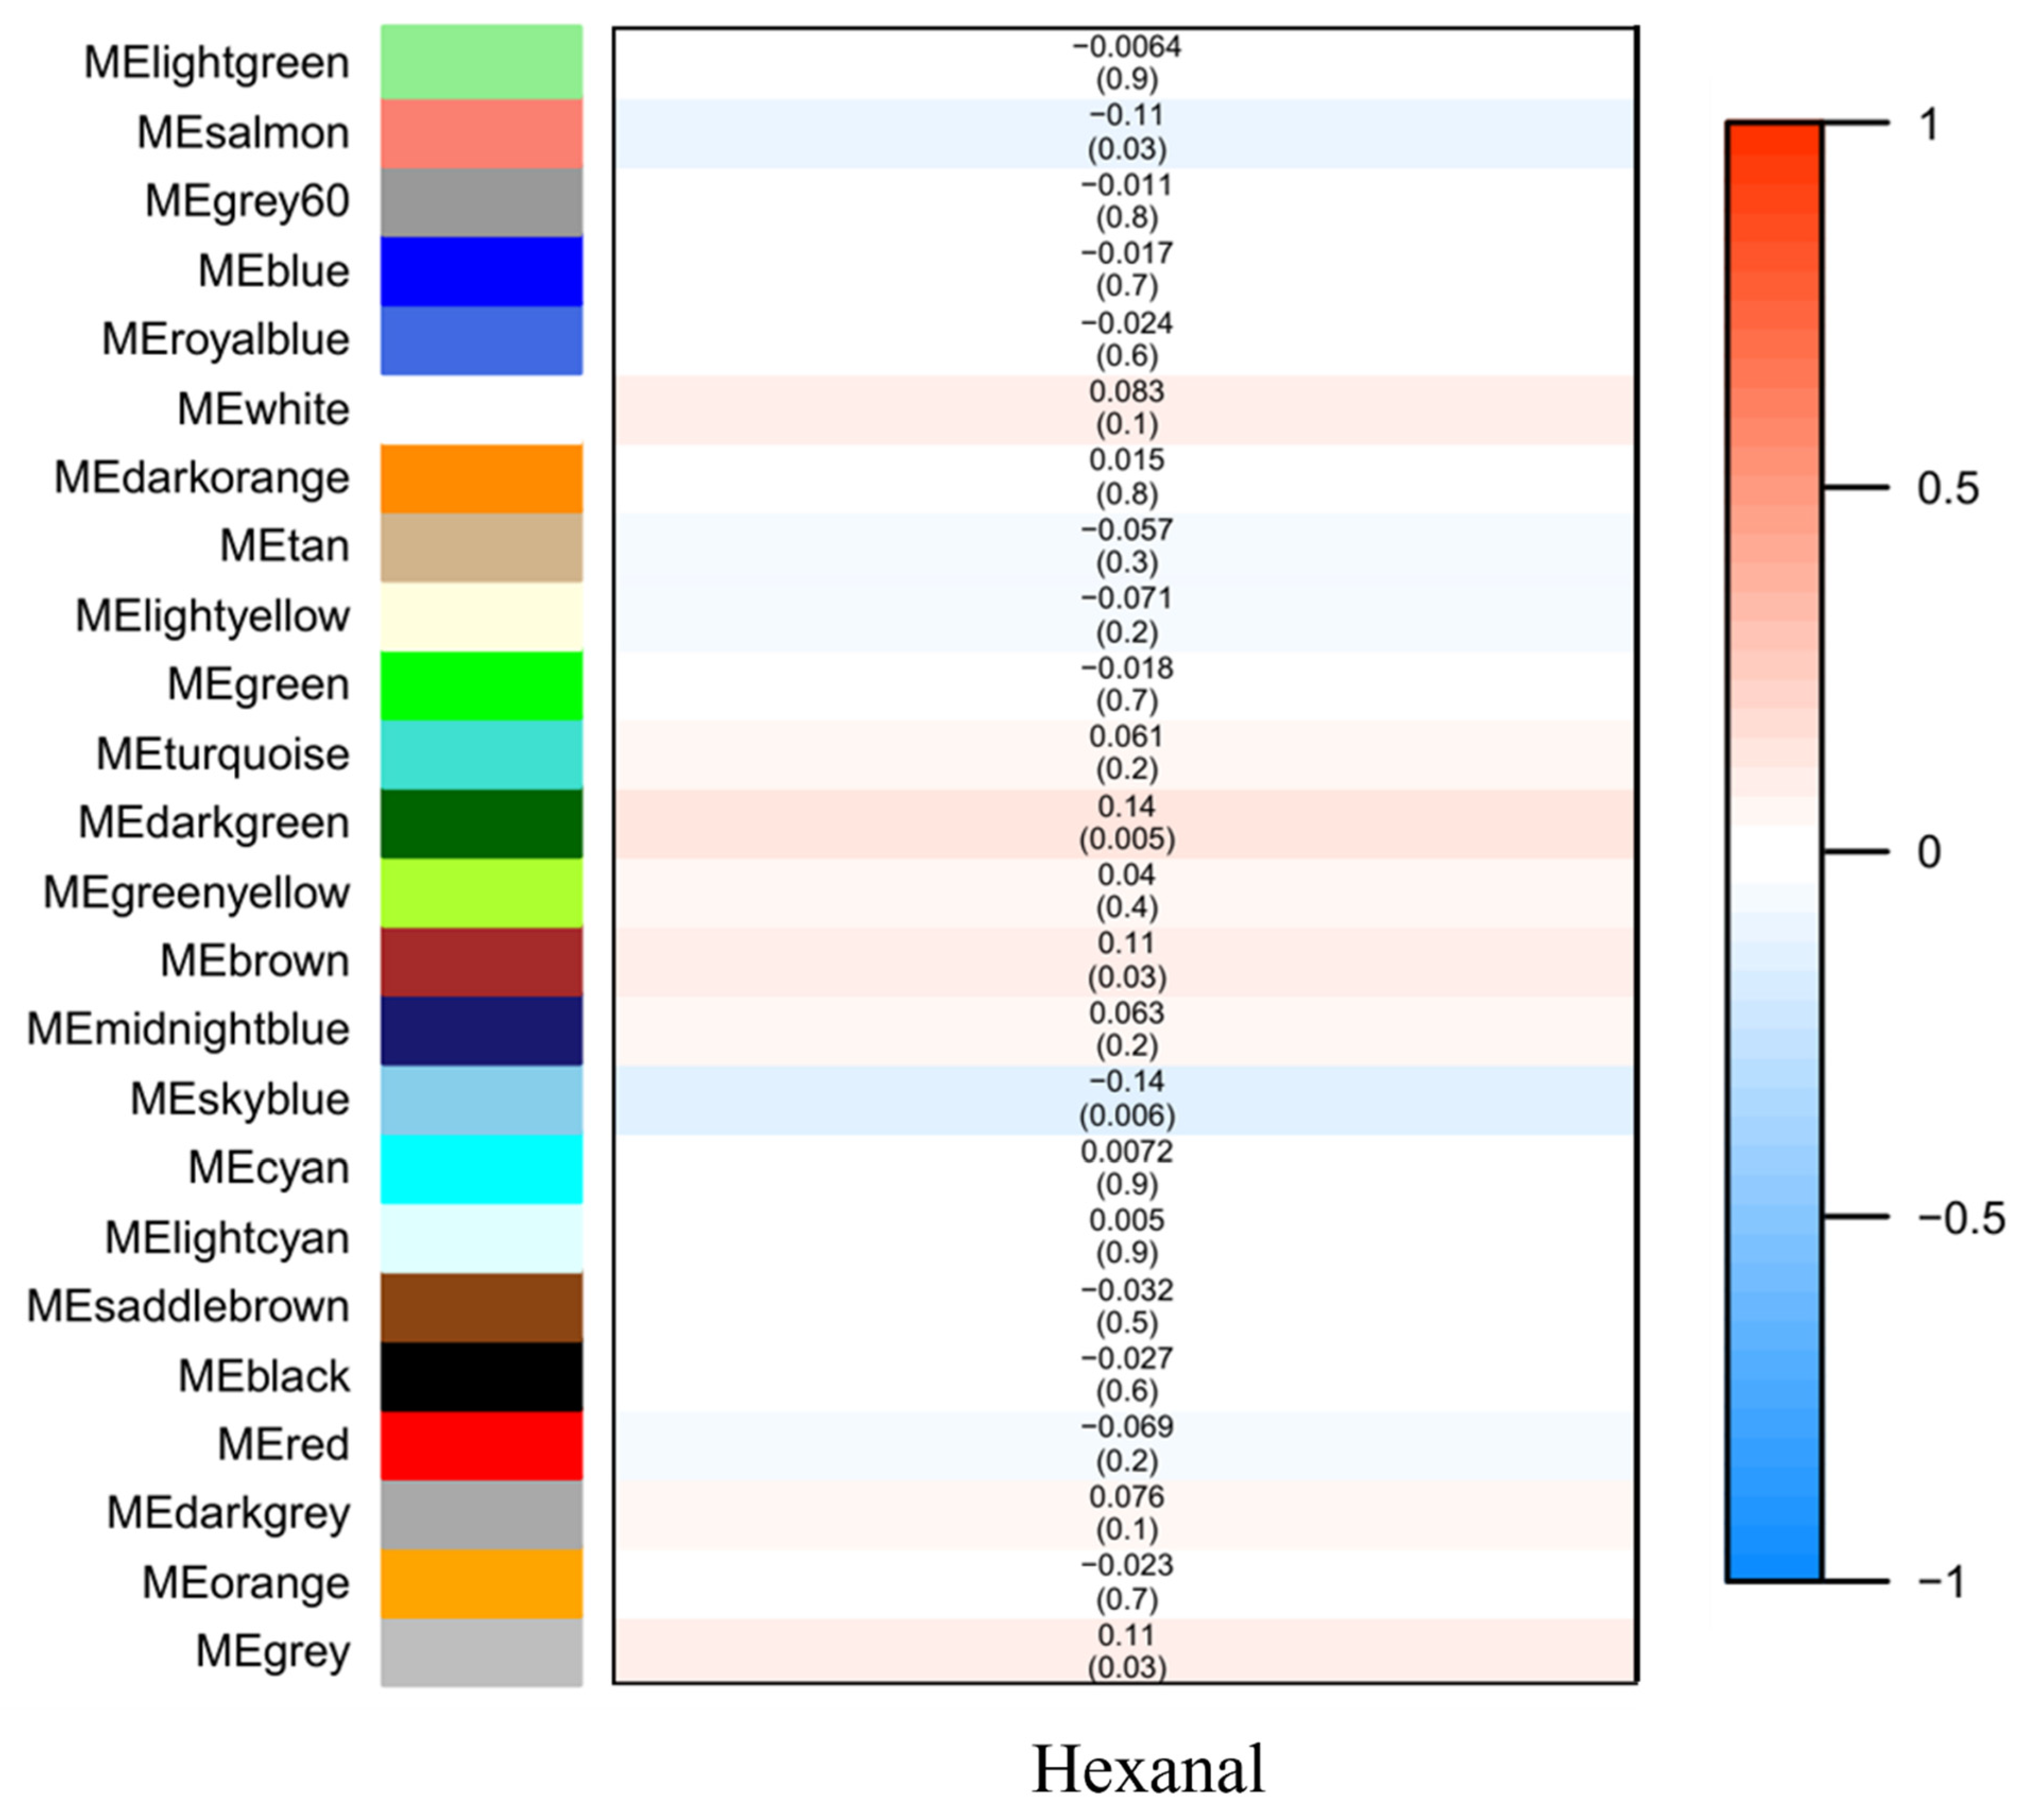
Figure 2. Module–trait associations. Each row corresponds to a module eigenmetabolite, column to a trait. Each cell contains the corresponding correlation and p value. The table is color coded by correlation according to the color legend.
3. Further Analysis of the Significant Modules
The significance and module membership of the correlated genes were plotted for the sky blue module (r = 0.61, and p = 2.3 × 10⁻⁵), dark green module (r = 0.16, and p = 7.1× 10⁻¹⁵), salmon module (r = 0.25, and p = 1.8× 10⁻¹¹ and brown module (r = 0.26, and p = 1.2× 10⁻⁹, again demonstrating that the genes in the modules were significantly associated with hexanal content (Figure 3). To summarize the network results, researchers evaluated the core genes of the relevant module from the perspective that the top network genes were ordered by the GS. A total of 438 genes were selected in four significant modules associated with hexanal (−0.20 < GS.Hexanal < 0.20, and GS.Hexanal; p value < 0.05).
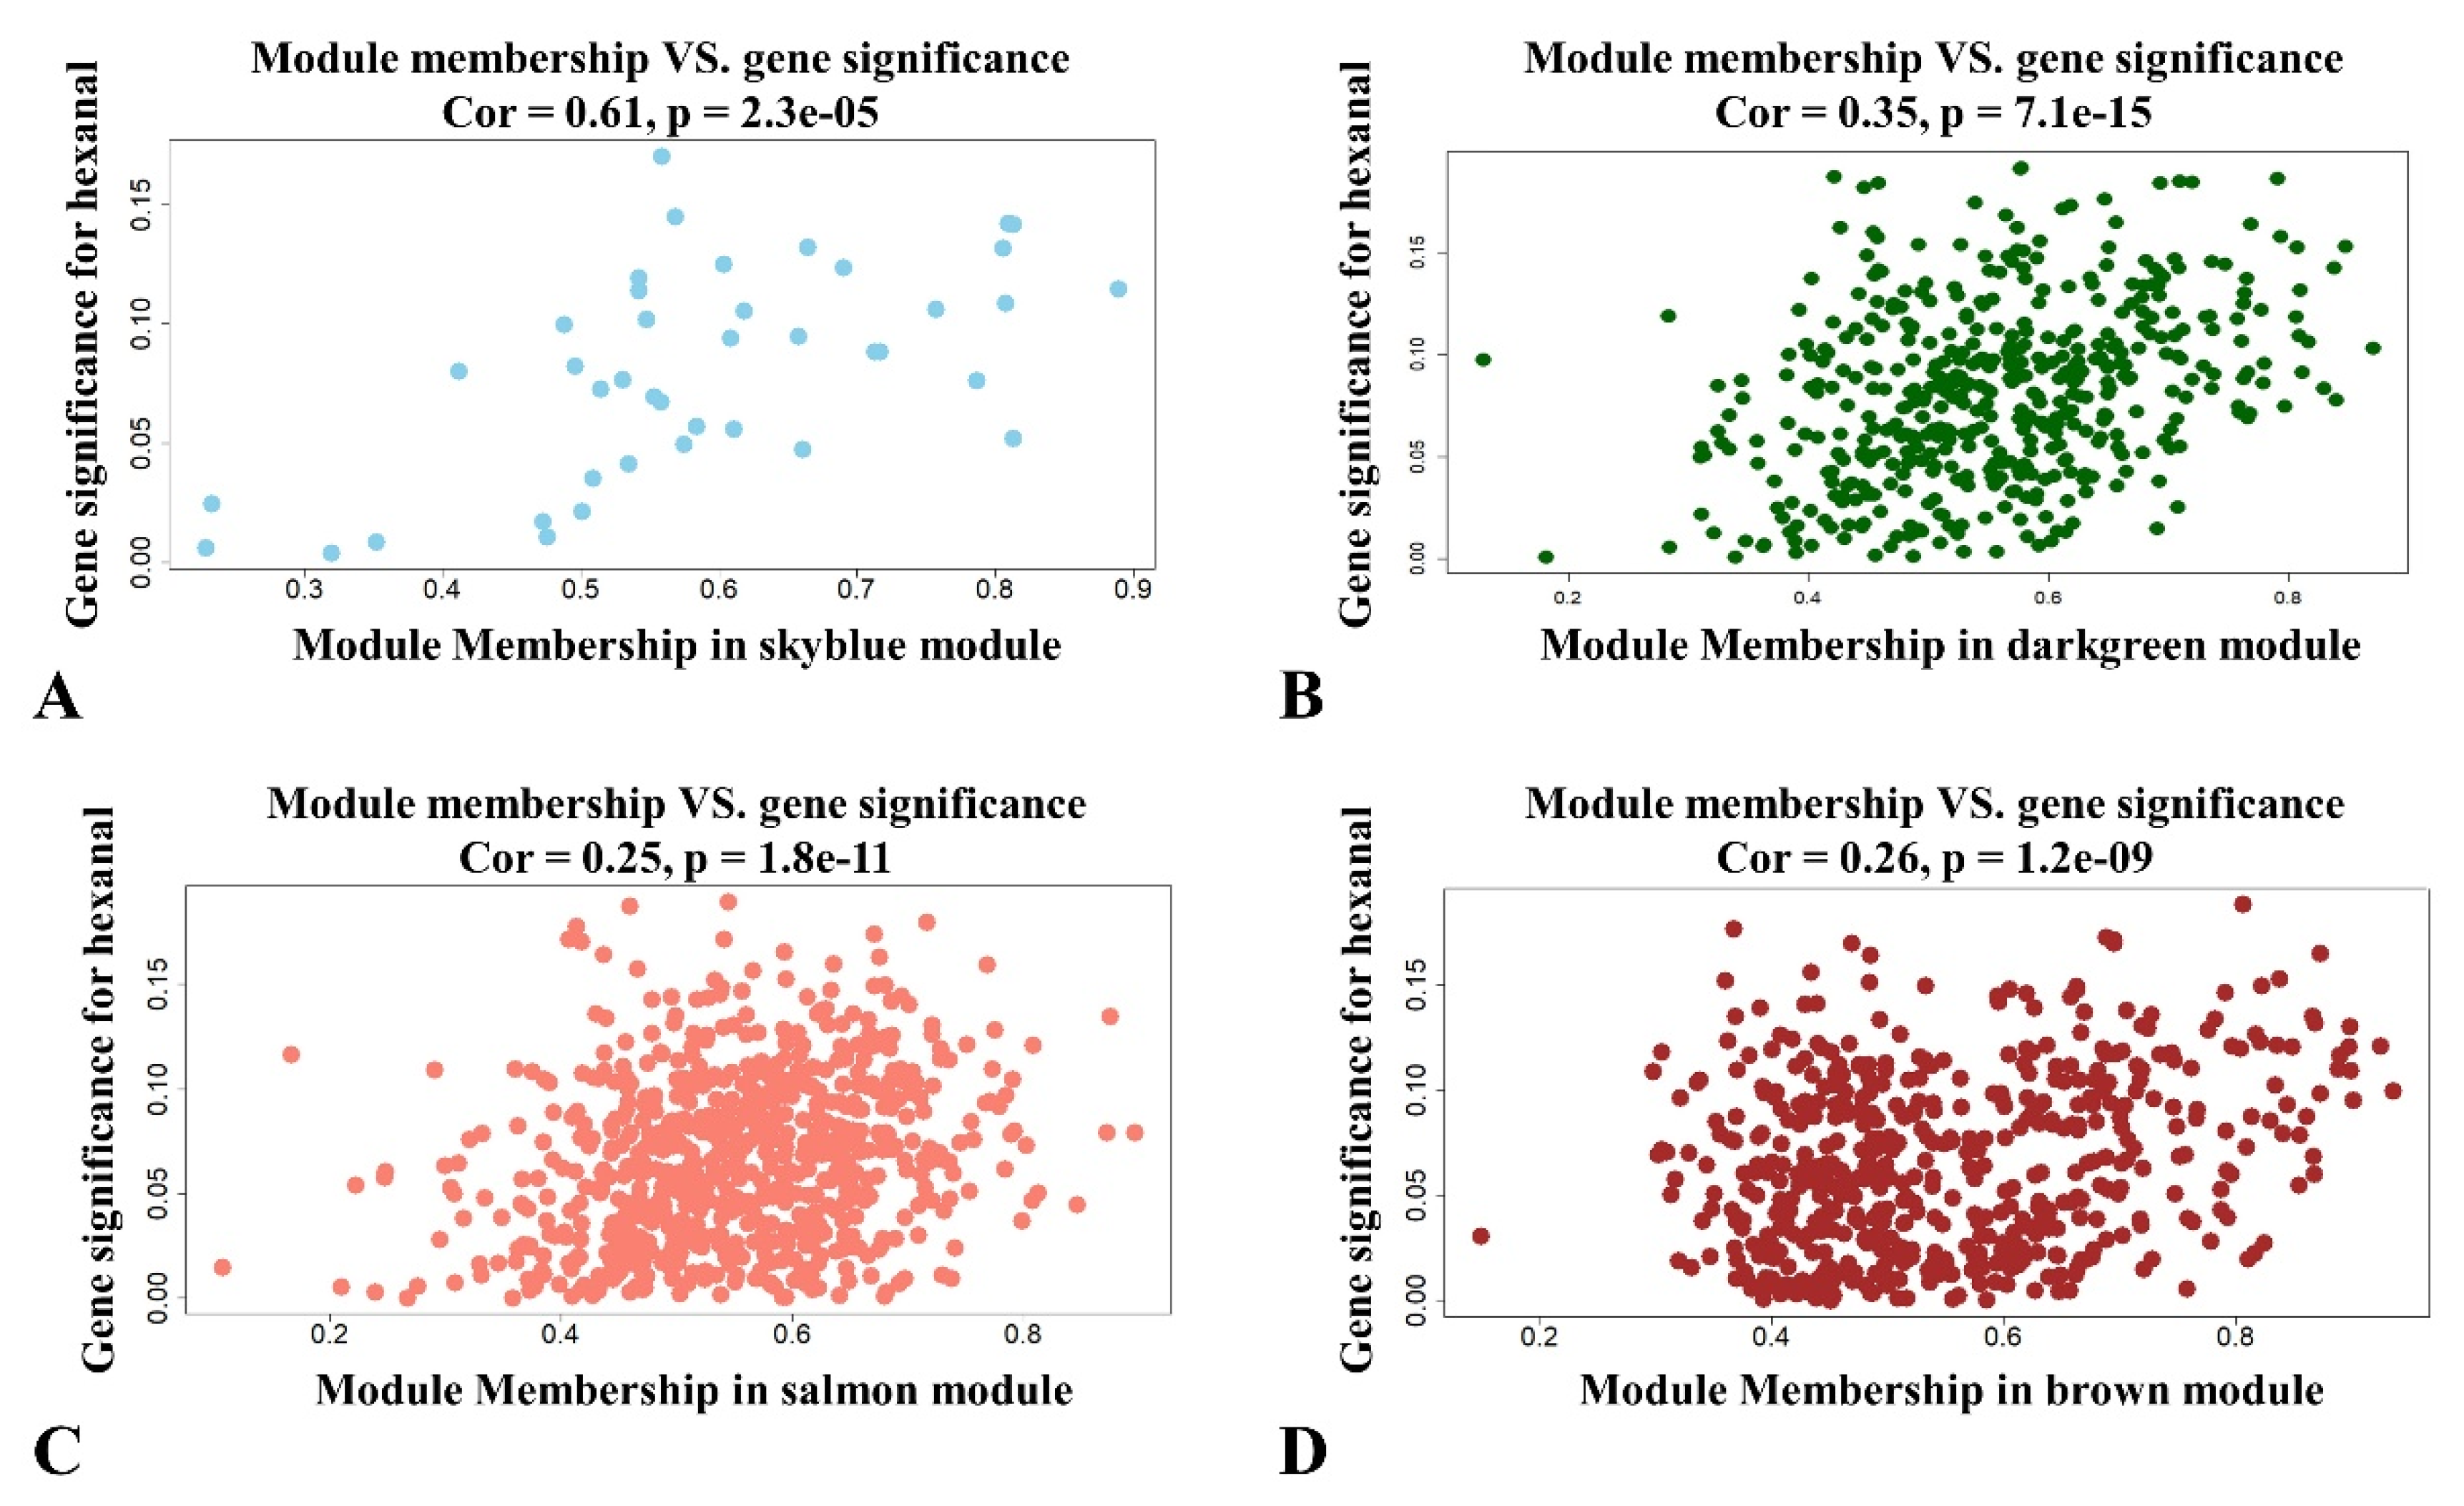
Figure 3. Scatterplot of module membership and gene significance showing correlation between different modules and hexanal. (A) Skyblue module; (B) Darkgreen module; (C) Salmon module; (D) Brown module.
4. Differentially Expressed Genes (DEGs) and Pathways Associated with Hexanal Content
Researchers divided the pectoral muscle samples into two groups according to the relative content of hexanal (p < 0.01; Figure 4A). The DEGs between the H and L groups are shown in the volcano plot (Figure 4B). The results revealed that the expression levels of 356 and 295 genes in the H group were upregulated and downregulated, respectively, compared with the L group. These DEGs were significantly enriched in the PPAR signaling pathway, p53 signaling, MAPK signaling pathway etc., (Table 1). Nine of the DEGs enriched to these pathways were significantly associated with hexanal content in the WGCNA significant modules, including SLC27A1, ACOX3, NR4A1, VEGFA, JUN, EGR1, CACNB1, GADD45A and DUSP1. The SLC27A1 gene was also significantly associated with hexanal content in Jingxing Yellow chickens which was enriched in the PPAR signaling pathway (Figure 5).
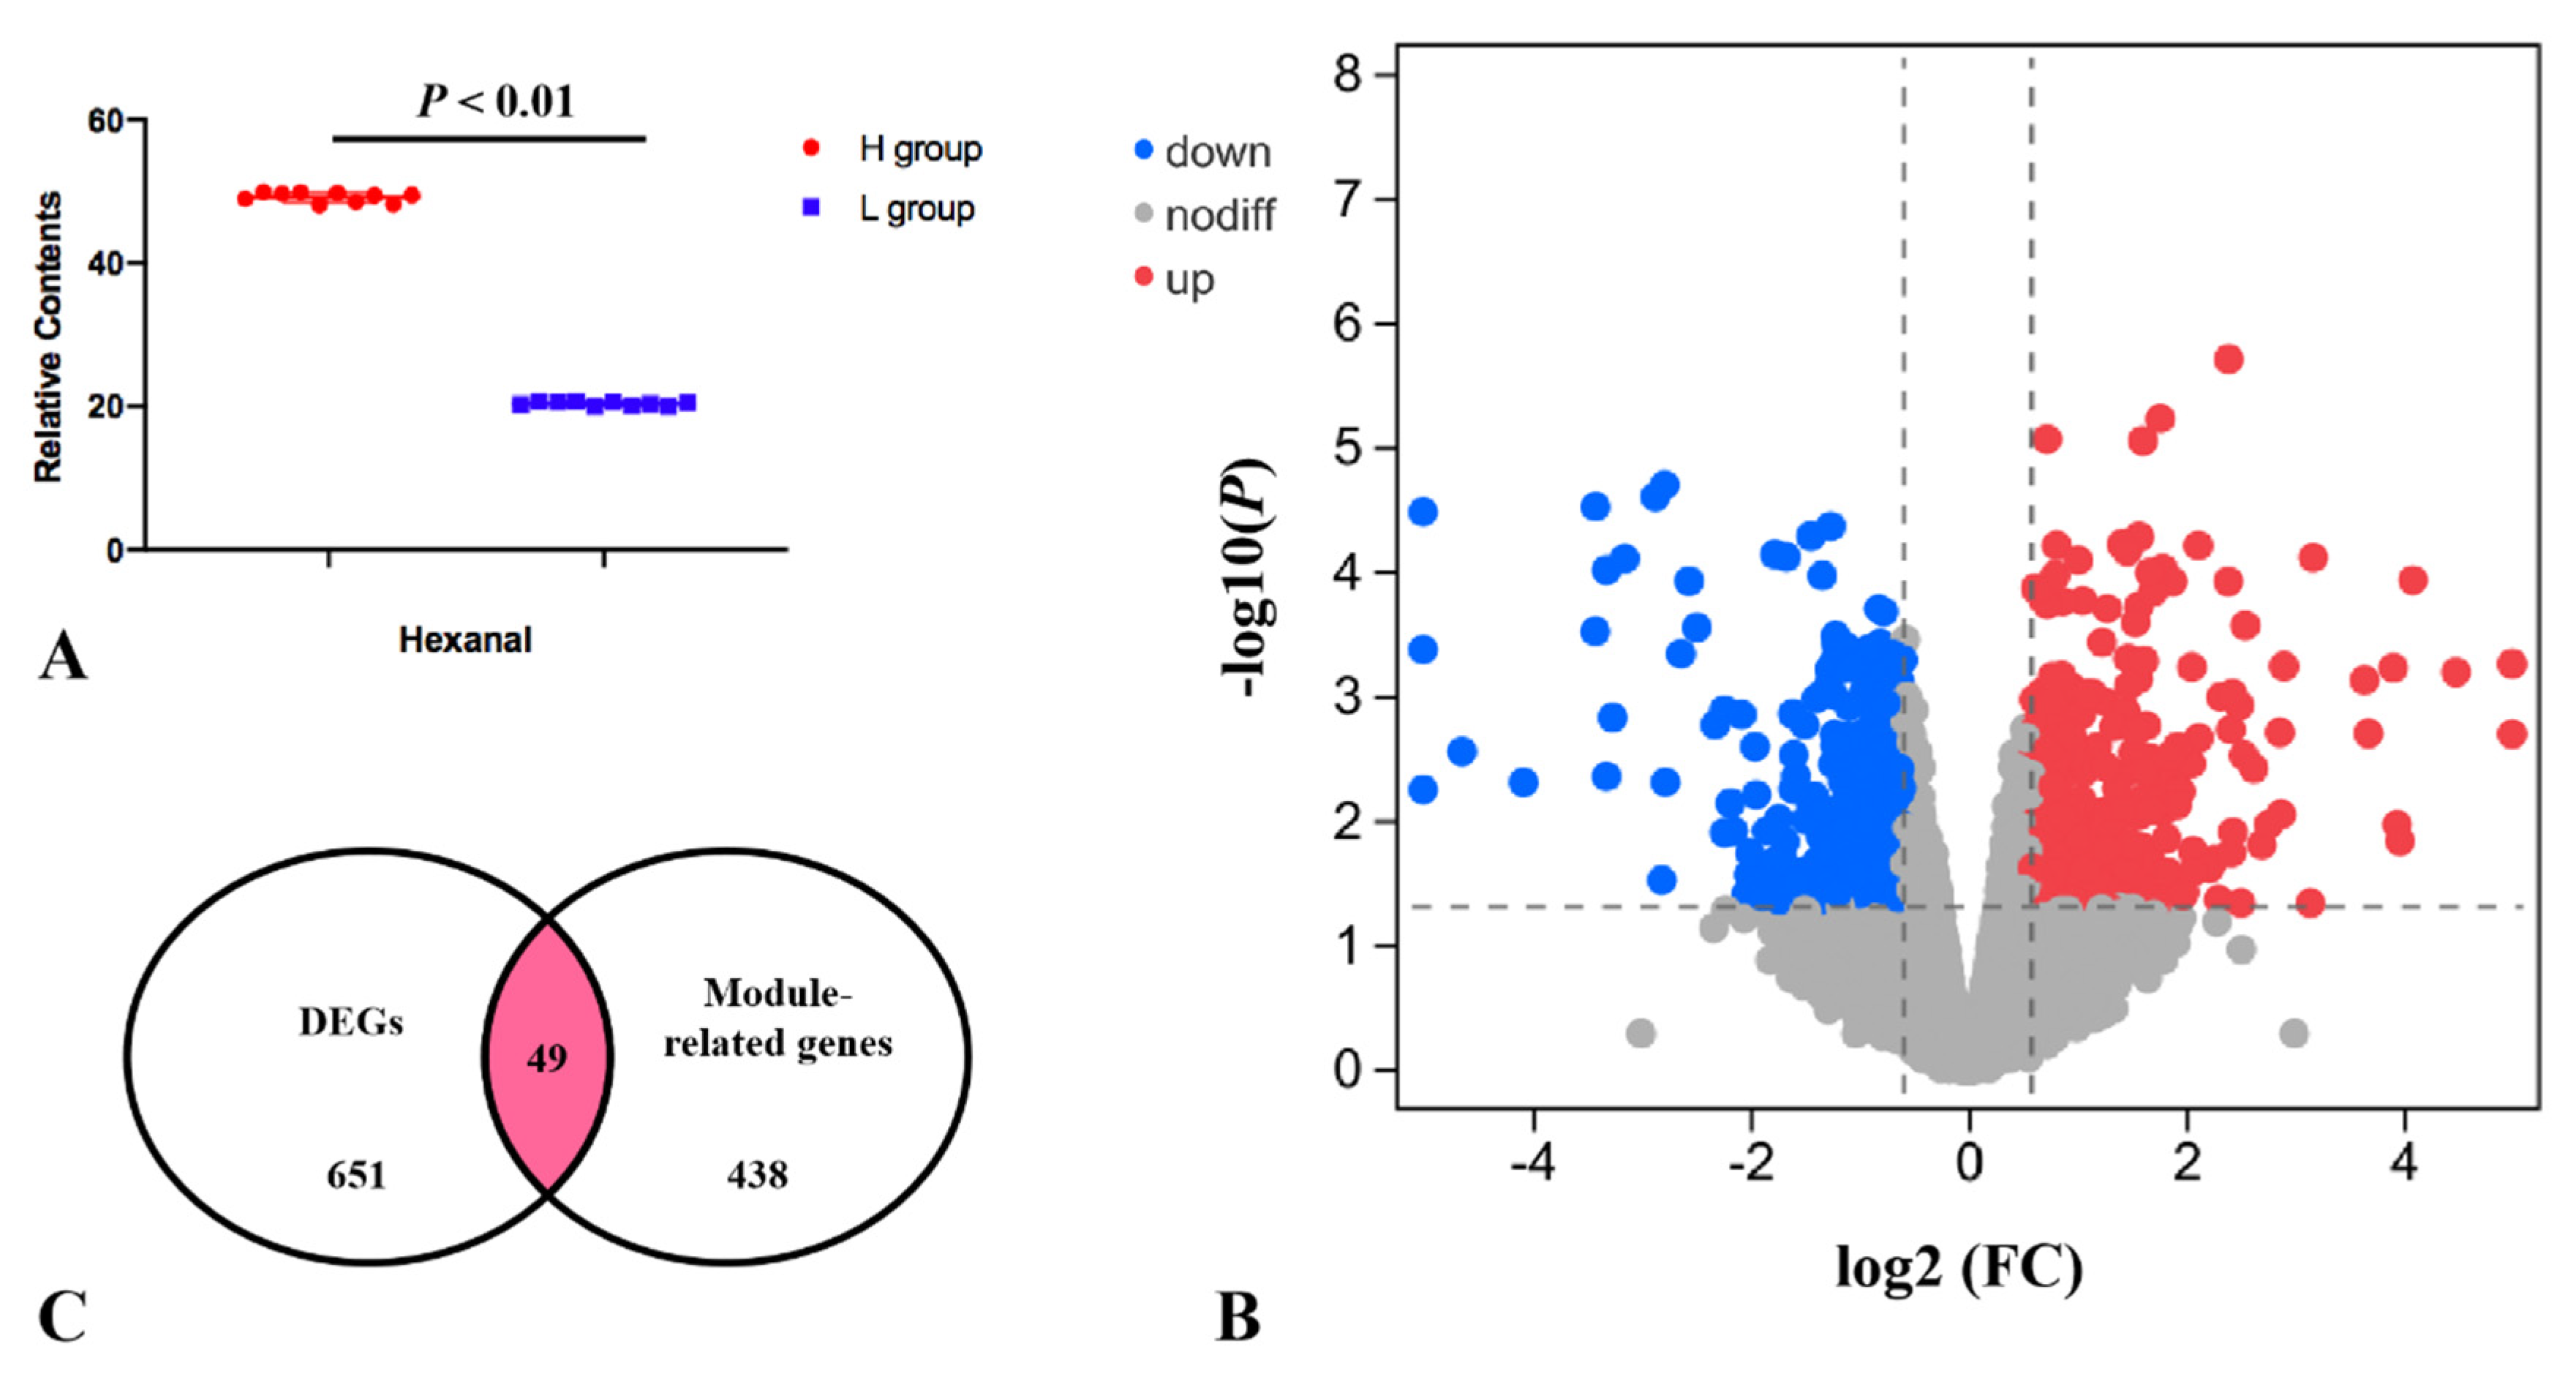
Figure 4. (A) The relative contents of hexanal for the transcriptomic profile of the H and L groups. (B) Volcano plot for H vs. L DEGs. (C) Overlap of the number of DEGs and the number of significantly related module genes in the WGCNA. K.in is described by the number of genes related to a given gene.
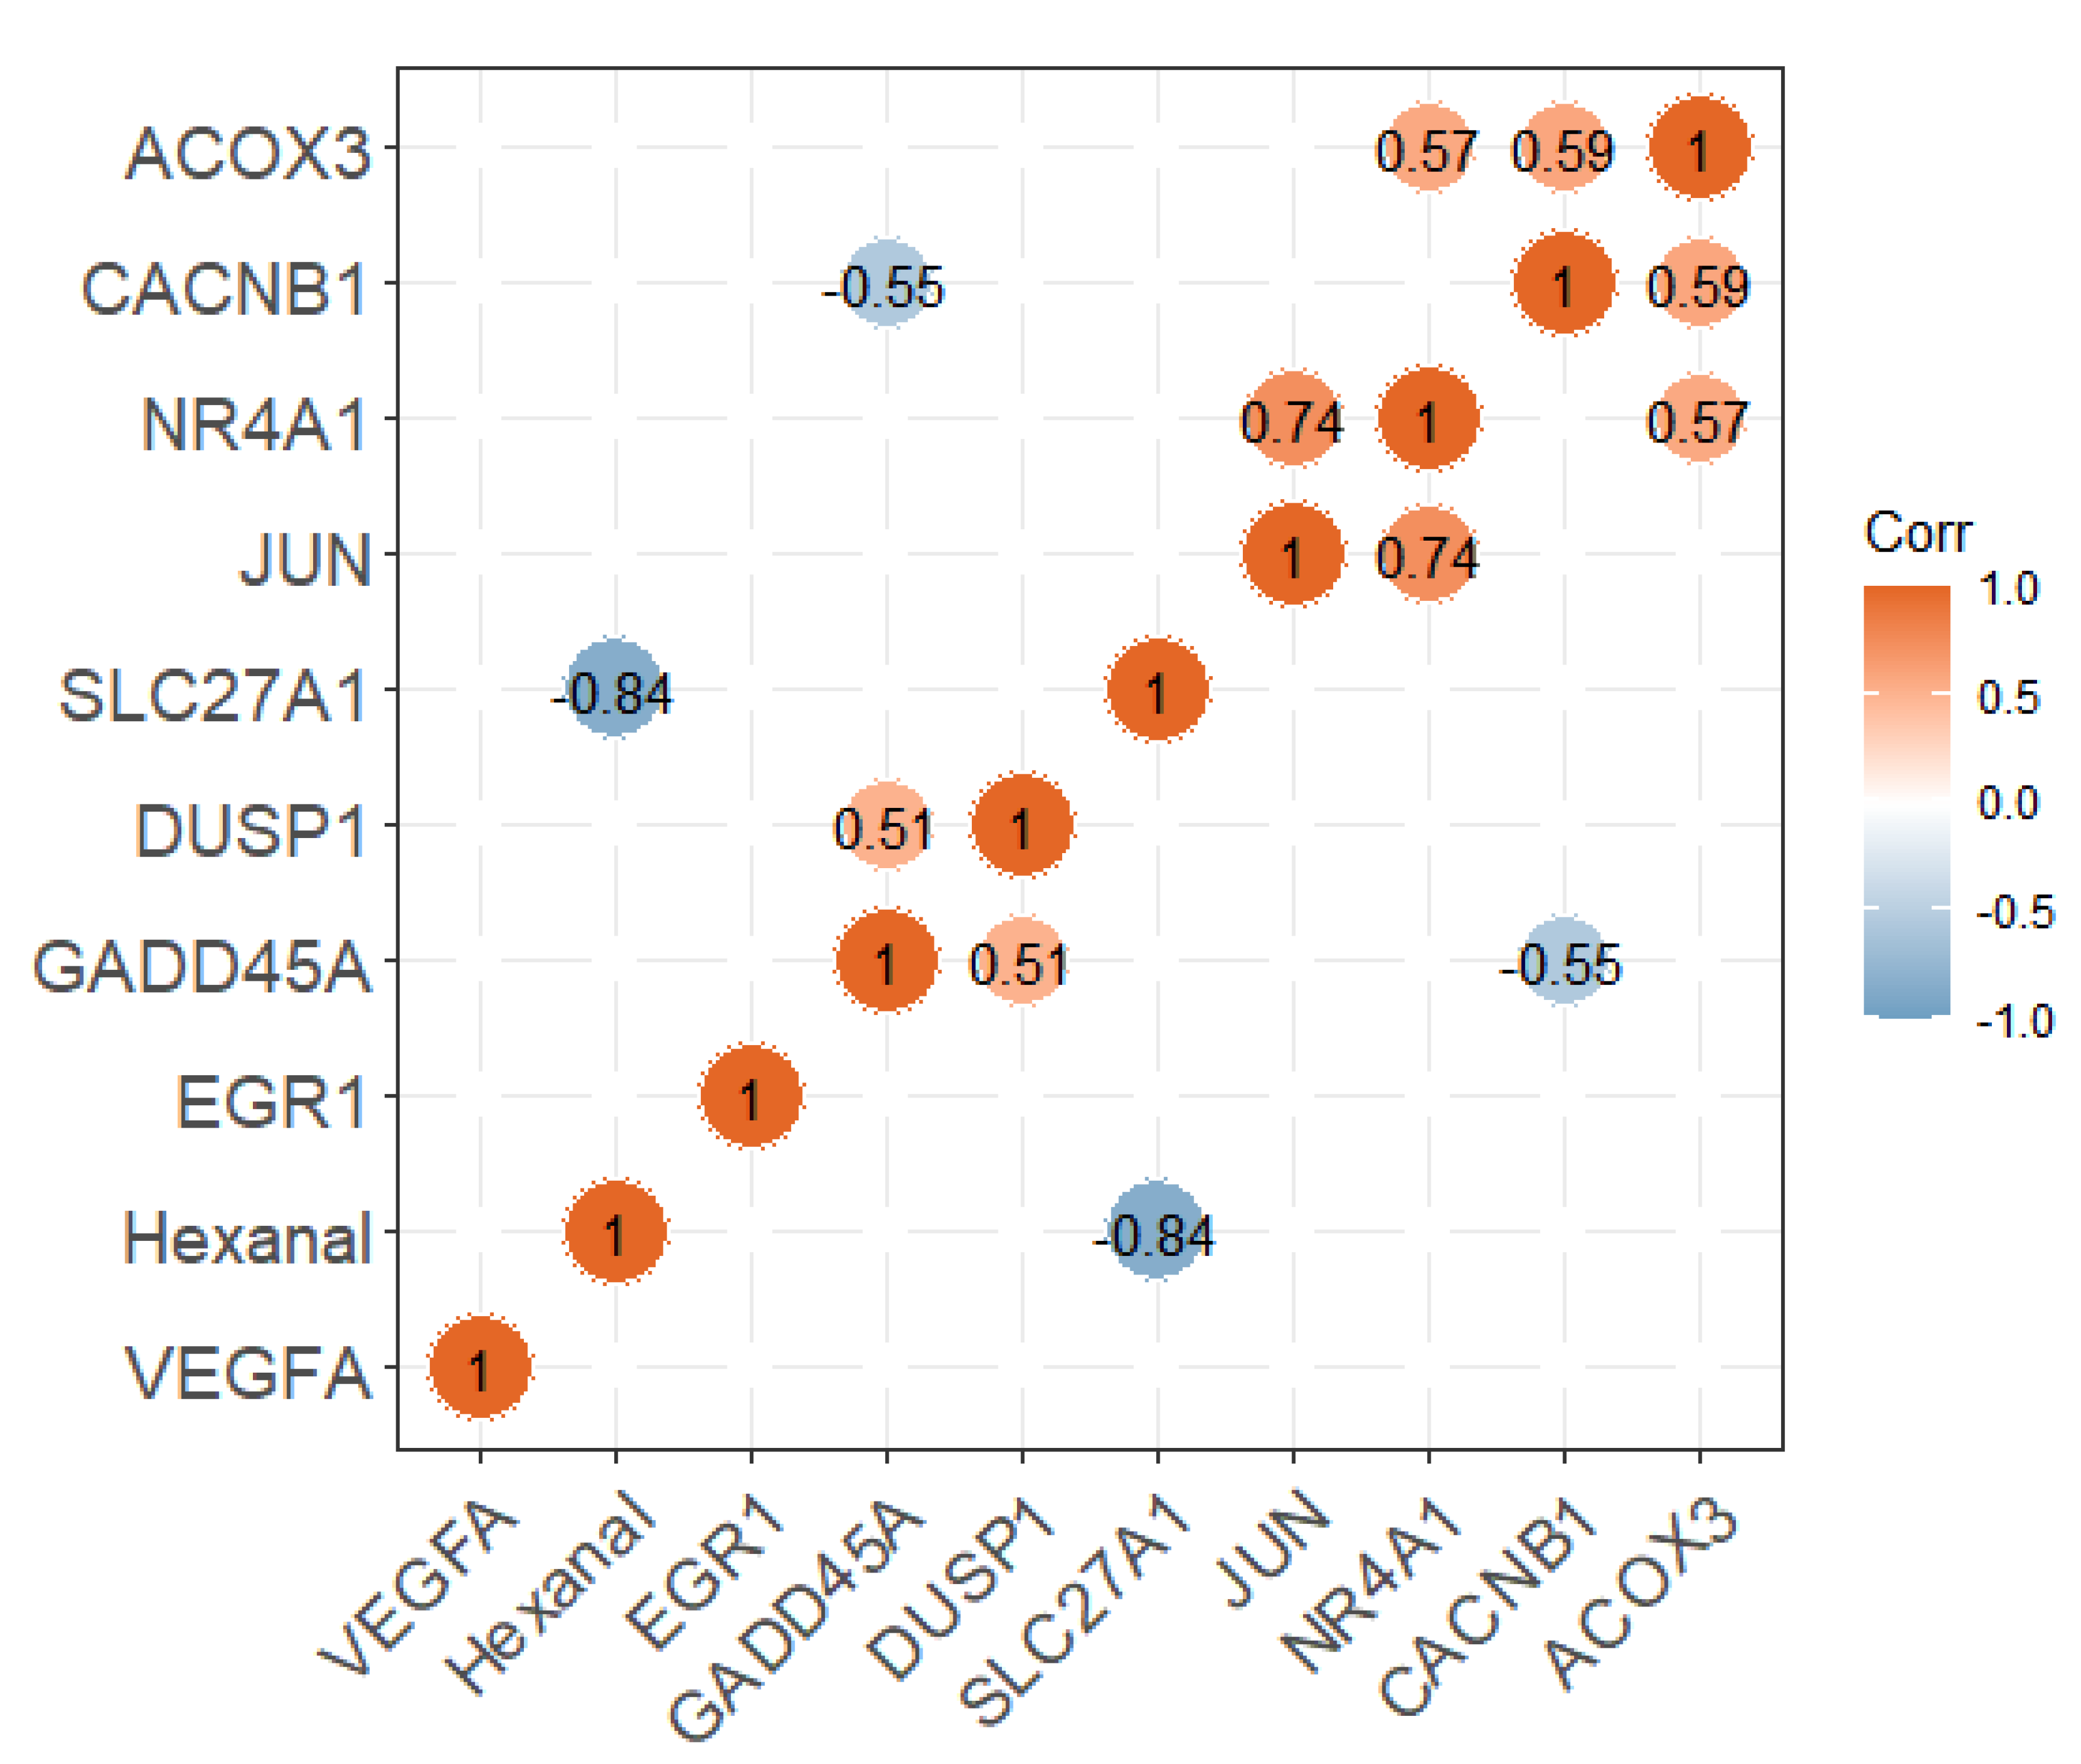
Figure 5. The correlation analysis between the expression of candidate genes and hexanal content.
Table 1. The enrichment significant pathways for DEGs.
| KEGG Name | Gene Name | p Value |
|---|---|---|
| PPAR signaling pathway | ACOX3, ACSL1, ACSL4, APOA5, CD36, CPT1A, FABP4, PLIN2, SLC27A1 | 0.0004 |
| Glycerophospholipid metabolism | AGPAT2, CHKA, ETNK2, GPCPD1, LPCAT2, LPIN1, PCYT1B, PISD, PLA2G15, PLA2G4F | 0.0016 |
| MAPK signaling pathway | CACNA1D, CACNA1H, CACNB1, CSF1, DUSP1, DUSP8, EPHA2, FGFR1, FGFR2, GADD45A, GADD45G, JUN, MAP2K6, MAP4K4, MAPK12, MKNK1, NR4A1, PLA2G4F, VEGFA | 0.0026 |
| Cytokine-cytokine receptor interaction | BMP15, BMP3, BMPR1B, CCL17, CCL4, CCR5, CSF1, CXCR5, EDA2R, GDF10, IL12RB1, INHA, LIF, MSTN | 0.0164 |
| Fatty acid biosynthesis | ACACB, ACSL1, ACSL4 | 0.0204 |
| Fatty acid degradation | ACOX3, ACSL1, ACSL4, CPT1A | 0.0276 |
| GnRH signaling pathway | CACNA1D, CAMK2A, EGR1, JUN, MAP2K6, MAPK12, PLA2G4F | 0.0280 |
| p53 signaling pathway | ATR, CCNG2, GADD45A, GADD45G, GTSE1, SESN2 | 0.0281 |
Note: The bold markers are genes significantly associated with hexanal content in the significant modules of WGCNA.
To verify the SLC27A1 gene expression, a total of six pectoral samples (Hexanal_H ID: 492, 205 and 109; Hexanal_L ID: 406, 249 and 431) were selected from the Jingxing Yellow chicken researchers published [8], and researchers performed quantitative real-time PCR experiments (Figure 6). The primers were listed in Table 2 which were reported [9]. The gene expression pattern of quantitative real-time PCR was generally accordant with that of RNA-seq, although different in fold changes in Qingyuan partridge chicken (log2FC = −0.88), which indicated that the RNA-seq data were reliable.
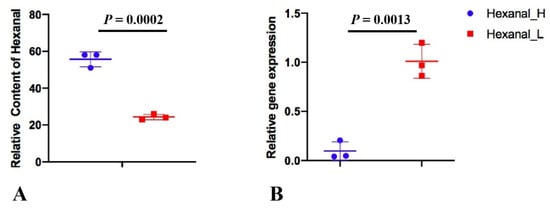
Figure 6. The relative content of hexanal (A) and the relative SLC27A1 gene expression (B) in Hexanal_H and Hexanal_L groups of Jingxing Yellow chicken.
Table 2. The primers used for qRT-PCR verification.
| Accession NO. | Gene Symbol | Primer Sequence | Anneaning Temperature | Product Size |
|---|---|---|---|---|
| NM_001039602.1 | SLC27A1 | F:TGCCTTCCGCTCTACCAC R:TCAACCCGTTTGCCCACT |
59 °C | 239 bp |
This entry is adapted from the peer-reviewed paper 10.3390/genes13020192
References
- Ni, Q.; Khomenko, I.; Gallo, L.; Biasioli, F.; Bittante, G. Rapid Profiling of the Volatilome of Cooked Meat by PTR-ToF-MS: Characterization of Chicken, Turkey, Pork, Veal and Beef Meat. Foods 2020, 9, 1776.
- Takahashi, H. Association Between Arachidonic Acid and Chicken Meat and Egg Flavor, and Their Genetic Regulation. J. Poult. Sci. 2018, 55, 163–171.
- Zhang, C.; Hua, Y.; Li, X.; Kong, X.; Chen, Y. Key volatile off-flavor compounds in peas (Pisum sativum L.) and their relations with the endogenous precursors and enzymes using soybean (Glycine max) as a reference. Food Chem. 2020, 333, 127469.
- Martínez-Zamora, L.; Peñalver, R.; Ros, G.; Nieto, G. Substitution of synthetic nitrates and antioxidants by spices, fruits and vegetables in Clean label Spanish chorizo. Food Res. Int. 2021, 139, 109835.
- Kanski, L.; Naumann, M.; Pawelzik, E. Flavor-Related Quality Attributes of Ripe Tomatoes Are Not Significantly Affected Under Two Common Household Conditions. Front. Plant Sci. 2020, 11, 472.
- Sun, J.; Wang, Y.; Li, N.; Zhong, H.; Xu, H.; Zhu, Q.; Liu, Y. Comparative Analysis of the Gut Microbial Composition and Meat Flavor of Two Chicken Breeds in Different Rearing Patterns. BioMed Res. Int. 2018, 2018, 4343196.
- Jin, Y.; Cui, H.; Yuan, X.; Liu, L.; Liu, X.; Wang, Y.; Ding, J.; Xiang, H.; Zhang, X.; Liu, J.; et al. Identification of the main aroma compounds in Chinese local chicken high-quality meat. Food Chem. 2021, 359, 129930.
- Liu, L.; Liu, X.; Cui, H.; Liu, R.; Zhao, G.; Wen, J. Transcriptional insights into key genes and pathways controlling muscle lipid metabolism in broiler chickens. BMC Genom. 2019, 20, 863.
- Qiu, F.; Xie, L.; Ma, J.E.; Luo, W.; Zhang, L.; Chao, Z.; Chen, S.; Nie, Q.; Lin, Z.; Zhang, X. Lower Expression of SLC27A1 Enhances Intramuscular Fat Deposition in Chicken via Down-Regulated Fatty Acid Oxidation Mediated by CPT1A. Front. Physiol. 2017, 8, 449.
This entry is offline, you can click here to edit this entry!
