Your browser does not fully support modern features. Please upgrade for a smoother experience.
Please note this is an old version of this entry, which may differ significantly from the current revision.
Subjects:
Cell Biology
IMGG, integrating multiple single-cell datasets through connected graphs and generative adversarial networks (GAN) to eliminate nonbiological differences between different batches. Compared with current methods, IMGG shows excellent performance on a variety of evaluation metrics, and the IMGG-corrected gene expression data incorporate features from multiple batches, allowing for downstream tasks such as differential gene expression analysis.
- scRNA-seq
- batch effect
- connected graphs
- GAN
1. Introduction
The maturation of single-cell RNA-sequencing (scRNA-seq) technologies and the continuing decrease in sequencing costs have encouraged the establishment of large-scale projects such as the Human Cell Atlas, which generates transcriptomic data from thousands to millions of cells and almost inevitably involves multiple batches across time points, sequencing technologies, or experimental protocols [1][2]. With the explosive accumulation of single-cell studies, integrative analysis of data from experiments of different contexts is particularly important. However, batch effects or systematic differences in gene expression profiles across batches not only can obscure the true underlying biology but also may lead to spurious findings [3][4][5]. Therefore, to avoid misleading conclusions, they must be corrected before further analysis.
In recent years, a number of algorithms have been published for batch-effect correction. There are two main categories of these methods, according to the correction results. The first is to select a batch as “anchor” and convert other batches to the “anchor” batch, e.g., MNN [6], iMAP [7], SCALEX [8], etc., which has the advantage that different batches of cells can be converted to one other so that gene expression can be studied under the same experimental conditions, and the disadvantage that it is not possible to fully combine the features of each batch and it is difficult to select an “anchor” batch because the cell types contained in each batch are unknown. The other is to transform all batches of data into a low-dimensional space to correct batch effects, e.g., Scanorama [9], Harmony [10], DESC [11], BBKNN [12], etc., which has the advantage of extracting biologically relevant latent features and reducing the impact of noise, and the disadvantage that it cannot be used for differential gene expression analysis.
To compensate for the shortcomings of these methods, researchers integrate multiple single-cell datasets through connected graphs and generative adversarial networks (GAN) to design a batch-effect correction framework called IMGG. IMGG first finds mutual nearest neighbor pairs (MNNs) multiple times in the low-dimensional embedding space, then constructs cross-batch similar-cell connected graphs by MNNs and builds an intermediate batch based on the similarity relationship of cells on these graphs, finally correcting the batch effects by transforming all batches of cells to the intermediate batch with GAN.
2. IMGG Outperforms Existing Methods on Two Batches of Overlapping Data
Researchers first showed the performance of IMGG in correcting two batches of overlapping data using the human peripheral blood mononuclear cell(PBMC) dataset [13][14], which comprised ‘pbmc_3p’ batch obtained by 10× 3’ Genomics protocols and ‘pbmc_5p’ batch obtained by 10× 5’ Genomics protocols.
The UMAP visualization plots (Figure 1) showed a large deviation between the two batches of cells in the raw data after preprocessing. Except for the MNN method, IMGG and all other methods could successfully mix the common cells; the “kissing effects” (where the different types of cells are not clearly separated on the visualization plot and their borders are close together) was obvious in SCALEX; the ‘CD8 naive T’ cells were separated into two parts in BBKNN; and IMGG, Harmony, and iMAP, as well as Scanorama could achieve good results in differentiating cell types.
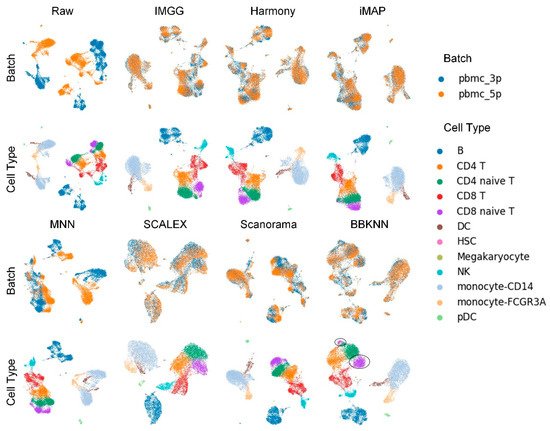
Figure 1. Qualitative evaluation of 7 batch-effect correction methods using UMAP visualization for PBMC dataset. The UMAP diagrams of raw data, IMGG, Harmony, and iMAP are plotted in the top half, and the UMAP diagrams of MNN, SCALEX, Scanorama, and BBKNN are plotted in the bottom half. Each half contains two rows of UMAP plots. In the first row, cells are colored by batch, and in the second by cell type.
For ASW (Figure 2a), both IMGG and other methods obtained good scores in batch mixing (1 − ASW batch > 0.98), and in cell-type purity score IMGG was second only to SCALEX. For ARI (Figure 2b), both IMGG and other methods obtained good scores (1 − ARI batch > 0.99), and in cell-type purity IMGG scores ranked third. For LISI (Figure 2c), IMGG ranked highest in both cell-type purity metric cLISI and batch-mixing metric iLISI. Finally, based on the sum of the rankings of the evaluated metrics (for fairness, if the score difference was less than 0.01, the ranking was considered the same), IMGG ranked first (Figure 2d).
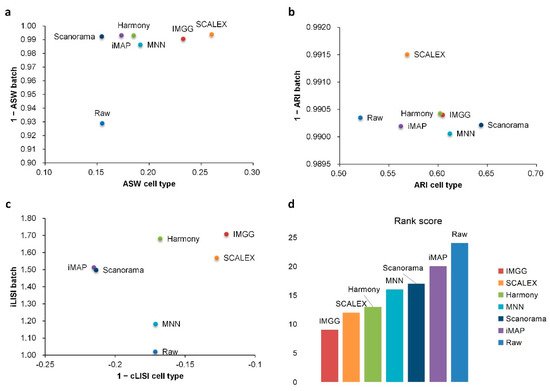
Figure 2. Quantitative evaluation of 6 batch-effect correction methods using the three-assessment metrics (a) ASW, (b) ARI, and (c) LISI on PBMC dataset. Methods appearing at the upper-right quadrant of the ASW, ARI, and LISI plots are the good performing methods. (d) The sum of each method’s ranking on all evaluation metrics, with smaller values indicating better overall performance.
3. IMGG Outperforms Existing Methods on Multiple Batches of Overlapping Data
To show the advantage of IMGG in processing multiple batches, researchers compared its performance with the current mainstream algorithms using the human pancreas (Pancreas) dataset [15][16][17][18][19], which contained five batches of data obtained by different techniques.
The UMAP visualization plots (Figure 3) showed that the preprocessed raw data had large batch effects, the MNN algorithm could only pull together different batches and could not mix batches well, while IMGG and the other five methods all mixed different batches and distinguished different cell types well.
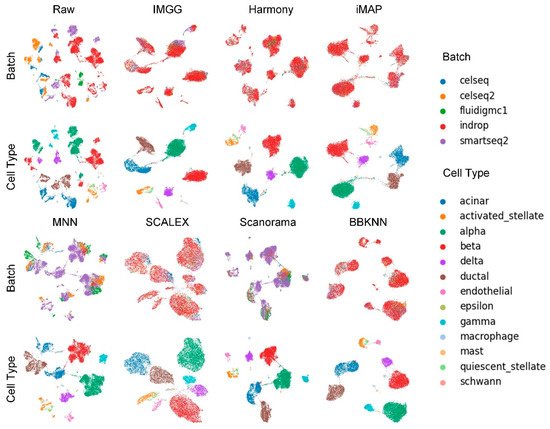
Figure 3. Qualitative evaluation of 7 batch-effect correction methods using UMAP visualization for Pancreas dataset. The UMAP diagrams of raw data, IMGG, Harmony, and iMAP are plotted in the top half, and the UMAP diagrams of MNN, SCALEX, Scanorama, and BBKNN are plotted in the bottom half. Each half contains two rows of UMAP plots. In the first row, cells are colored by batch, and in the second by cell type.
For ASW (Figure 4a), IMGG was ahead of other methods in both batch-mix score and cell-purity score. For ARI (Figure 4b), all methods performed well in batch-mix score (1 − ARI batch > 0.98), and IMGG was ahead of other methods in cell-type purity. For LISI (Figure 4c), IMGG had the highest score in batch-mix index iLISI; and in the cell-type purity index cLISI, IMGG, Harmony, MNN, and Scanorama were comparable (score difference less than 0.01). Finally, based on the sum of the rankings of the evaluated indicators (for fairness, if the score difference was less than 0.01, the ranking was considered the same), IMGG ranked first (Figure 4d).
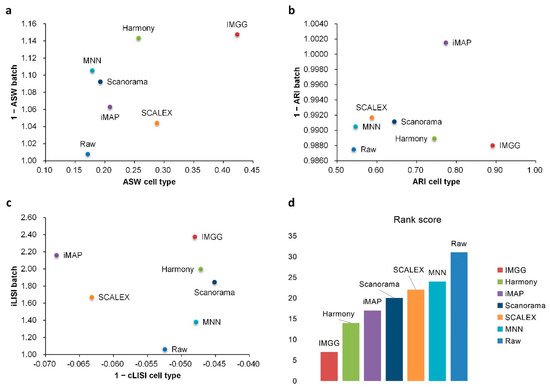
Figure 4. Quantitative evaluation of 6 batch-effect correction methods using the three-assessment metrics (a) ASW, (b) ARI, and (c) LISI on Pancreas dataset. Methods appearing at the upper-right quadrant of the ASW, ARI, and LISI plots are the good performing methods. (d) The sum of each method’s ranking on all evaluation metrics, with smaller values indicating better overall performance.
4. IMGG Outperforms Existing Methods on Non-Overlapping Data
In practical studies of scRNA-seq, cell types usually differ between batches. Therefore, researchers again performed experiments on non-overlapping data to demonstrate the ability of IMGG to handle real data.
Human dendritic cells (DC) were a two-batch dataset obtained using Smart-seq2 technology, and consisted of four types of human dendritic cells (DCs), i.e., CD1C DC, CD141 DC, plasmacytoid DC (pDC), and double-negative cells (DoubleNeg) [20]. Two types of biologically similar cells, CD1C DC from batch1 and CD141 DC from batch2, were removed to ensure the two sub-datasets contained batch-specific cells [13].
They first conducted experiments using the DC dataset to demonstrate the ability of IMGG in handling two batches of non-overlapping data.
The UMAP visualization plots (Figure 5) showed only a “kissing effect” between the two batches in the preprocessed raw data, indicating small batch effects. After running batch-correction algorithms, the two batch-specific cell types ‘CD1C’ and ‘CD141’ overlapped incorrectly in Harmony and Scanorama, and there was still a “kiss effect” on iMAP and SCALEX, as well as BBKNN. Only IMGG and MNN can correctly distinguish different cell types.
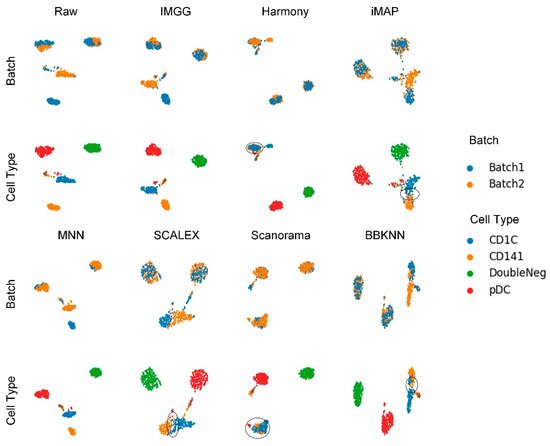
Figure 5. Qualitative evaluation of 7 batch-effect correction methods using UMAP visualization for DC dataset. The UMAP diagrams of raw data, IMGG, Harmony and iMAP are plotted in the top half, and the UMAP diagrams of MNN, SCALEX, Scanorama, and BBKNN are plotted in the bottom half. Each half contains two rows of UMAP plots. In the first row, cells are colored by batch, and in the second by cell type.
For ASW (Figure 6a), all methods performed well in mixing batches (1 − ASW > 0.99) and IMGG was next to SCALEX in cell-type purity assessment. For ARI (Figure 6b), all methods performed well in batch mixing (1 − ARI batch > 1), and IMGG was tied with Harmony for first place in cell-type purity. For LISI (Figure 6c), IMGG was second only to Harmony in batch-mixing assessment, and ranked first in cell-type purity assessment. Finally, based on the sum of the rankings of the assessment metrics (for fairness, if the score difference was less than 0.01, the ranking was considered the same), IMGG ranked first alongside Harmony (Figure 6d), but the UMAP visualization plots suggested that Harmony was not well suited to handle this type of data.
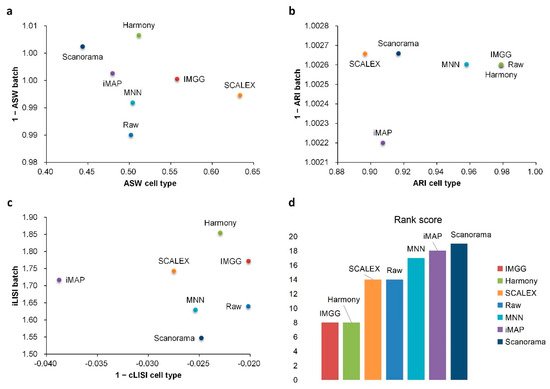
Figure 6. Quantitative evaluation of 6 batch-effect correction methods using the three-assessment metrics (a) ASW, (b) ARI, and (c) LISI on DC dataset. Methods appearing at the upper-right quadrant of the ASW, ARI, and LISI plots are the good performing methods. (d) The sum of each method’s ranking on all evaluation metrics, with smaller values indicating better overall performance.
5. IMGG-Corrected Data Can Integrate Features from Multiple Batches
The novelty of IMGG is the ability to combine the features of different batches. Researchers first performed differential expression analysis using B cells from the PBMC dataset between the ‘pbmc_3p’ batch and the ‘pbmc_5p’ batch to filter out the significant genes causing the separation of the two batches of B cells. The IMGG batch-correction algorithm was then run by selecting the Mean, Max, and Min modes, respectively, and the corrected data were subjected to differential expression analysis again, and no genes were screened out, which demonstrated that each pattern could eliminate the differences between the two batches.
They visualized the changes in expression of significant genes causing B-cell segregation before and after correction. In the Mean pattern (Figure 7a) the expression of significant genes changed toward their means (i.e., for a single gene, the expression after IMGG correction was approximately equal to the mean of the expression in the two batches before correction). In the Max pattern (Figure 7b) the expression of significant genes changed toward their maxima. In the Min pattern (Figure 7c) the expression of significant genes changed toward their minima.
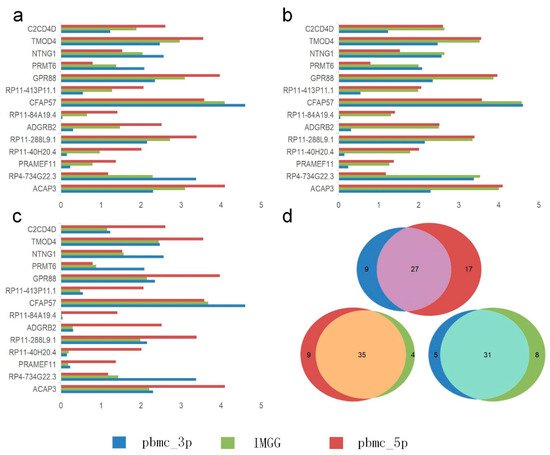
Figure 7. Gene differential expression analysis. (a–c) Differential expression of significant genes on B cells in the PMBC dataset before and after IMGG correction, where (a) Mean pattern, (b) Max pattern, and (c) Min pattern. (d) Venn diagram of changes in the number of differentially expressed genes of B cells and CD4 T cells in the PBMC dataset before and after IMGG correction. The original data with ‘pbmc_3p’ batch was colored in blue and ‘pbmc_5p’ in red. The IMGG-corrected data no longer distinguished between batches and used lime-green coloring.
Meanwhile, researchers showed IMGG’s ability in finding differentially expressed genes by combining multi-batch features. Researchers performed differential expression analysis using B cells and CD4 T cells from PBMC dataset in ‘pbmc_3p’ batch, ‘pbmc_5p’ batch, and IMGG corrected data, and the number of filtered differentially expressed genes was visualized by Venn diagram, respectively (Figure 7d). As can be seen from the figure, the differentially expressed genes found in the ‘pbmc_3p’ batch and the ‘pbmc_5p’ batch are more different, but the differentially expressed genes found after IMGG correction are more similar to the genes found in each batch individually, which indicated that the differential expression analysis using the IMGG-corrected data can filter genes that incorporate both batches’ characteristics and better reflect the true differences. To prove the above conclusion, they used the expression of these three sets of differentially expressed genes on raw data, ‘pbmc_3p’ batch, ‘pbmc_5p’ batch, and IMGG-corrected data for ASW assessment of the two cell types, respectively, and higher ASW scores indicated that the two cell types were more dissimilar, and the experimental results showed that the differentially expressed genes found using IMGG-corrected data achieved the best ASW scores, which confirmed that the IMGG can improve differential expression analysis.
6. IMGG Performs at an Excellent Level in Terms of Time Overhead
To test the time-performance of IMGG, they simulated datasets of 500–100,000 cells and compared the runtime of IMGG and other methods on these datasets, respectively.
For better presentation, researchers logarithmized the running time (Figure 8). The three deep learning-based methods, IMGG, iMAP, and SCALEX, all have a larger time overhead than the other non-deep learning methods on small datasets because there is an additional training process using deep learning techniques. The time spent by these three methods increases at a lower rate than the other methods as the data size increases, and the time complexity approximates , and IMGG outperforms iMAP and SCALEX. The running time of the methods that return corrected gene expression matrices is larger than that of the methods that return reduced dimensional matrices, but this gap decreases as the data size increases. In summary, the time complexity of IMGG is better than that of the same class method.
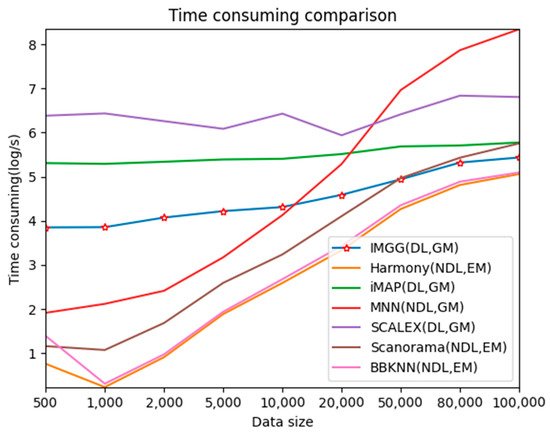
Figure 8. Time-consuming comparison between IMGG and other methods on different size datasets. DL means deep learning is used and NDL means no deep learning is used. GM means corrected gene expression matrix is returned and EM means corrected embedding matrix is returned.
This entry is adapted from the peer-reviewed paper 10.3390/ijms23042082
References
- Rozenblatt-Rosen, O.; Stubbington, M.J.T.; Regev, A.; Teichmann, S.A. The Human Cell Atlas: From Vision to Reality. Nature 2017, 550, 451–453.
- Hon, C.C.; Shin, J.W.; Carninci, P.; Stubbington, M.J. The Human Cell Atlas: Technical Approaches and Challenges. Brief. Funct. Genom. 2017, 17, 283–294.
- Hicks, S.C.; Townes, F.W.; Teng, M.; Irizarry, R.A. Missing Data and Technical Variability in Single-Cell RNA-Sequencing Experiments. Biostatistics 2017, 19, 562–578.
- Tung, P.Y.; Blischak, J.D.; Hsiao, C.J.; Knowles, D.A.; Burnett, J.E.; Pritchard, J.K.; Gilad, Y. Batch Effects and the Effective Design of Single-Cell Gene Expression Studies. Sci. Rep. 2017, 7, 39921.
- Leek, J.T.; Scharpf, R.B.; Bravo, H.C.; Simcha, D.; Langmead, B.; Johnson, W.E.; Geman, D.; Baggerly, K.; Irizarry, R.A. Tackling the Widespread and Critical Impact of Batch Effects in High-Throughput Data. Nat. Rev. Genet. 2010, 11, 733–739.
- Haghverdi, L.; Lun, A.T.L.; Morgan, M.D.; Marioni, J.C. Batch Effects in Single-Cell RNA-Sequencing Data Are Corrected by Matching Mutual Nearest Neighbors. Nat. Biotechnol. 2018, 36, 421–427.
- Wang, D.; Hou, S.; Zhang, L.; Wang, X.; Zhang, Z. IMAP: Integration of Multiple Single-Cell Datasets by Adversarial Paired Transfer Networks. Genome Biol. 2021, 22, 63.
- Xiong, L.; Tian, K.; Li, Y.; Zhang, Q.C. Construction of Continuously Expandable Single-Cell Atlases through Integration of Heterogeneous Datasets in a Generalized Cell-Embedding Space. bioRxib 2021.
- Hie, B.; Bryson, B.; Berger, B. Efficient Integration of Heterogeneous Single-Cell Transcriptomes Using Scanorama. Nat. Biotechnol. 2019, 37, 685–691.
- Korsunsky, I.; Millard, N.; Fan, J.; Slowikowski, K.; Raychaudhuri, S. Fast, Sensitive and Accurate Integration of Single-Cell Data with Harmony. Nat. Methods 2019, 16, 1289–1296.
- Li, X.; Wang, K.; Lyu, Y.; Pan, H.; Zhang, J.; Stambolian, D.; Susztak, K.; Reilly, M.P.; Hu, G.; Li, M. Deep Learning Enables Accurate Clustering with Batch Effect Removal in Single-Cell RNA-Seq Analysis. Nat. Commun. 2020, 11, 2338.
- Polański, K.; Park, J.E.; Young, M.D.; Miao, Z.; Teichmann, S.A. BBKNN: Fast Batch Alignment of Single Cell Transcriptomes. Bioinformatics 2019, 36, 964–965.
- Tran, H.; Ang, K.S.; Ch Evrier, M.; Zhang, X.; Ch En, J. A Benchmark of Batch-Effect Correction Methods for Single-Cell RNA Sequencing Data. Genome Biol. 2020, 21, 12.
- Zheng, G.; Terry, J.M.; Belgrader, P.; Ryvkin, P.; Bent, Z.W.; Wilson, R.; Ziraldo, S.B.; Wheeler, T.D.; Mcdermott, G.P.; Zhu, J. Massively Parallel Digital Transcriptional Profiling of Single Cells. Nat. Commun. 2017, 8, 14049.
- Grün, D.; Muraro, M.; Boisset, J.C.; Wiebrands, K.; Lyubimova, A.; Dharmadhikari, G.; Van Den Born, M.; Van Es, J.; Jansen, E.; Clevers, H. De Novo Prediction of Stem Cell Identity Using Single-Cell Transcriptome Data. Cell Stem Cell 2016, 19, 266–277.
- Muraro, M.; Dharmadhikari, G.; Grün, D.; Groen, N.; Dielen, T.; Jansen, E.; Vangurp, L.; Engelse, M.; Carlotti, F.; Dekoning, E.P. A Single-Cell Transcriptome Atlas of the Human Pancreas. Cell Syst. 2016, 3, 385–394.e3.
- Lawlor, N.; George, J.; Bolisetty, M.; Kursawe, R.; Sun, L.; Sivakamasundari, V.; Kycia, I.; Robson, P.; Stitzel, M.L. Single-Cell Transcriptomes Identify Human Islet Cell Signatures and Reveal Cell-Type–Specific Expression Changes in Type 2 Diabetes. Genome Res. 2017, 27, 208–222.
- Baron, M.; Veres, A.; Wolock, S.L.; Faust, A.L.; Yanai, I. A Single-Cell Transcriptomic Map of the Human and Mouse Pancreas Reveals Inter- and Intra-Cell Population Structure. Cell Syst. 2016, 3, 346–360.e4.
- Wang, Y.J.; Schug, J.; Won, K.J.; Liu, C.; Naji, A.; Avrahami, D.; Golson, M.L.; Kaestner, K.H. Single-Cell Transcriptomics of the Human Endocrine Pancreas. Diabetes 2016, 65, db160405.
- Villani, A.-C.; Satija, R.; Reynolds, G.; Sarkizova, S.; Shekhar, K.; Fletcher, J.; Griesbeck, M.; Butler, A.; Zheng, S.; Lazo, S.; et al. Single-Cell RNA-Seq Reveals New Types of Human Blood Dendritic Cells, Monocytes, and Progenitors. Science 2017, 356, eaah4573.
This entry is offline, you can click here to edit this entry!