1. Multiscapes on an Urbanising Planet
Multiscapes exist on an urbanising planet and will increasingly be influenced by urbanisation. By 2050 it is projected that more than two-thirds of the world population will live in urban areas [
23,
24]. By the end of this decade, populous nations, such as Argentina, Brazil, South Korea and Venezuela, will be more than 90% urban; Colombia, Mexico, The Philippines and Turkey will be above 75% [
25]. This influx of population to cities could imply a lessening of urban presence in rural multiscapes. However, both the social-economic and the physical spheres of urban influence are growing outwards. The physical extents of cities across all population scales are expanding faster than their population rates [
14,
26]. ‘Budding outward’ is the dominant typology of urban expansion worldwide [
27]. The outward budding is not perfectly centrifugal but more like a diffuse asymmetry of conversion and fragmentation of rural hinterlands [
28]. The space-filling characteristic of urban sprawl is also lateral, infilling as smaller centres are subsumed [
28,
29], and centripetal, with around a quarter of the world’s urban population aggregating in slums and informal peripheral settlements [
30].
Most forms of urban expansion are correlated by default with unsustainability in terms of greater energy consumption, air and water pollution, loss of natural habitats and loss of ecosystem services [
4,
31,
32,
33]. In general terms also, urban expansion is predominantly periurban expansion [
26], and consequently, periurban landscapes bear the burden of these negative impacts [
26,
34]. Historically, cities have been located either in lands of high productivity or alternately as places to control logistical flows to and from areas of high production or to defend areas of high production [
35]. The consumption of productive land by urban expansion is discussed widely [
36,
37,
38,
39,
40,
41]. However, the net impact on the regulating ecosystem services supplied by periurban areas (such as flood protection, microclimate regulation, water filtration, waste decomposition, nutrient recycling and pollution mitigation) that are critical to urban survival is less tangible than provisioning services (such as food production), and therefore, less discussed [
13,
15,
42,
43].
Alongside the increasing significance of the periurban zone globally, in terms of its physical size, its human population and its ecological impact, the definition of what is considered to be periurban is also changing [
44]. Traditionally an urban/periurban/rural trichotomy may have been perceptible, but this buffer zone functionality has now essentially dissipated, with periurban multiscapes now broadly described in terms of a spatial and temporal continuum spanning the entire rural to urban spectrum [
45,
46,
47,
48] (
Figure 1a). This continuum is highly transitory and heterogeneous, so much so that distinct biophysical, morphological and socioeconomic contrasts between urban and non-urban lands are becoming less discernible and less relevant [
49,
50,
51,
52]. The following sections will address gaps in the four research fields of ecological urbanism, landscape ecology, ecosystem services science and agroecology that are revealed when they individually converge on this periurban continuum. We suggest that a number of these gaps are addressed when agroecology is reconsidered as a spatial mechanism, which in turn involves novel synthesis of these fields. For instance, we submit that neither ecological urbanism nor landscape ecology has yet to adequately recognise agriculture’s potential as a mechanism for supplying regulating ecosystem services. Regarding ecosystem services science, recent research into ecosystem services supply and demand has focussed on the composition of landscapes generating ecosystem functions, but not yet the role played by landscape configuration. Similarly, research into agroecological systems has identified the spatial properties of ES Density and ES Plasticity but has yet to either combine them or consider them as a spatial planning mechanism.
2. Ecological Urbanism and Landscape Ecology
As their names indicate, ecological urbanism and landscape ecology are branches of the ecological paradigm applied to human settlements and their hinterlands since the turn of the twentieth century. The major figures of twentieth-century urban theory—Howard, Geddes, Leopold, Mumford and McHarg [
53,
54,
55]—are also influential on landscape ecology theory. This review notes, however, that no specific reference is made to agriculture as an ecosystemic actor throughout the entire evolution of this paradigm. Notwithstanding this, a summary of the evolution of these two disciplines remains relevant to understanding agroecology’s potential future ecosystemic role in periurban multiscapes.
The separate scientific disciplines of ecological urbanism and landscape ecology emerged in the early 1950s, and the subsequent development of each discipline reflects the evolution of ecological sciences since the middle of the twentieth century [
56] (
Figure 1b). They began as subdisciplines of ‘ecology’ in the original, purely biological sense, namely, as the study of relations between organisms and their environment [
57]. By the end of the twentieth century, both disciplines had departed from mechanistic and reductionist visions of reality, resulting in new understandings of the biosphere and human inhabitation of it [
12,
58]. Similarly, in both disciplines, the concept of ecosystems existing in a state of equilibrium has progressed to acknowledge a new reality of heterogeneous systems that operate in states far removed from equilibrium [
29,
59,
60,
61]. These parallel trajectories, from linear/dualistic thinking towards a systemic approach, have brought them to present research themes that are relevant to the development of a synoptic urban/rural methodology for analysis of, and intervention into, periurban multiscapes.
The evolution of ecological urbanism is divided by Pickett et al. (2016) into three main paradigms: (1) ecology in the city; (2) ecology of the city; and (3) ecology for the city [
56,
62]. Ecology in the city emerged in the 1950s, its name derived from a scientific focus on non-human enclaves existing within the urban matrix [
63]. Urban areas, in general, were shunned by ecologists for most of the twentieth century [
4], reflecting the prevailing binary distinction between cities and nature and between human and ‘natural’ ecosystems [
63]. While the habitat types chosen for ecological study, such as urban forests, parks, cemeteries, wastelands, streams and wetlands, reflect the diversity of ecologies within cities, they were usually analogous to those outside of cities in terms of natural homogeneity [
56]. Ecology of the city emerged in the 1980s and represented a significant shift in the understanding of urban heterogeneity (and, by extension, periurban heterogeneity). Where ecology in the city studied ecosystems occurring in cities in comparison with other environments, ecology of the city looked at these ecosystems as integral parts of their surroundings while acknowledging humans as components of these ecosystems [
64]. Cities and their aggregate internal and external parts were read as ecosystems in and of themselves, which could be analysed with the same parameters of measurement and on the same terms as natural ecosystems [
52]. It was established that the spatial heterogeneity of urban ecosystems plays a key role in their overall ecological function [
65,
66]. Translated to the periurban context, urban sprawl became understood as a human–natural phenomenon: a complex adaptive system comprising socioeconomic functions (real estate markets, commercial and cultural activity and transportation infrastructure) and biophysical, morphological factors (regional climate, hydrology and topography) [
67]. Ecology of the city also recognised that the components within this complex adaptive system could themselves be complex coupled human–natural elements [
42]. In periurban multiscapes, such coupled ecosystems include agroecological farming systems, along with buildings and sealed surfaces, infrastructure, waterways, parks, forests and gardens, all of which can be considered potential drivers of ecosystem structure and function.
Ecology for the city emerged in the 1990s from an ethical realisation that for ecological urbanism to be of greatest use, it must extend beyond the analysis of ecology of the city and develop methods for sustainable intervention [
56]. Highlighting the significance of periurban multiscapes, Alberti (2016) asks if ‘the emerging patterns of urban agglomeration affect the probability that we will cross thresholds that will trigger abrupt changes on a planetary scale?’ [
59]. This new impetus for design intervention, a so-called ‘design-ecology nexus’, introduces a further level of complexity [
68]. It asserts that the manipulation of settlement patterns (i.e., periurban morphology, land use distribution and connectivity) can influence ecosystem dynamics and their ecological resilience [
69]. The design-ecology nexus, as described by Alberti, focuses on novel coupled human–natural systems, citing emerging evidence that the unprecedented speed and complexity of environmental change driven by urbanisation can lead to unprecedented eco-evolutionary changes over a relatively short timescale [
59]. This challenges the default correlation of urbanisation with unsustainability; instead, potential new ecological patterns, processes and functions emerging from coupled human–natural systems, such as agroecological systems, could have significant positive implications for ecological and human well-being.
In summary, ecological urbanism, and in particular ecology for the city, provide a basis for understanding periurban multiscapes as complex adaptive coupled human–natural systems. This presents the potential for new and positive ecological patterns, processes and functions to emerge from this fabric. In parallel, landscape ecology has developed a comprehensive range of quantitative tools, or ‘landscape metrics’, with which to analyse and engage with the spatial configuration of these systems and ecological processes [
70,
71].
Landscape ecology’s original 1950s definition aimed to understand the functional correlation between landscape features and their numerous ecological interdependencies [
72]. Although a relatively young discipline, it has since diversified into a wide spectrum of research agendas, which Kirchhoff et al. (2012) identify as ranging from social sciences to various subdisciplines of ecological science in its original, purely biological sense [
57]. As we are primarily interested in the spatial design of periurban multiscapes, the focus is placed on the brand of highly quantitative, pattern-process oriented landscape ecology that has developed mainly in the United States [
73]. Seminal to this branch of landscape ecology was Forman and Godron’s (1981) paper, which conceived the terms ‘patch, corridor, and matrix’, establishing a paradigm that remains near uniformly applied across this field of work and forms the basis for most landscape metrics [
74,
75] (see
Figure 2). Landscape metrics are intended not just as tools for analysis, but also as tools for intervention, aligning with a fundamental premise of landscape ecology set out by Wiens (1995) that ‘the explicit composition and spatial form of a landscape mosaic affect ecological systems in ways that would be different if the mosaic composition or arrangement were different’ [
76]. In other words, the manipulation through the design of landscape patterns occurring in periurban multiscapes will result in changes to ecosystem function, which might also be described as a ‘design-ecology nexus’.
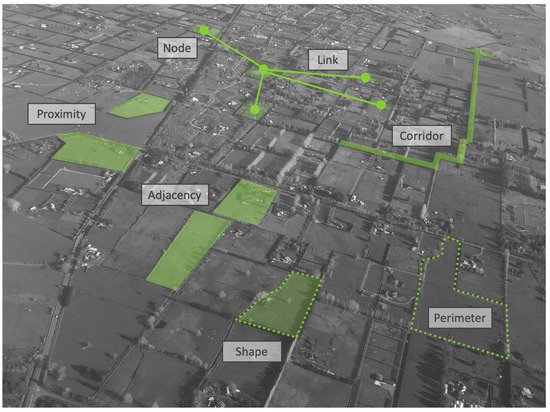
Figure 2. Illustration of the ‘patch, corridor and matrix’ concept applied to a periurban area. Examples of spatial configurations analysed by landscape metrics are shown, as well as the essential components of connectivity metrics (nodes and links). Image courtesy of the authors.
Landscape metrics are widely used to describe the patterns of landscape mosaics and their relationship to land use/land cover (LULC), biodiversity distribution, ecological processes and ecosystem functions [
28,
77]. Such mosaics are largely shaped by the ecosystem services demanded by society [
78,
79], the edges of human-made mosaics prevalent in periurban multiscapes being characterised by a strong contrast between patches and long, simplified edges, in contrast with the complex and convoluted edges occurring in nature [
80]. There is now widespread use of LULC designations as proxies for ecosystem services [
81], although significant research into testing and understanding such correlations remains [
82].
Landscape metrics have been divided by Turner and Gardner (2015) into the four groups—spatial configuration metrics, connectivity metrics, fractals and surface metrics [
74]. The two closely linked concepts—spatial heterogeneity and scale multiplicity—recur across all four of these groups [
60,
83,
84]. Wu et al. (2000) assert that spatial heterogeneity is the most fundamental characteristic of all landscapes—fundamental to ecosystem processes, redundancy and resilience [
85,
86]. Such processes operate on a wide range of scales (i.e., paddock, farm or multiscape), and their characteristics are markedly associated with the specific scale being assessed [
60,
87]. Thus, analysis across a range of scales is imperative for understanding the structure, function and dynamics of landscapes [
88]. The first two groups of landscape metrics are based on the categorical classification of landscape data, i.e., discrete, spatio-temporally static landscape elements (
Figure 2). However, even with high-resolution LULC data, these two-dimensional approaches are sub-optimal for representing the complex reality of periurban mosaics [
45,
51,
75]. As well as being static representations of what is essentially a dynamic environment, they effectively bypass the complex processes occurring within each discrete landscape element. This includes the coupled human-nature interactions identified in ecology of the city. Consequently, this also precludes the potential to analyse and intervene in the co-evolution of the novel, and potentially beneficial, systems as suggested by ecology for the city. Nevertheless, certain landscape metrics from the first two groups remain relevant to analysis and intervention into periurban multiscapes. A range of spatial configuration metrics, for instance, that address ‘aggregation’ look at the dispersion and interspersion of different patch types [
89]. Contagion (or the ‘clumpiness’ or dispersed pattern of LULC types) is an index demonstrated to be effective at representing overall landscape change [
74,
90]).
The third category, fractals, which comprise naturally-occurring self-replicating patterns across a range of scales have been suggested as an alternative to describe natural landscape heterogeneity [
80]. Laca (2021) has applied fractals to the analysis of foraging behaviour [
91], building on established correlations between fractal configurations and biodiversity. By reversing this model and designing fractal-like spatial configurations of ecological communities, Laca hypothesises that ecological functions could be channelled to deliver specific ecosystem services [
91]. Extending this hypothesis, the concept of spatial agroecology we are proposing asks if the spatial configuration of LULC, achieved by leveraging agroecology’s ES Density and ES Plasticity, could be used to deliver specific ecosystem services demanded by periurban multiscapes.
The fourth category, surface metrics, utilises changes in landscape texture to analyse the more continuous (rather than categorical) heterogeneity characteristic of periurban multiscapes. McGarigal and Cushman (2005) introduced the ‘landscape gradient’ model, a general conceptual model of landscape structure based on continuous rather than discrete spatial heterogeneity [
92]. In this model, the underlying heterogeneity is viewed as a three-dimensional surface that can be used to represent any ecological attributes of interest [
92]. Drawing from metrology (the study of surfaces derived from the field of structural and molecular physics), key surface metrics include surface roughness, the shape of the surface height distribution, angular texture and radial texture [
89]. However, a clear correlation between surface metrics and ecosystem functions are yet to be proven, and their potential for generating new insights about pattern-process relationships remains to be determined [
93,
94].
In summary, ecological urbanism and landscape ecology each contribute to the understanding of agroecology’s role in the spatial analysis of and design intervention into periurban multiscapes. The most evolved form of ecology for the city is useful for the diagnosis of complex coupled human–natural systems that typify the periurban zone. Landscape ecology, on the other hand, has a range of quantitative tools that can be utilised to detect correlations between the configuration of these systems and ecosystem performance. Although most landscape metrics are limited by their static analysis of landscapes, they have not been extensively applied to the field of ecosystem services science, which is detailed next. As will be discussed, these static measures, along with the development of the two approaches of fractals and metrology, may have significant relevance when the supply and demand of ecosystem services is quantified, correlated to LULC and then precisely mapped across periurban multiscapes.
3. Ecosystem Services Science
Ecosystem services science gained significant momentum and prominence following the publication of the UNEP’s Millennium Ecosystem Assessment (MEA) in 2005, which categorised ecosystem services into four broad types—provisioning, regulating, cultural and supporting [
95]. To avoid ‘double-counting’, these are commonly reduced to three ‘final’ services—provisioning, regulating, cultural [
96]—contributing to human welfare through a supply of natural goods (provisioning), the control of material and energy flows towards a reduction in natural hazards (regulating) and by opportunities of (cultural) experiences in connection with nature and landscape [
97]. The MEA was preceded by Daily’s seminal text (1997) that comprehensively set out the range of ecosystem services and highlighted human reliance on them [
15]. Critically, Daily identifies regulating and supporting ecosystem services, which are critical for life on Earth, as ‘pervasive and yet virtually unknown by most humans’ [
15]. As we noted earlier, such inconspicuous services (including flood protection, microclimate regulation, water filtration, waste decomposition, nutrient recycling and pollution mitigation), so critical for adaptation to future environmental challenges, are generally overlooked when periurban land-uses are only studied at myopic, coarse scales [
42].
Ecosystem services in this way represent the critical interface between human, natural and hybrid human/natural systems—an interplay between the ecosystem diversity and human activity [
98]. Following the MEA, ecosystem services science developed around the analysis of this interplay, around ecosystem biodiversity and functionality, and the concept of ecosystem services trade-offs [
99]. Ecosystem services trade-offs occur where increases in one ecosystem service or human activity typically result in either the enhancement or the reduction of other ecosystem services [
100,
101]. To achieve more ecosystem services synergies and reduce ecosystem services conflicts, the relationships between corresponding multiple ecosystem services and the mechanisms behind these relationships has emerged as critical to the management of sustainable landscapes [
102,
103,
104]. Seminal research into multiple ecosystem services by Bennett et al. (2009) and Raudsepp-Hearne et al. (2010) observed that certain groups of ecosystem services appear together consistently, introducing the term ‘ecosystem services bundles’ [
102,
104]. For example, Yang et al. (2015) surveyed twelve ecosystem services across twenty-two urban-rural systems. Among the supply bundles emerging were consistent synergies between carbon sequestration, soil protection, water conservation and forest recreation [
105] (i.e., between regulating and cultural ecosystem services). A quantitative review of ecosystem bundles, in particular, underlines a recurrence of synergies between regulating ecosystem services, showing consistent correlations between habitat protection, climate and atmosphere regulation, pest and disease control, soil quality and water quality [
106].
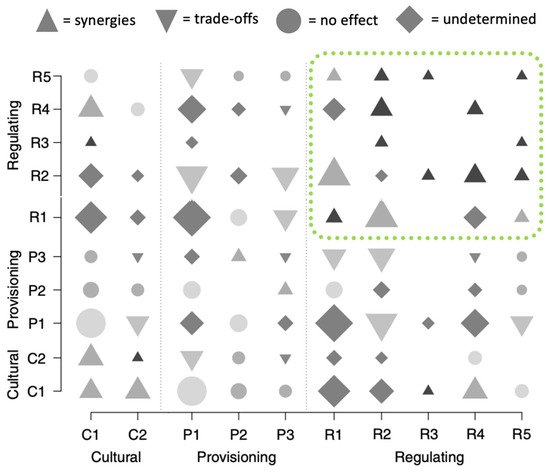
As can also be seen from this table (
Figure 3), ecosystem service bundles may refer to arrangements that result in either trade-offs or synergies. It is worth noting that in such bundles, the improvement of regulating ecosystem services generally correlates with the enhancement of provisioning and cultural ecosystem services [
102,
104] and that negative trade-offs rarely occur between regulating ecosystem services [
107]. Conversely, focus on the enhancement of provisioning ecosystem services (such as food production) generally correlates to the diminishing of regulating and cultural ecosystem services [
104]. For example, external inputs utilised to increase provisioning ecosystem services (e.g., livestock or crop yield) decrease the flow of regulating services (e.g., pest control, pollination, water flow regulation, carbon storage) [
8]. As will be developed further below, it is agroecological systems’ capacity to provide bundles of ecosystem services synergies, based on a prioritisation of regulating ecosystem services and with the relative spatial economy, which underpins a new role for farming in periurban multiscapes. The context for this new role for farming is framed by two recent developments in ecosystem services. The first is the concept of Ecosystem Services Space (ES Space), and the second is the development of spatially explicit mapping of periurban ecosystem services supply and demand.
Figure 3. ES trade-off analysis from 67 case studies, showing the empirical pattern of relationships between them. The size of the symbol indicates the square root-scaled number of studies. Of note are the prevalent synergies between regulating ecosystem services. C1: Physical and experiential interactions. C2: Intellectual and representative interactions. P1: Nutrition biomass. P2: Nutrition water (i.e., drinking purpose). P3: Materials biomass (e.g., for production and agricultural uses). R1: Atmospheric composition and climate regulation. R2: Life cycle maintenance, habitat and gene pool protection. R3: Pest and disease control. R4: Soil formation and composition. R5: Water filtration. Adapted from Lee, H. and Lautenbach, S. (2016). A quantitative review of relationships between ecosystem services. Ecological indicators, 66, 340-351.
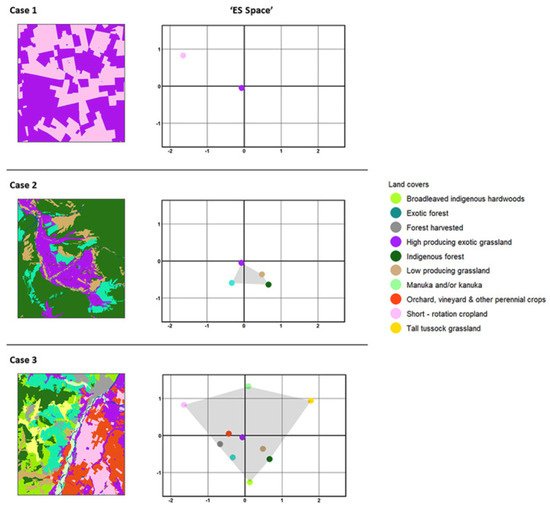
The concept of ES Space developed by Gomez-Creutzberg et al. (2021) involves hypothetically visualising the cumulative ecosystem services as supplied by all LULC within a given landscape [
108]. Applying ordination analysis, it locates LULC that supply similar services closer to each other in ES Space than those that supply different services [
108] (
Figure 4). Their research concludes that there is an optimum balance between the amount of land cover heterogeneity and the spatial distribution of LULC providing ecosystem services. With too much heterogeneity, the loss or significant disruption of one of these LULC (along with its associated ecosystem services) degrades the overall resilience of the landscape. Conversely, a landscape comprising larger extents of land covers supplying complimentary multiple ecosystem services provides a high redundancy of these services, and hence, increased resilience [
109]. Darnhofer et al. (2010) make explicit reference to agroecosystems’ capacity to provide this redundancy and hence a buffering capacity to natural and human-made disturbances [
110]. We propose that when utilised in coordination with landscape metrics, ES Space could potentially guide the proportionality of land covers to generate specific ecosystem service redundancy and, therefore, optimum resilience [
111].
Figure 4. Hypothetical visualisations that explore trade-offs in the supply of multiple ecosystem services depending on the level of LULC heterogeneity across entire landscapes. • Case 1—a landscape with few, undifferentiated production land covers. • Case 2—a landscape with a medium combination of land covers. • Case 3—a landscape with a broad range of land covers that supply a diverse range of services. LULC mapping (left) is translated to ordination graphs (right), indicating a complementarity of ecosystem services supply bunched together and contrasting sets of ecosystem services set far apart. Complementarity equates to the redundancy of ecosystem services supply and, therefore, resilience. From Gómez-Creutzberg, C et al. (2021). Consistent trade-offs in ecosystem services between land covers with different production intensities. Biological reviews of the Cambridge Philosophical Society, 96(5).
Emerging in the late 1990s with the development of Geographic Information Systems (GIS) [
112], ecosystem services mapping has recently begun to shift from identifying only areas of ecosystem services supply (as applied in the ES Space concept), to matching ecosystem services supply with ecosystem services demand [
91,
113,
114]. Cortinovis and Geneletti (2020) utilise ecosystem services supply and demand mapping to inform a performance-based planning strategy for periurban multiscapes [
115]. The type of performance (i.e., what ecosystem services should be provided) depends on ecosystem service demand, which also dictates the quantity of ecosystem services to be supplied [
116,
117]. Additional supply is also needed to replenish ecosystem service sources depleted by urban expansion and conventional agricultural production pressures, for example, by increased soil sealing, diminished canopy coverage, fragmentation of valuable habitats and contamination of natural resources [
115,
118,
119].
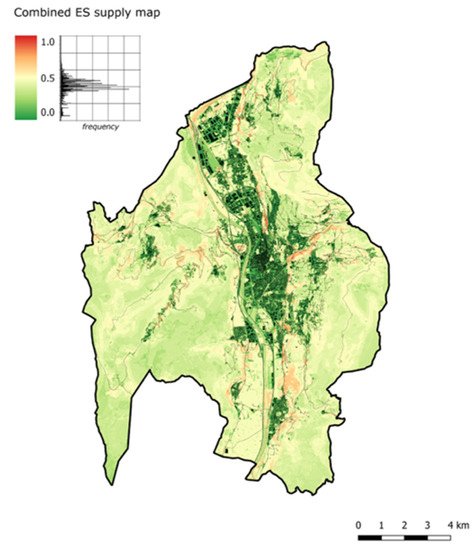
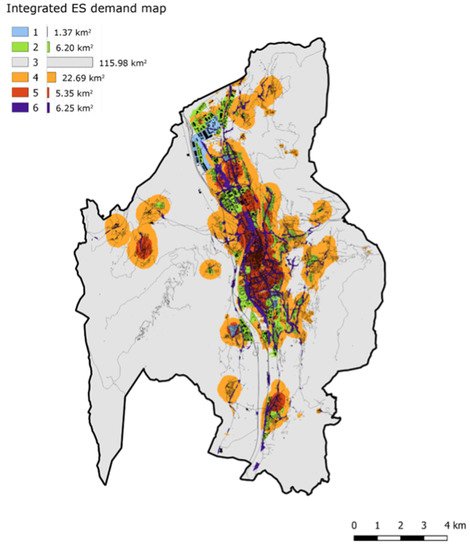
Cortinovis and Geneletti demonstrate their supply and demand process with a ‘combined ecosystem services supply map’ (
Figure 5) and an ‘integrated ecosystem services demand map’ [
115] (
Figure 6). As well as the periurban context of their research, the explicit delineation of respective sources and sinks of ecosystem services is of clear relevance to the spatial application of agroecology. For example, cluster analysis is used to map specific ecosystem service requirements to explicit locations, thus representing ES demand in a more explicit way than simply referring to population density maps [
115]. The supplied ecosystem services assessed (as well as their indicators and calculation method) are set out in
Table 1.
Figure 5. The ‘combined ES supply’ map summarises the results of the seven individual assessments of ES supply. In the centre of the map is a major town, set in a valley. Urbanised areas with little or no vegetation are clearly visible on the map as characterised by the lowest values of the indicator (in dark green). The map indicates highlights that the critical supply areas (in red) are located in the periurban zones branching out from the centre. These correspond to urban parks, protected areas and remnants of forests. From Cortinovis, C. and Geneletti, D., A Performance-based Planning Approach Integrating Supply and Demand of Urban Ecosystem Services. Lands. Urban Plan., 2020. 201: p. 103842.
Figure 6. The ‘integrated ES demand’ map indicates six clusters characterised by similar ecosystem service demand profiles. Individual demand maps were informed by two factors: (1) the intensity of hazard (in the case of regulating services) or level of deprivation (in the case of provisioning and cultural services) and (2) the amount of population exposed to that condition, and consideration of different vulnerability levels. The characteristic requirements of each cluster are as follows: 1. High demand for runoff mitigation—mainly industrial or high-density residential areas with a high degree of soil sealing. 2. Relatively high demand for runoff mitigation and above-average demand for microclimate regulation, food supply and recreation—mainly residential areas with low levels of green space. 3. Non-urbanised areas, so very-low or no demand for the analysed ES. 4. Periurban areas —mostly non-urbanised areas or low-density residential neighbourhoods. These are characterised by a higher-than-average demand for microclimate regulation, recreation and food supply. 5. Main residential areas with a medium to high density, which have the highest demand for microclimate regulation, recreation, and food production. 6. Noise regulation specifically required by residential areas close to transport infrastructure. From Cortinovis, C. and Geneletti, D., A Performance-based Planning Approach Integrating Supply and Demand of Urban Ecosystem Services. Lands. Urban Plan., 2020. 201: p. 103842.
Table 1. Ecosystem services assessed in Cortinovis and Geneletti (2020), including indicators and calculation methods [
115].
| Ecosystem Services |
Indicators |
Calculation Method |
| Microclimate regulation (cooling) |
Cooling capacity of green infrastructure |
Spatial modelling |
| Habitat provision |
Relative richness of focal species |
Ecological modelling |
| Nature-based recreation |
Recreation Opportunity Spectrum |
Spatial modelling |
| Noise mitigation |
Reduction of traffic noise at selected receivers (residential buildings) |
Spatial modelling |
| Air purification |
PM10 deposition |
Proxy based on vegetation typology and distance from main sources |
| Runoff mitigation |
Runoff avoided due to infiltration |
Proxy based on the share of permeable areas |
| Food provision |
Land suitability for agriculture |
Proxy based on current crop typology and suitability to agricultural use |
Using spatial ecological modelling and the use of proxy LULC geometries, individual supply maps indicate the areas generating ecosystem services required by the urban area being studied [
120,
121]. The ecosystem services assessed are first illustrated on their own individual maps, with map pixels colour coded by a scale ranging from 0 to 1 indicating how much of the respective service they supply. To create the combined ecosystem services supply map, the individual maps are overlaid, their respective services summed and rescaled again to a 0–1 range.
We mentioned earlier the sub-optimality of mapping LULC in only two dimensions. For example, Zhou et al. (2017) discuss the limitations of applying analogue (ecology in the city) LULC approaches to the mapping of hybrid human–natural (ecology of the city) systems [
51] and Inostroza et al. (2019) highlight the constraints of applying two-dimensional metrics to the analysis of the tetra-dimensional (three spatial dimensions plus time) periurban zone [
50]. Nevertheless, two-dimensional supply/demand mapping provides useful data when the grain and extent of the mapping are aligned with the desired scale required by the analysis [
1]. Cortinovis and Geneletti do draw attention to the practical limitations of scaling ecosystem service supply and demand values to a common range [
115]. However, their study provides a framework to assess, in a spatially explicit manner, the location, quantity and type of ecosystem service supply and demand for a real-world periurban multiscape.
If such quantitative correlations between different LULCs and the supply of different ecosystem services can be established (as suggested by Laca, above), we suggest that ES Space theory could be used to compare how different spatial configurations of LULC deliver various services (
Figure 1c). Gomez-Creutzberg et al. contend that no single land cover is a jack-of-all-trades, providing an optimal level of all ecosystem services [
122]. As will be set out in the next section, we suggest agroecology because it consists of a functional arrangement of multiple land uses and landcovers within the same discrete spatial area, classified as a separate LULC class. We further suggest that spatial agroecology—the spatial configuration of these spatially discrete agroecological units (as well as modulations of farm operations occurring within these components)—can perform an ecosystemic jack-of-all trades role supplying ecosystem services tailored to what is required and with a high degree of spatial efficiency.