Your browser does not fully support modern features. Please upgrade for a smoother experience.
Please note this is an old version of this entry, which may differ significantly from the current revision.
Pancreatic ductal adenocarcinoma (PDAC) is the most common and aggressive type of pancreatic cancer (PCa) with a low survival rate. microRNAs (miRs) are endogenous, non-coding RNAs that moderate numerous biological processes. miRs have been associated with the chemoresistance and metastasis of PDAC and the presence of a subpopulation of highly plastic “stem”-like cells within the tumor, known as cancer stem cells (CSCs).
- pancreatic ductal adenocarcinoma
- microRNAs
- non-coding RNAs
- cancer stem cells
- metastasis
- epithelial–mesenchymal transition
1. Introduction
Pancreatic ductal adenocarcinoma (PDAC) is the eighth primary source of cancer-related deaths globally with a 5-year survival rate of 3–6% [1][2][3][4]. Approximately, 10–20% of PDAC patients are compatible for surgery at the time of diagnosis, and 9.7% of PDAC cases are at a local stage when initially diagnosed [5]. microRNAs (miRs) are 18 to 24 nucleotides-long, endogenous, non-coding, evolutionarily conserved, single-stranded RNA molecules. miRs can moderate gene expression at the posttranscriptional level through the binding to the complementary sequences of their target mRNAs at the 3′ untranslated regions (UTRs), which allow them to control the expression levels of several genes and regulate various signaling pathways [6][7][8][9]. Preliminary studies have suggested a correlation between aberrant expression levels of numerous miRs with PDAC [10][11][12][13]. miRs can act as oncogenic miRs (oncomiRs) or tumor suppressor miRs. Especially in PDAC, miR-21, miR-155, and miR-221 have been found to act as oncomiRs, while miR-126 and miR-375 were shown to act as tumor suppressors miRs [14][15]. miR-21, miR-221, and miR-155 can distinguish cases of PDAC from healthy individuals with a sensitivity of approximately 64% and a specificity of 89% [16][17]. Importantly, miRs present a higher sensitivity as a diagnostic marker than the current diagnostic marker carbohydrate antigen (CA 19-9), especially for the early diagnosis of PDAC [18][19][20][21].
Cancer stem cells (CSCs) are involved in chemoresistance and play critical roles in the metastasis of several cancers, including PDAC [22][23][24][25][26][27][28][29]. CSCs contribute to elevated expression levels of anti-apoptotic proteins, ABC transporters, and multidrug resistance genes, high autophagic flux that leads to microenvironment stresses [30][31][32][33][34]. Pancreatic CSCs (PCSCs) are less than 1% of all pancreatic cancer cells and are critical mediators of PDAC tumor growth, maintenance, metastasis, and chemoresistance [35]. EMT is characterized as a critical mechanism of the metastatic cascade, which includes the loss of cell adhesion, elevated cell motility, the repression of E-cadherin, and the upregulation of mesenchymal markers, such as Vimentin, N-cadherin, Snail, and Zeb1 [36]. E-cadherin downregulation is associated with poor prognosis, differentiation, and chemoresistance in PDAC [37][38][39][40]. Transcription marker Zeb1 suppresses E-cadherin through the repression of both miR-203 (an inhibitor of stemness) and miR-200 family members, which control the expression levels of stem cell factors [41]. Zeb1 overexpression is linked to advanced PDAC stages and poor malignancy outcome, migration, and invasion in response to nuclear factor kappa-light-chain-enhancer of activated B cells (NF-κB) signaling [42][43][44]. Non-canonical Wnt-11 overexpression is associated with poor prognosis and tumor-node-metastasis (TNM) staging in PDAC [45][46][47][48][49].
Higher expression levels of Snail, a potent EMT-inducing transcription factor, are related to 80% of PDAC cases, E-cadherin downregulation, lymph node invasion, higher tumor grade, and poorly differentiated PDAC cells [50]. EMT is regulated via molecular pathways linked to oncogenic and tumor suppressor non-coding RNAs, chromatin remodeling, epigenetic and posttranslational modifications, alternative splicing events, and protein stability [51][52]. Vimentin is an essential marker of EMT and associated with Notch and miR-200 expression levels and it can affect treatment response in vitro, including elevated gemcitabine-resistance in PDAC [53][54]. Overexpression of Vimentin is linked to metastasis and poor overall survival in PDAC [55][56]. Furthermore, the association between EMT and CSCs has been extensively evaluated, for instance, PDAC cells, which have undergone EMT, and express epithelial markers, such as E-cadherin and mesenchymal markers, such as Zinc Finger E-Box Binding Homeobox 1 (Zeb1), and Snail exhibit stem cell properties [57][58]. The main markers of PCSCs are CD133, CD24, CD44, ESA/EpCAM (epithelial-specific antigen), c-Met, ALDH1, DclK1, CXCR4, and Lgr5 [30][59][60]. Importantly, EMT and autophagy processes are also closely linked with CSCs markers during PDAC development [59][60]. Recent reports stated that CD24, CD44, CXCR4, ESA, and nestin are upregulated in advanced pancreatic intraepithelial neoplasia (PanIN) grades [61], while others have shown that the expression of cMet+ CD133+ CD34+ CD45− Ter119−, Pdx1, CD9, CD24, CD44, CD13, and CD133, are linked to poor prognosis of PDAC [61][62][63][64][65][66][67].
2. MicroRNA-21 Regulates Stemness in Pancreatic Ductal Adenocarcinoma Cells
In summary, using three different PDAC cell lines, the researchers found that miR-21, miR-221, miR-155, and miR-126 expressions were significantly altered in MiaPaca-2, Panc-1, and BxPC3 PDAC cell lines, compared with normal pancreatic ductal epithelial cell lines (HPDE). Following the knockout of miR-21 in Panc-1 and MiaPaca-2 cells using CRISPR-Cas9, reversed expressions of E-cadherin, Vimentin, Snail, Wnt-11, and Zeb1 were detected, suggesting that these markers are targets of miR-21. Expression levels of the CSC markers, such as CD133, CD44, CD24, CXCR4, and ALDH1, were significantly downregulated depending on miR-21 status. KO of miR-21 led to a significant reduction in cellular invasiveness of Panc-1 and MiaPaCa-2 cells and a significant decrease in cellular proliferation of MiaPaCa-2 cells. Overall, the researchers data suggest that miR-21 is involved in the pathophysiology of PDAC.
2.1. Expression Profiles of miR-21, miR-221, miR-155, and miR-126 in PDAC In Vitro
PDAC associated miR-21, miR-155, miR-221, miR-155, and miR-126 expression levels were quantified using RT-qPCR in three different PDAC cell lines (MiaPaCa-2, Panc-1, and BxPC3), compared with human pancreatic ductal epithelial (HPDE), which served as the control cell line. The HPDE cells had the most epithelial properties expressed relatively, with the least miR-21-5p, miR-155-5p, and miR-221-5p and this was used as a ‘baseline’ (Figure 1A–C). Out of the cell lines tested, Panc-1 cells expressed the highest levels of miR-21-5p (117-fold elevation; n = 3; p < 0.0001; Figure 1A), miR-155-5p (105-fold increase; n = 3; p < 0.0001; Figure 1B), and miR-221-5p (32-fold upregulation; n = 3; p < 0.0001; Figure 1C) relatively compared with HPDE cells. Similarly, MiaPaCa-2 cells presented a 43-fold increase in the miR-21-5p (n = 3; p < 0.05; Figure 1A), a 51-fold overexpression in miR-155-5p (n = 3; p < 0.01; Figure 1B) and a 21-fold significant rise in miR-221-5p (n = 3; p < 0.001; Figure 1C). BxPC3 cells did not show significant changes in both miR-21-5p and miR-221-5p expressions (16-fold; 3-fold, respectively; n = 3; p > 0.05 for both; Figure 1A,C), however, they showed a 36-fold significant upregulation in miR-155-5p expression (n = 3; p < 0.05; Figure 1B). The expression levels of miR-126-5p indicated a 57-fold downregulation in BxPC3 cells (n = 3; p < 0.01; Figure 1D), a 81-fold decrease in the MiaPaCa-2 cell line (n = 3; p < 0.001; Figure 1D), and a 94-fold reduction in Panc-1 cells (n = 3; p < 0.0001; Figure 1D) in comparison with normal HPDE cells.
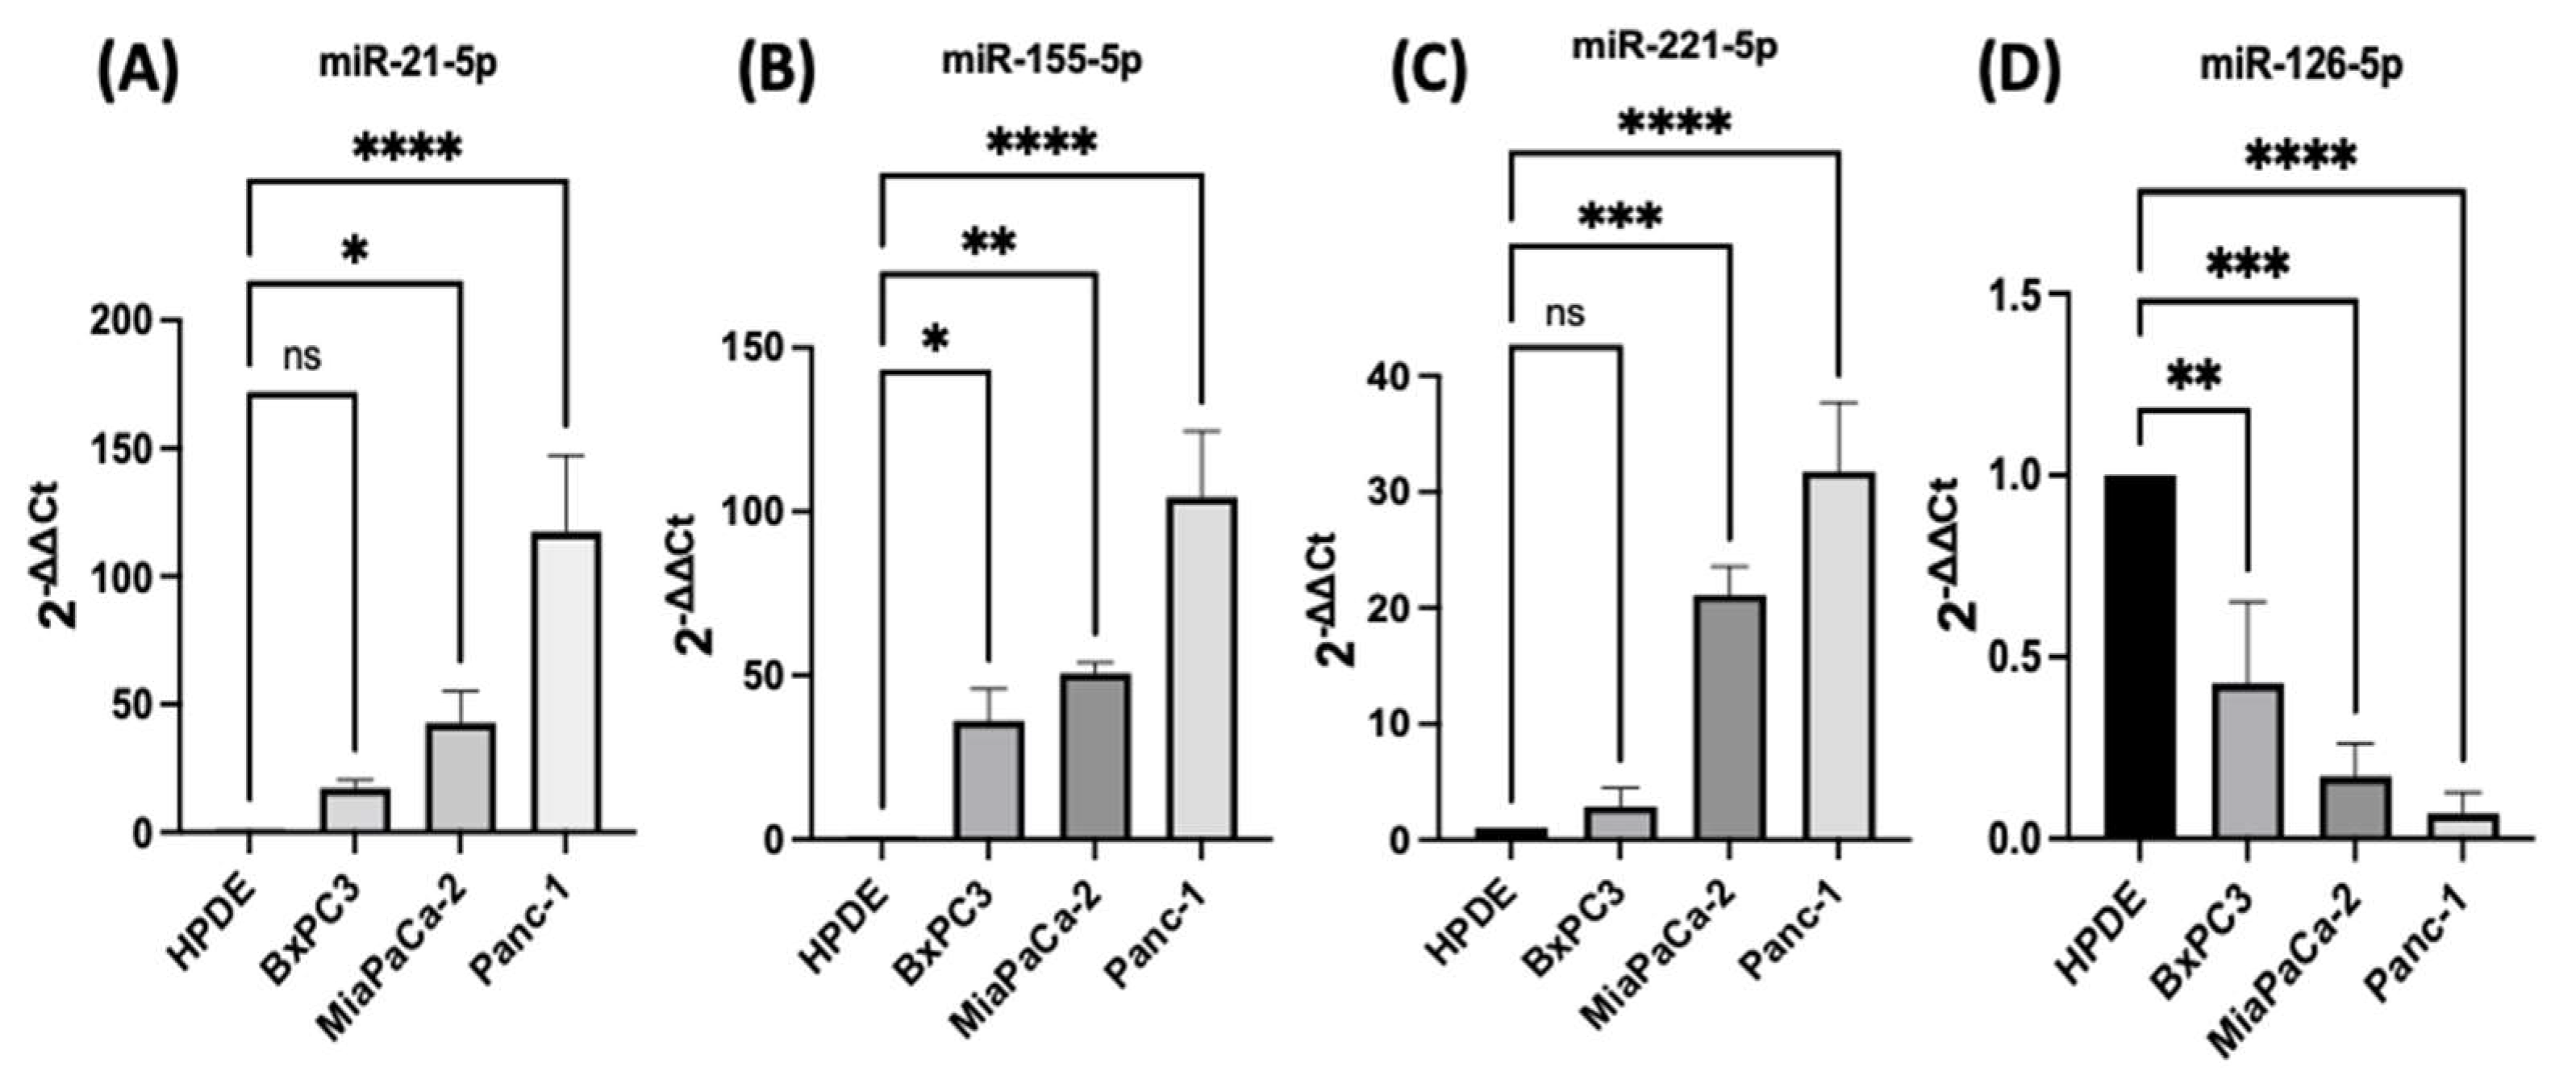
Figure 1. RT-qPCR analysis of miRs levels miR-21, miR-221, miR-155, and miR-126 in PDAC cell lines (BxPC3, MiaPaCa-2, Panc-1, compared with HPDE). (A) miR-21-5p relative expression was significantly increased in MiaPaCa-2 and Panc-1 but not in BxPC3 PDAC cell lines. (B) miR-155-5p relative expression was significantly overexpressed in BxPC3, MiaPaCa-2, and Panc-1 PDAC cell lines. (C) miR-221-5p relative expression was significantly upregulated in MiaPaCa-2 and Panc-1 but not in BxPC3. The column graphic represents the average of three replicates of RNA isolated from each cell line. (D) miR-126-5p relative expression was significantly reduced in PDAC cell lines. The column graphs represent the average of three replicates of RNA isolated from each cell line. Data normalized according to RNU6 expression by fold analysis (n = 3, p < 0.05 for all). p-values are indicated as: * p ≤ 0.05; ** p ≤ 0.01; *** p ≤ 0.001; **** p ≤ 0.0001; error bars indicate standard deviation (SD).
2.2. Development of miR-21 KO MiaPaca-2 and Panc-1 Cell Lines
The researchers qRT-PCR data showed that miR-21 expression was the most elevated in the Panc-1 and MiaPaCa-2 PDAC cell lines correlating with in vivo data. Therefore, both Panc-1 and MiaPaca-2 were used to further investigate the effect of knocking out miR-21, and cells were transduced with four different miR-21 gRNAs, as well as a control vector. miR-21 expression analysis showed that miR-21 expression was significantly reduced by 65 and 73-fold in Panc-1 knockout (KO) clones 2 (KO2) and 4 (KO4), respectively, compared with Panc-1 vector alone (n = 3; p < 0.0001 for all; Figure 2A). Similarly, expression levels of miR-21 were also significantly decreased by 83-fold in KO2 and 97-fold in KO4 (n = 3; p < 0.01 for all; Figure 2B) in MiaPaCa-2. The knockout miR-21 Panc-1 and MiaPaCa-2 PDAC cell lines were further assessed for EMT, and CSC markers and cellular invasion.
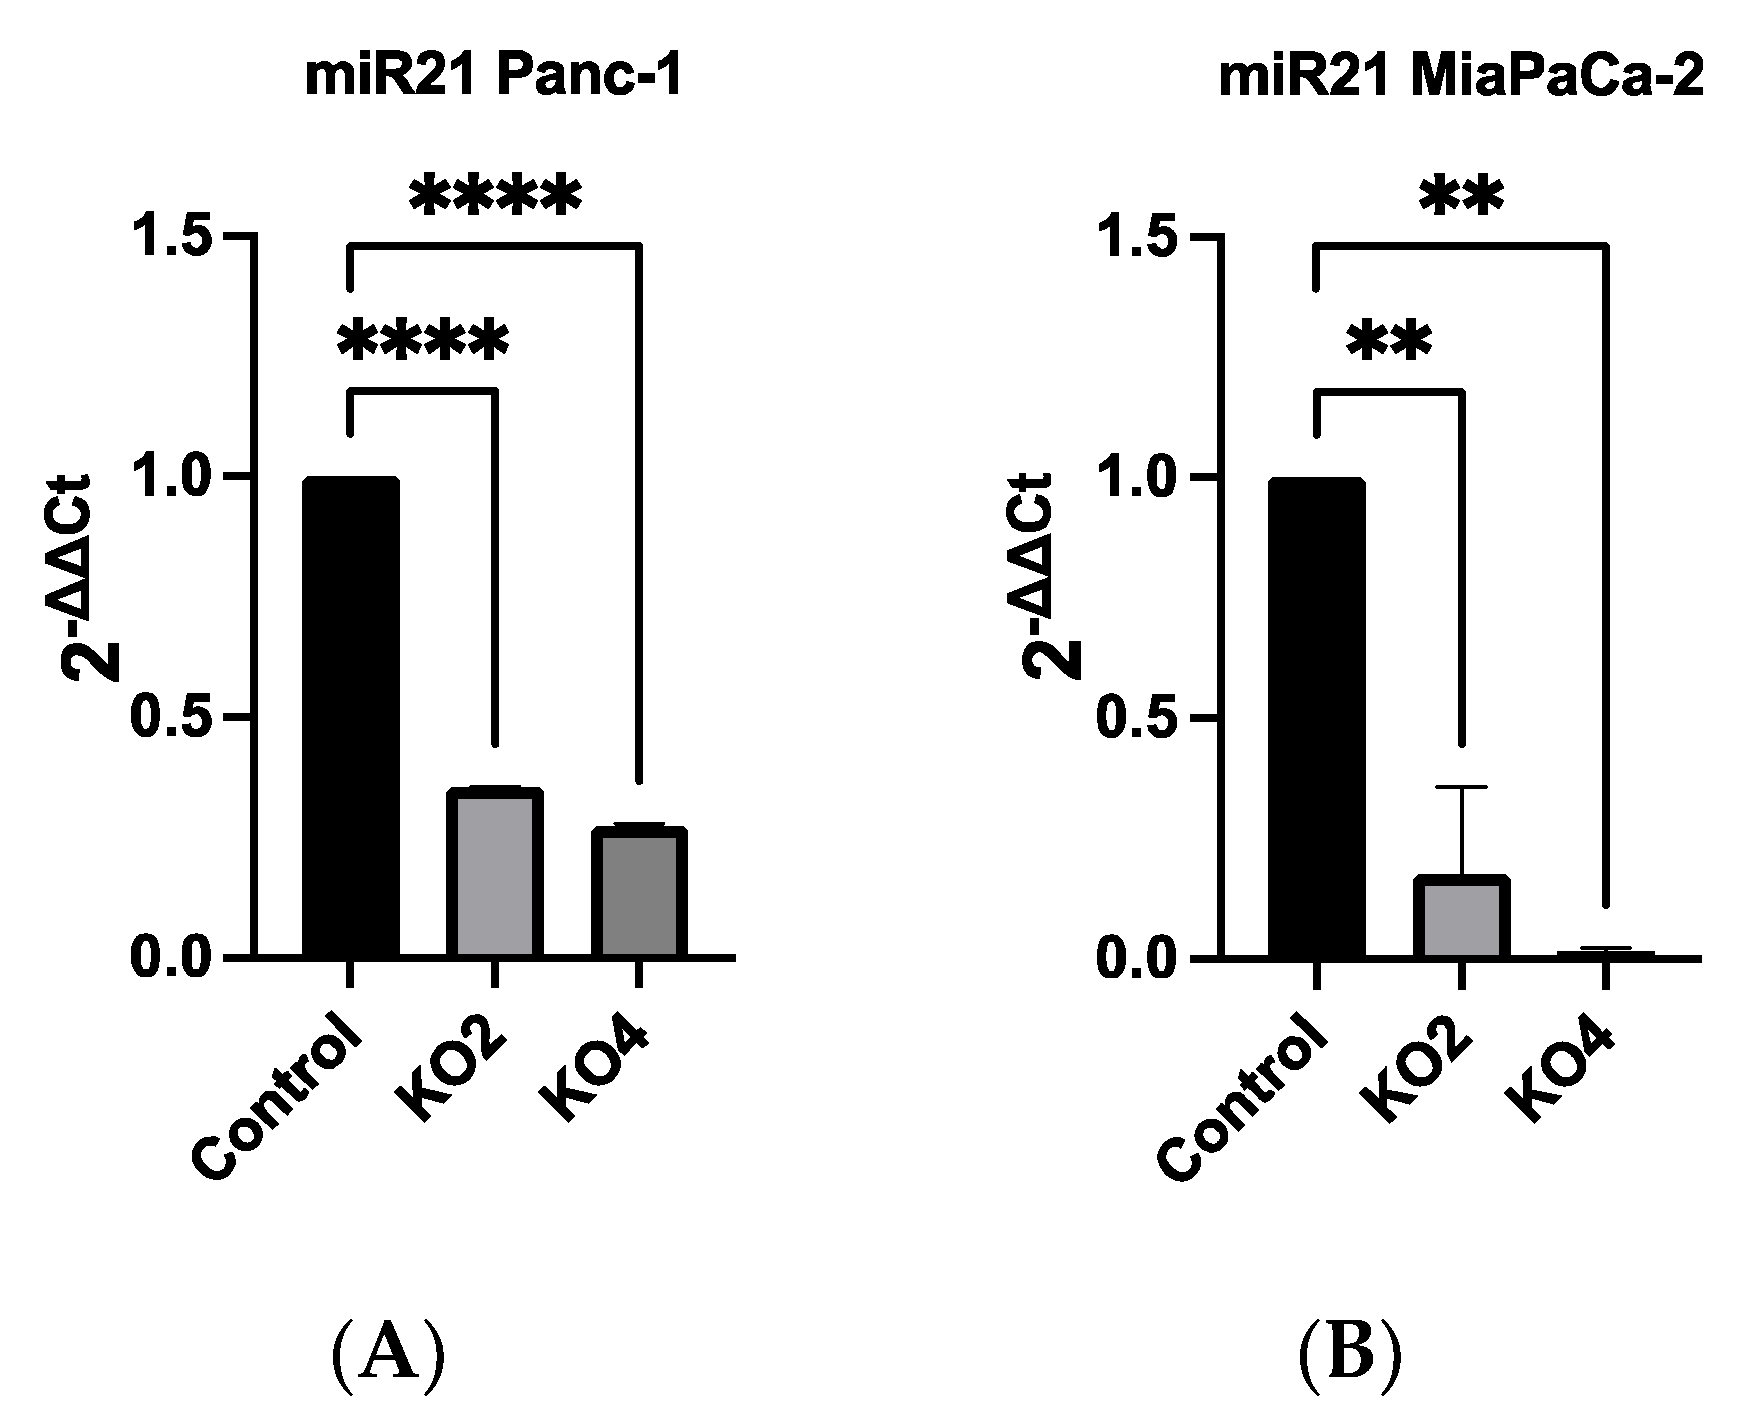
Figure 2. miR-21 expression levels are significantly reduced in Panc-1 and MiaPaCa-2 Kos. (A) Relative expression levels of miR-21 in miR-21 KO Panc-1 cells. miR-21 expression levels of miR-21 knockout clone 2 (KO2) and miR-21 knockout clone 4 (KO4) cell colonies were downregulated significantly compared to untreated control Panc-1 cells (n = 3; p < 0.0001 for all). The column graphic represents the average of three replicates of RNA isolated from the Panc-1 control and its Kos. Data normalized according to RNU6 expression by fold analysis (n = 3, p < 0.05). (B) Relative expression levels of miR-21 in miR-21 KO MiaPaCa-2 cells. miR-21 expression levels of miR-21 knockout clone 2 (KO2) and miR-21 knockout clone 4 (KO4) cell colonies were reduced significantly compared to untreated control MiaPaCa-2 cells (n = 3; p < 0.01 for all). The column graphic represents the average of three replicates of RNA isolated from MiaPaCa-2 control and its Kos. Data normalized according to RNU6 expression by fold analysis (n = 3, p < 0.05). p-values are indicated as: ** p ≤ 0.01; **** p ≤ 0.0001; error bars indicate SD.
2.3. miR-21 Kos Reduce Expression Levels of EMT-Related Markers
The effects of miR-21 KO on regulation of key EMT was assessed using miR-21 KO in Panc-1 and MiaPaCa-2 PDAC cells. E-cadherin mRNA expression levels were found to be significantly overexpressed by 932-fold in Panc-1 miR-21 KO2 and by 906-fold in KO4 (n = 3; p < 0.05 and 0.01, respectively; Figure 3A). Vimentin mRNA levels decreased by 96-fold in KO2 and 99-fold in KO4 (n = 3; p < 0.0001 for all; Figure 3A), whereas Snail mRNA levels were 100-fold reduced in both KO2 and KO4 (n = 3; p < 0.0001 for all; Figure 3A). Zeb1 mRNA expression was reduced by 40-fold in KO2 and by 46-fold in KO4 (n = 3; p < 0.01 for all; Figure 3A) in comparison to the Panc-1 vector alone. The Wnt-11 mRNA expression level was significantly reduced in Panc-1 miR-21 KO4 (58-fold; n = 3; p < 0.05; Figure 3A), but there was not a significant reduction in KO2 (35-fold, n = 3; p > 0.05; Figure 3A). Similarly, in the MiaPaca-2, E-cadherin mRNA levels were significantly upregulated by 349-fold in KO2 (n = 3; p < 0.01; Figure 3B) and by 476-fold in KO4 (n = 3; p < 0.001; Figure 3B). Additionally, vimentin mRNA levels were decreased by 71-fold in KO2 and by 99-fold in KO4 (n = 3; p < 0.01 and 0.001, respectively; Figure 3B), while Snail mRNA levels presented a significant decrease in KO2 (69-fold) and KO4 (80-fold) (n = 3; p < 0.05 for all; Figure 3B). Zeb1 mRNA levels were suppressed significantly by 49 and 77-fold in KO2 and KO4, respectively (n = 3; p < 0.01 and 0.001, respectively; Figure 3B), and Wnt-11 mRNA expression levels reduced in both KO2 and KO4 (57-fold and 49-fold, respectively; n = 3; p < 0.01 for all; Figure 3B). According to immunofluorescence results, E-cadherin was upregulated; Snail and Wnt-11 were downregulated in miR-21 KO clones when compared to control (n = 3; Figure 3C). Overall, the researchers data suggest that miR-21 is involved in EMT through suppressing epithelial characteristics in the cells.
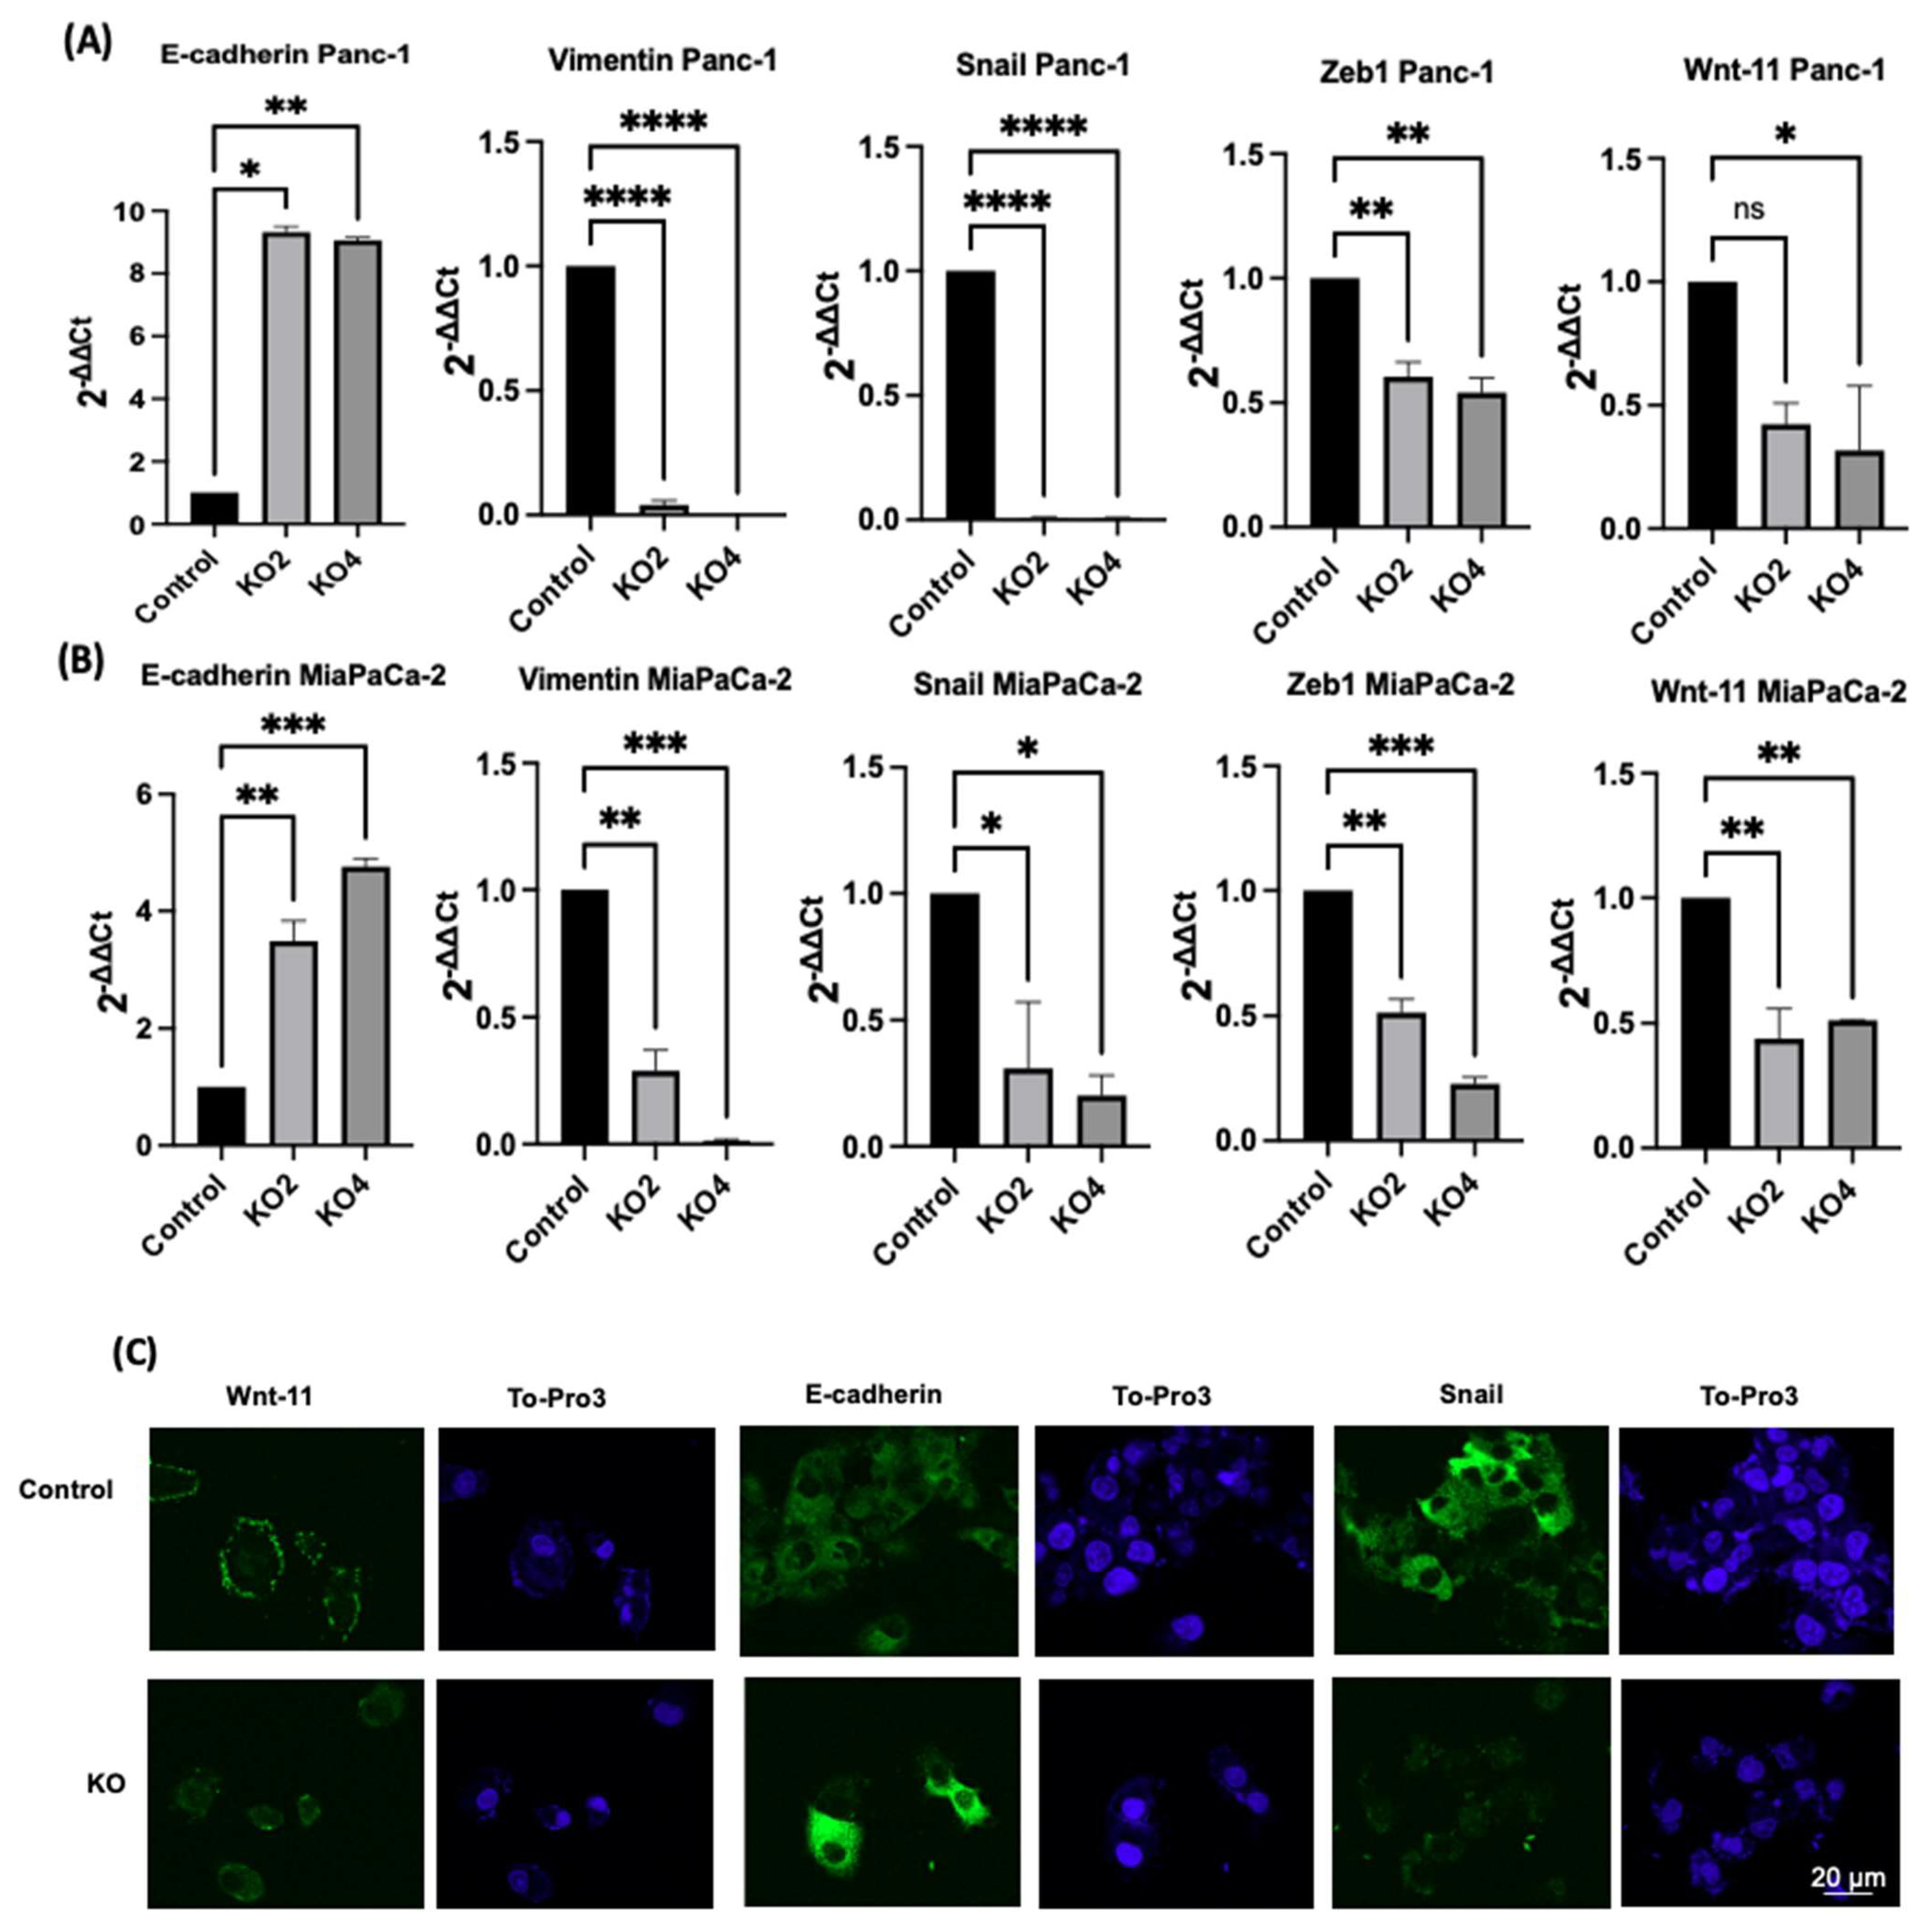
Figure 3. The silencing of miR-21 reduced the mesenchymal phenotype of PDAC cells. (A) E-cadherin, Vimentin, Snail, Wnt-11, and Zeb1 in the Panc-1 cell line relative mRNA expression levels. Relative mRNA expression levels of Vimentin, Snail, and Zeb1 were significantly downregulated in miR-21 KO2 and KO4 in the Panc-1 cell line, while E-cadherin was significantly upregulated. Relative mRNA expression levels Wnt-11 were significantly reduced in miR-21 KO4 but not in miR-21 KO2 in the Panc-1 cell line. The column graphic represents the average of three replicates of RNA isolated from Panc-1 control and its Kos. Data normalized according to RNA polymerase II (RPII) expression by fold analysis (n = 3, p < 0.05). (B) Relative mRNA expression levels of E-cadherin, vimentin, Snail, Wnt-11, and Zeb1 in the MiaPaCa-2 cell line. Relative mRNA expression levels of vimentin, Snail, Zeb1, and Wnt-11 significantly decreased in miR-21 KO2 and KO4 in the MiaPaCa-2 cell line, while E-cadherin significantly increased. The column graphic represents the average of three replicates of RNA isolated from MiaPaCa-2 control and its Kos. Data normalized according to RNA polymerase II (RPII) expression by fold analysis (n = 3, p < 0.05). Exact p-values are indicated (* p ≤ 0.05; ** p ≤ 0.01; *** p ≤ 0.001; **** p ≤ 0.0001); error bars indicate SD. (C) Immunofluorescence assays were performed to show Wnt-11, E-cadherin, Snail protein levels, and protein localization (green) in Panc-1 wt (Control) and miR-21 KO cells. To-Pro3 (blue) was used for staining nuclei. KO2 immunofluorescence results are shown as a representative to compare to control (n = 3), the scale bar represents 20 μm in all images.
2.4. miR-21 Kos Diminish Expressions of CSC Markers in PDAC
The expression levels of specific selected CSCs, which are involved in PDAC progression, were assessed in the miR-21 PDAC KO cell lines generated from both Panc-2 and MiaPaCa-2; this included CSC markers CD44, CD24, CD133, CXCR4, and ALDH1. In Panc-1 miR-21 KO clones 2 and 4, the mRNA expression levels of CD44 were decreased by 97% (n = 3; p < 0.01 for all; Figure 4A), whereas CD133 was downregulated by 76% in KO2 and by 52% in KO4 (n = 3; p < 0.01 and p < 0.05, respectively; Figure 4A). CXCR4 was reduced by 86% in KO2 and by 100% in KO4 (n = 3; p < 0.0001 for all; Figure 4A), whereas ALDH1 expression levels were reduced by 77% in KO2 and by 95% in KO4 (n = 3; p < 0.01 for all; Figure 4A). The mRNA expression levels of CD24 were reduced by 77% in KO2 and by 88% in KO4 (n = 3; p < 0.05 and p < 0.05, respectively; Figure 4A), compared with the control Panc-1 vector alone. In the MiaPaCa-2 miR-21 knockout cells, CD44 mRNA expression levels decreased significantly by 75% in KO2 (n = 3; p < 0.001; Figure 4B) and by 40% in KO4 (n = 3; p < 0.01; Figure 4B), whereas CD133 mRNA levels were decreased by 50% in KO2 and by 42% in KO4 (n = 3; p < 0.05 for all; Figure 4B). Similarly, CXCR4 mRNA expression levels were reduced by 51% in KO2 and by 69% in KO4 (n = 3; p < 0.01 for all; Figure 4B), while ALDH1 mRNA levels decreased by 66% in KO2 and 46% in KO4 (n = 3; p < 0.001 for all; Figure 4B). The mRNA expression levels of CD24 were significantly reduced by 73% in KO2 (n = 3; p < 0.01; Figure 4B) and by 53% in KO4 (n = 3; p < 0.05; Figure 4B). Hence, the findings show that through the knocking out of miR-21 in two PDAC cell lines, the stemness markers CD44, CD133, CD24, CXCR4, and ALHD1 were significantly reduced in both cell lines assessed.
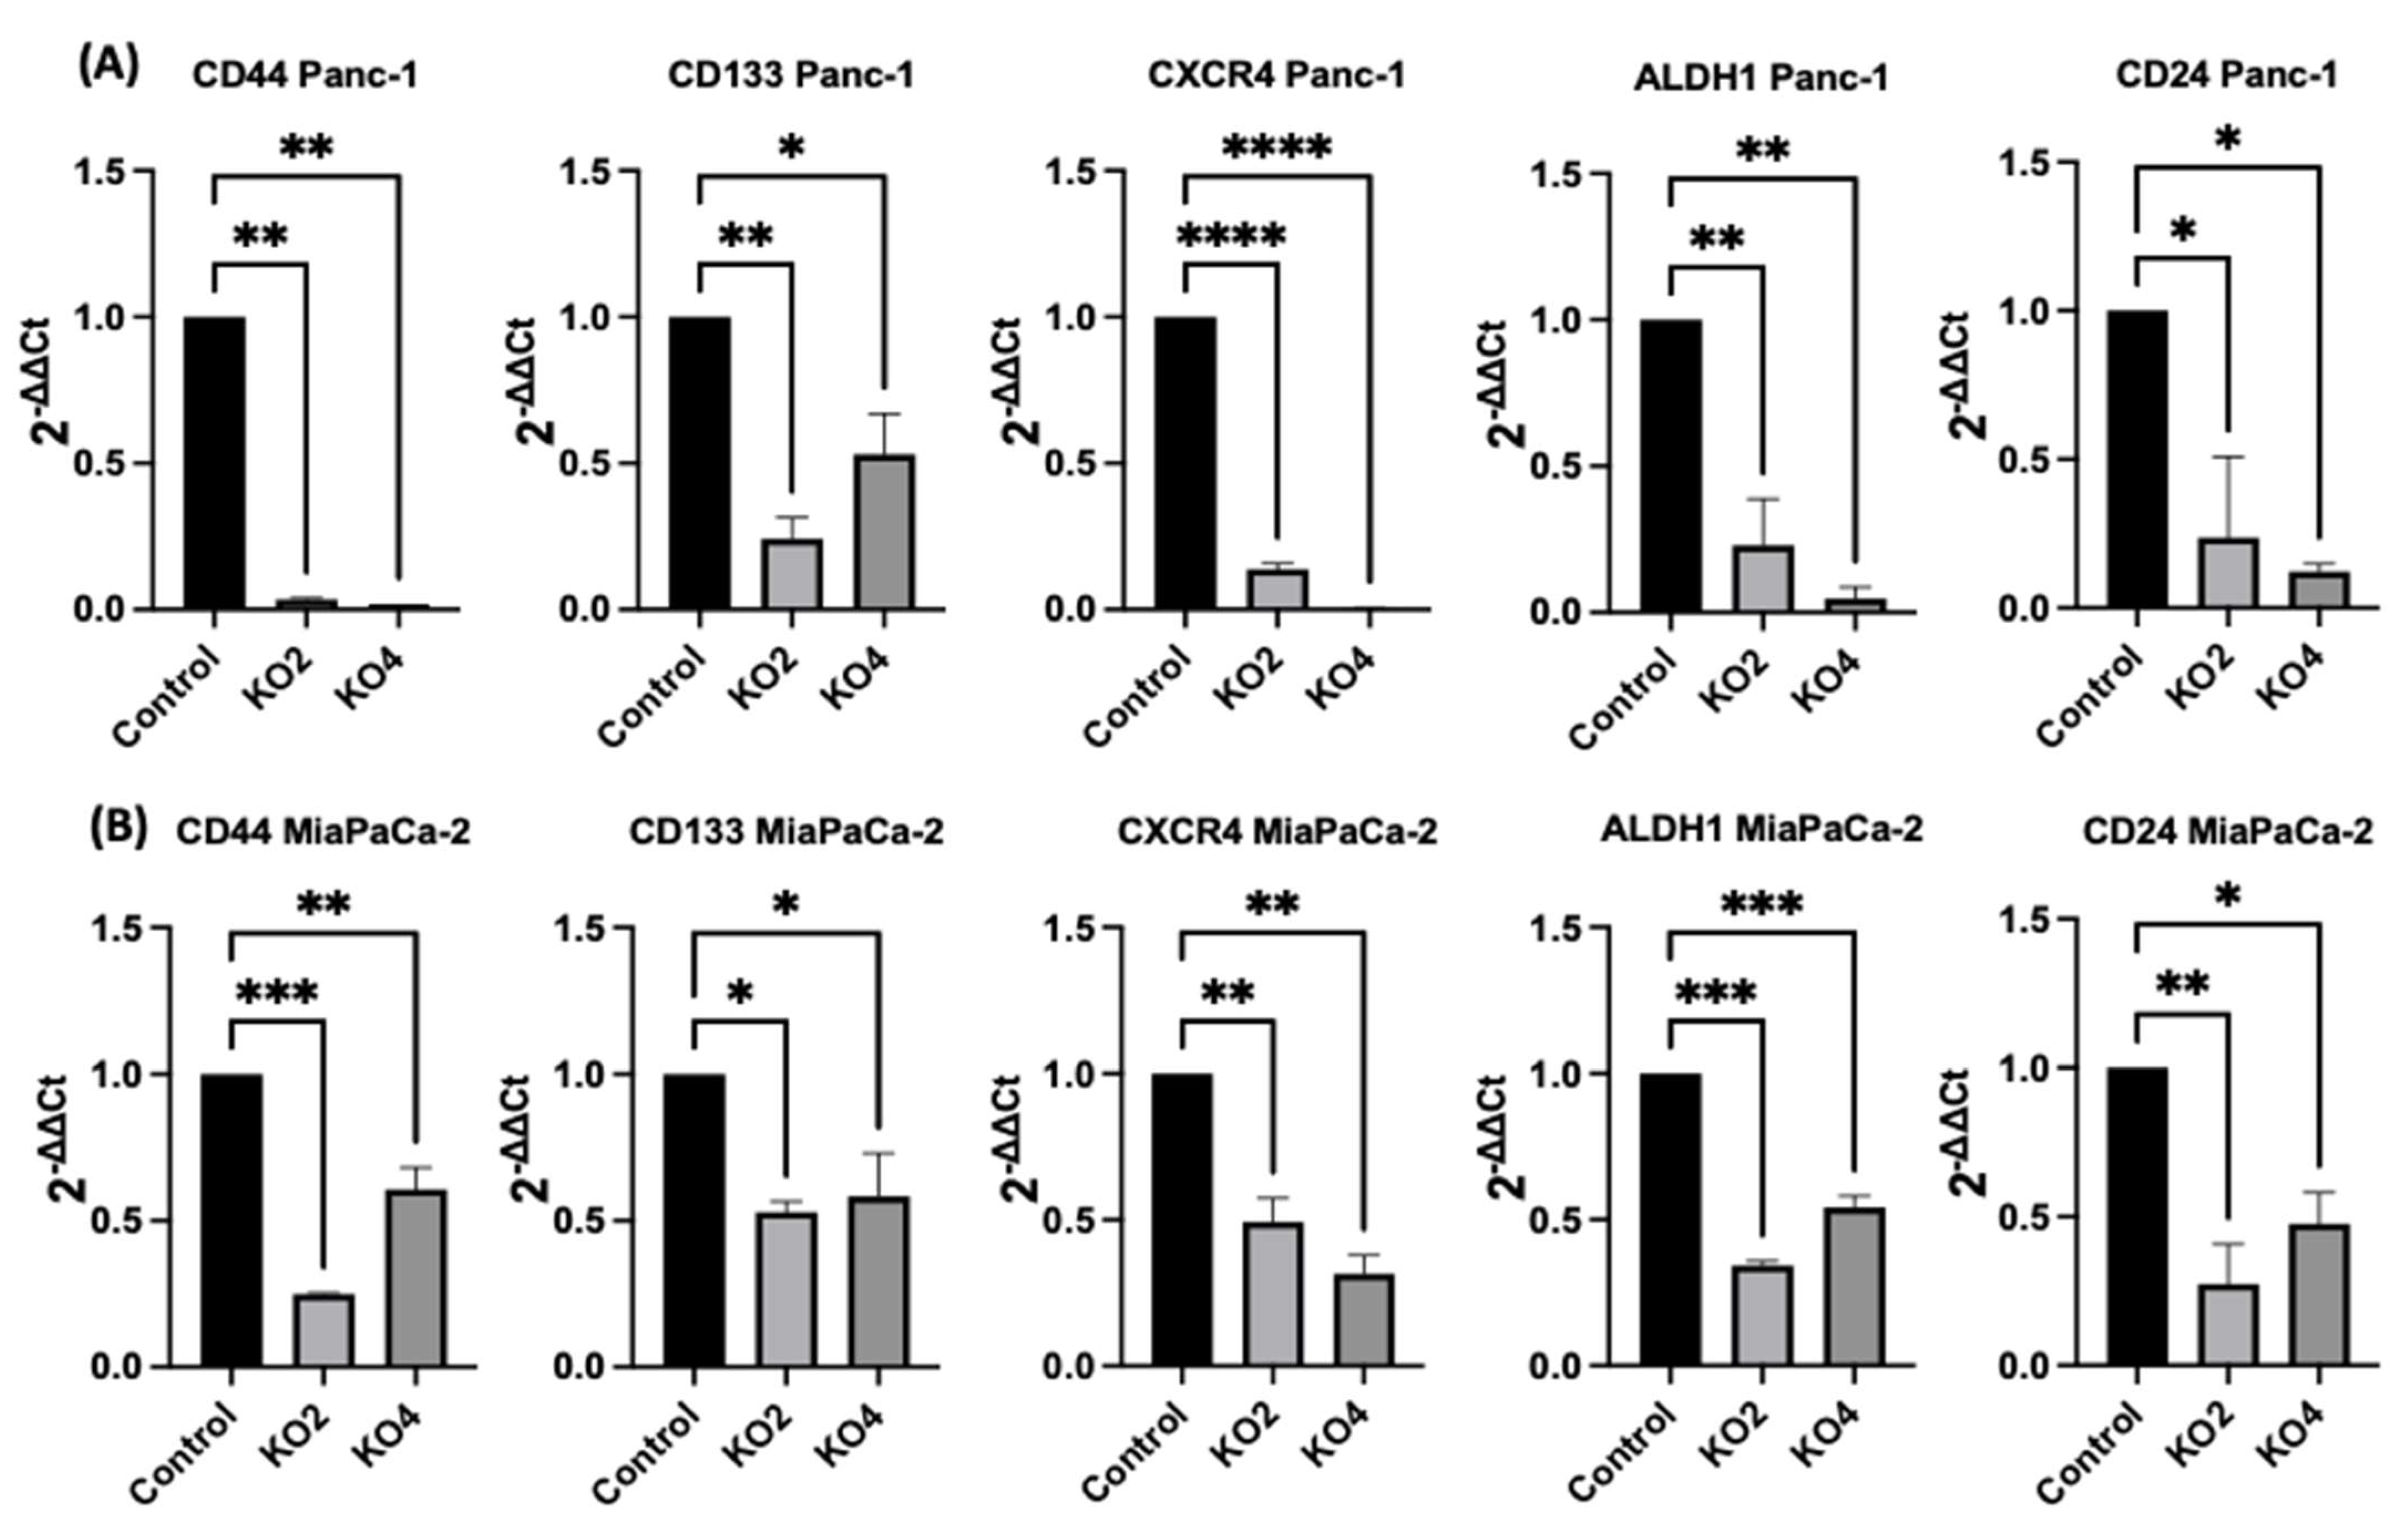
Figure 4. Expression of CSCs markers in PDAC cell lines following miR-21 knockout. (A) mRNA expression levels of CD44, CD133, CXCR4, ALDH1, and CD24 in the Panc-1 miR-21 KO cell line, compared with the Panc-1 vector alone. Relative mRNA expression levels of CD44, CD133, CXCR4, ALDH1, and CD24 are significantly reduced in miR-21 KO Panc-1 cells. The column graphic represents the average of three replicates of RNA isolated from Panc-1 control and its Kos. Data normalized according to RPII expression by fold analysis (n = 3, p < 0.05). (B) mRNA expression levels of CD44, CD133, CXCR4, ALDH1, and CD24 in the miR-21 KO MiaPaCa-2 cell line, compared with MiaPaCa-2 vector alone. Relative mRNA expression levels of CD44, CD133, CXCR4, ALDH1, and CD24 are significantly reduced in miR-21 KO MiaPaCa-2 cells. The column graphic represents the average of three replicates of RNA isolated from MiaPaCa-2 control and its Kos. Data normalized according to RNA polymerase II (RPII) expression by fold analysis (n = 3, p < 0.05). p-values are indicated as * p ≤ 0.05; ** p ≤ 0.01; *** p ≤ 0.001; **** p ≤ 0.0001; error bars indicate SD.
2.5. Flow Cytometry Analysis of PCSCs Expression in PDAC miR-21 KO Cells
Several key CSCs associated with PDAC, including CD24, CD133, and CD13 were assessed by flow cytometry in the miR-21 KO cells and compared with their expression in control cells. Results showed that CD133 was expressed at higher levels in Panc-1 control cells (96.9%; n = 3; Figure 5A), compared with Panc-1 KO2 (18.2%; 74.4-fold reduction; n = 3; p < 0.001; Figure 5B) and KO4 (21.8%; 69.3-fold reduction; n = 3; p < 0.001; Figure 5C,G). Similarly, in MiaPaCa-2 miR-21 Kos, the expression levels of CD133 were significantly higher in MiaPaCa-2 control (68.6%; n = 3; Figure 5D,H), compared with MiaPaCa-2 KO2 (17.9%; 52.3-fold decrease; n = 3; p < 0.001; Figure 5E,H) and KO4 (22.9%; 47.5-fold decrease; n = 3; p < 0.001; Figure 5F,H). Additionally, in the Panc-1 miR-21 Kos, the positive population for CD13 and CD24 presented a 100-fold and 95.7-fold reduction, respectively, in Panc-1 KO2 (0% and 4.3%, respectively; n = 3; Figure 6B) and 100-fold reduction in KO4 (0.2% and 0.1%, respectively; n = 3; Figure 6C), compared with what was observed in the Panc-1 control, where the positive population for both CD13 and CD24 was 97.4% (n = 3; Figure 6A). In the MiaPaCa-2 cell line, control cells were positive for CD24 (81.9%; n = 3; Figure 6D) and negative for CD13 (0%; n = 3; Figure 6D), whereas the percentage of negative cell population for both CD13 and CD24 PCSCs in the MiaPaCa-2 KO2 was 96.4% (90.1-fold; n = 3; Figure 6E) and 97.7% in KO4 (91.4-fold; n = 3; Figure 6F; Table 1). These results indicate that the depletion of miR-21 from both PDAC cell lines results in a decrease in the stemness markers CD133, CD24 and CD133.
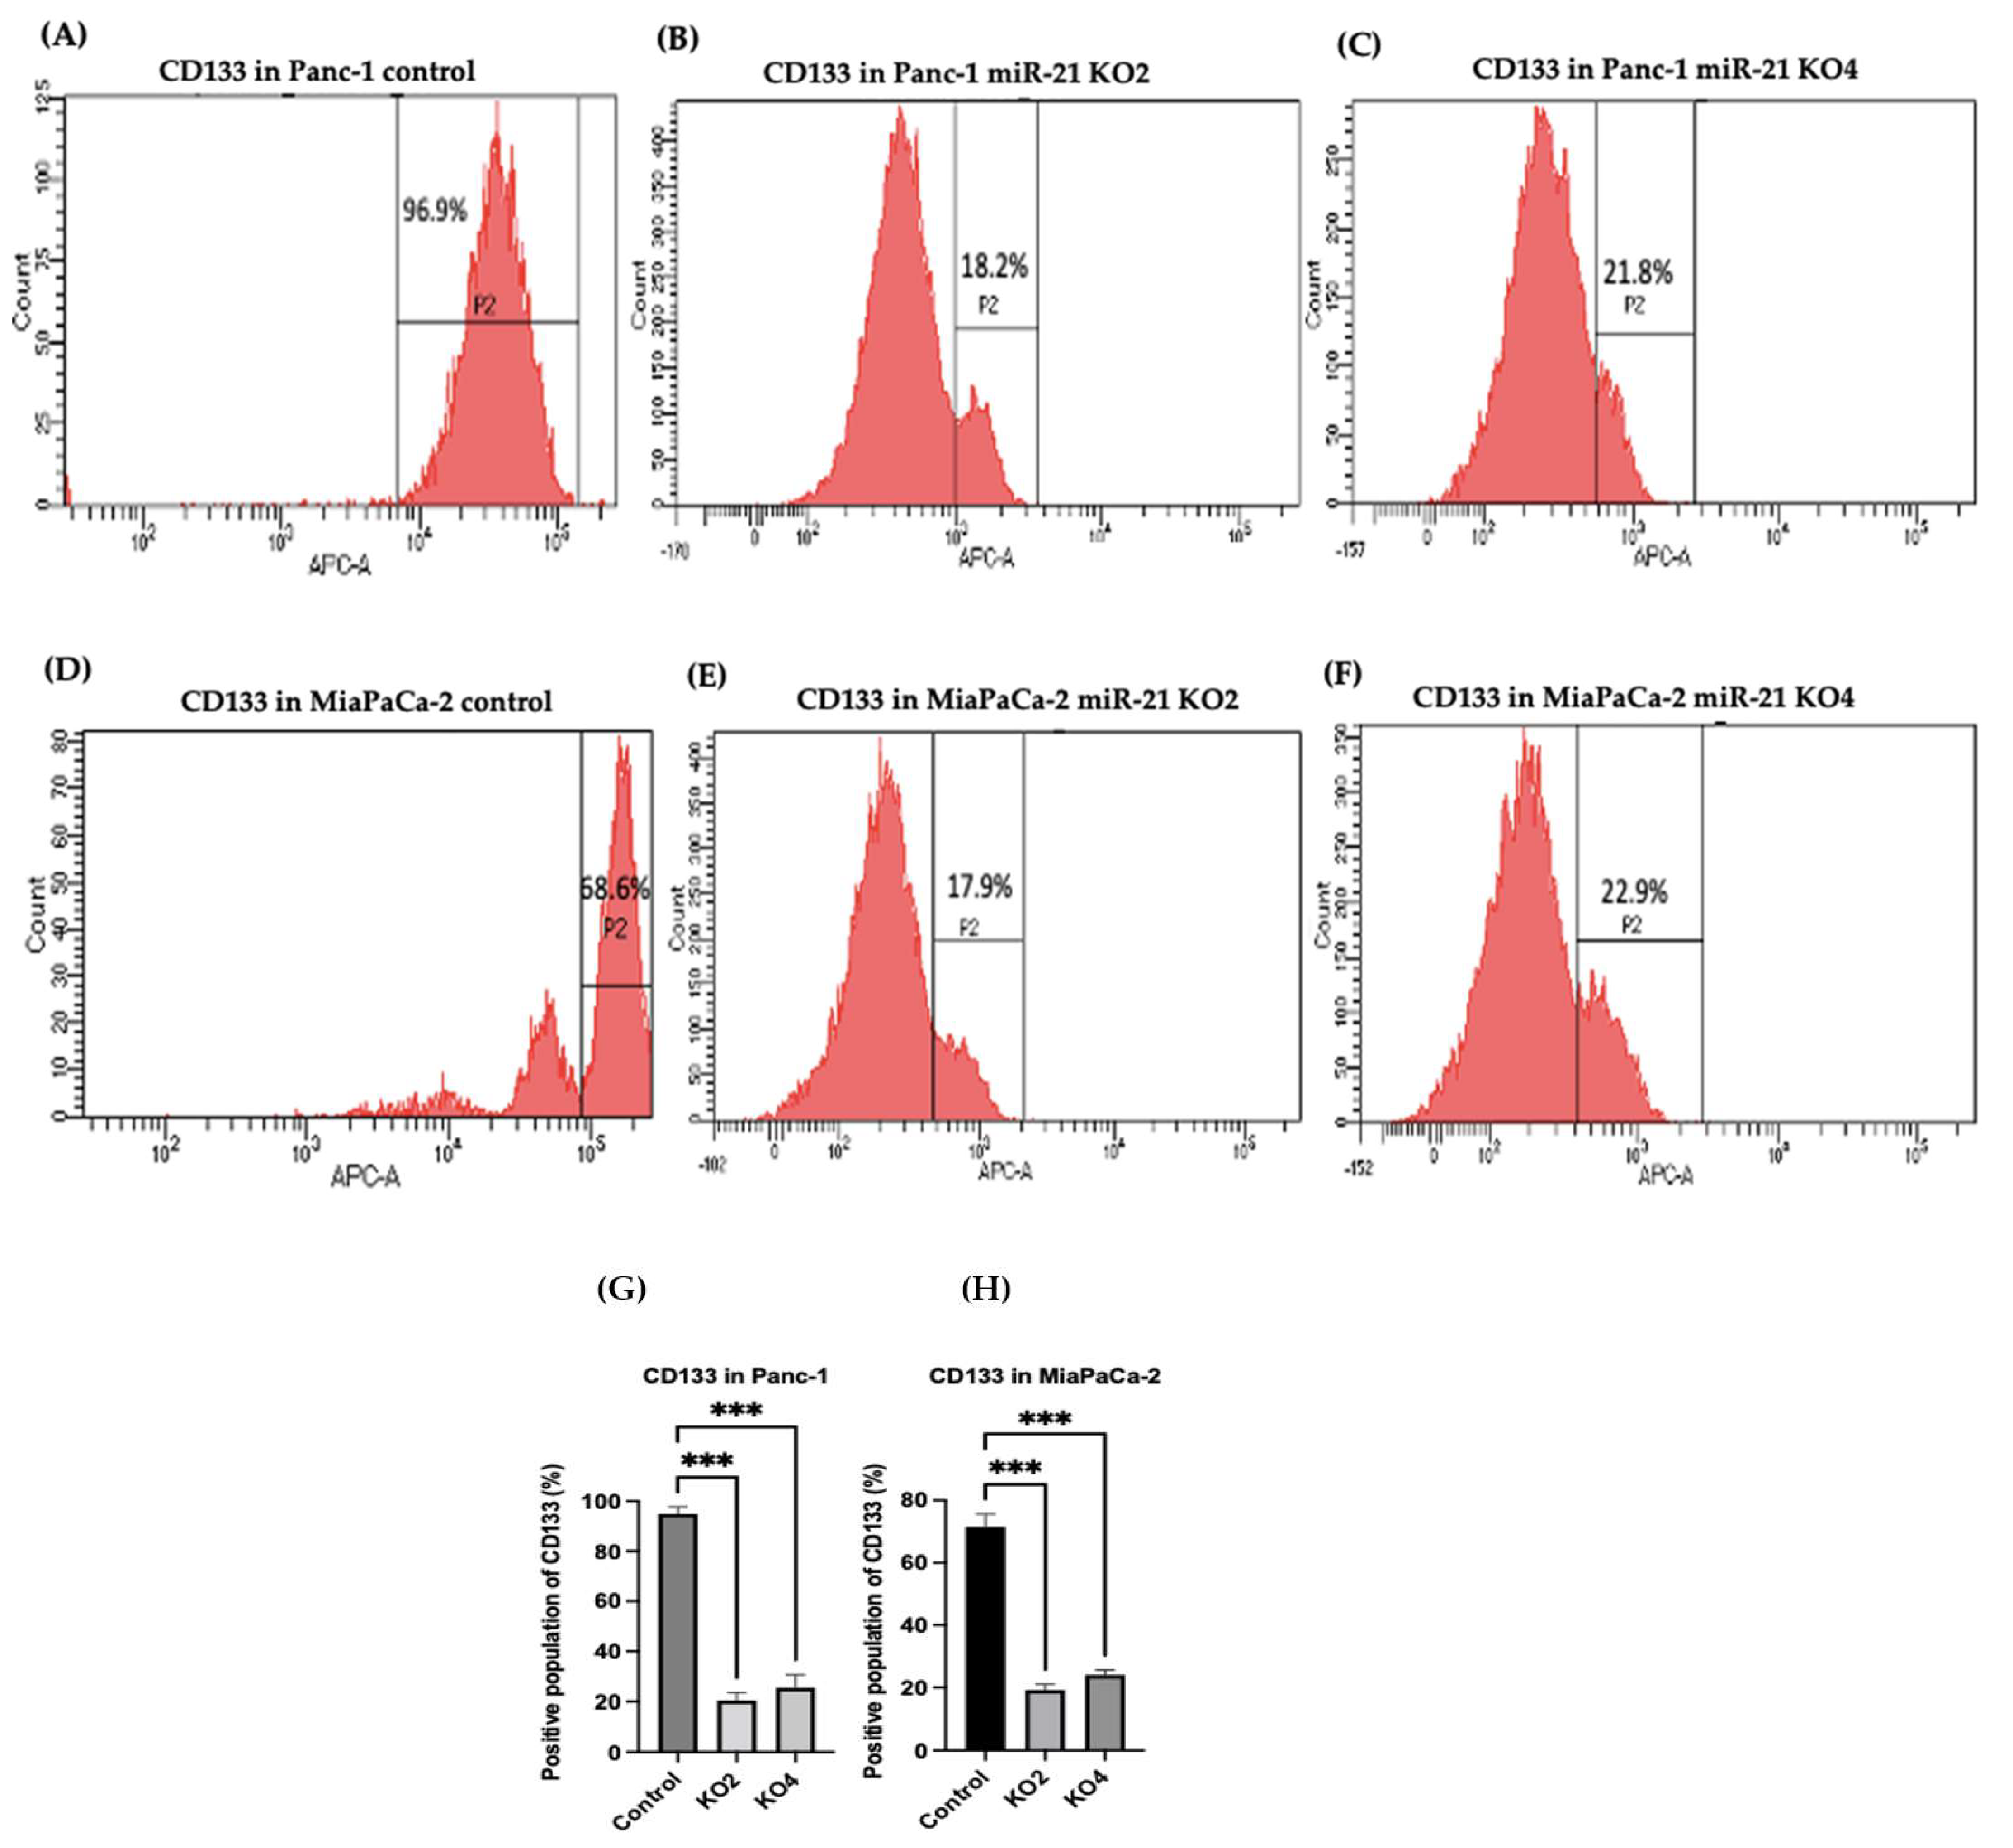
Figure 5. Flow cytometry analysis of CD133 in PDAC control and miR-21 KO cell lines. (A–C): Expression of CD133 in the Panc-1 miR-21 Kos and control: (A) Panc-1 vector alone (control cells); (B) miR-21 KO2; (C) miR-21 KO4. (D–F): Expression of CD133 in MiaPaCa-2 miR-21 Kos. (D) MiaPaCa-2 vector alone (control cells); € miR-21 KO2; (F) miR-21 KO4. (G) Percentage of the CD133 positive population in Panc-1 cells and their miR-21 KOs. CD133 expression was significantly increased in the Panc-1 vector alone compared with the miR-21 KOs in the Panc-1 cell line. The column graphic represents the average of three replicates of RNA isolated from Panc-1 control cells and their KOs. Data normalized according to RPII expression by fold analysis (n = 3, p < 0.05). (H) Percentage of the CD133 positive population in MiaPaCa-2 cells and their miR-21 KOs. CD133 expression was significantly increased in MiaPaCa-2 control cells compared with their miR-21 KOs. The column graphic represents the average of three replicates of RNA isolated from MiaPaCa-2 control cells and their KOs. Data normalized according to RPII expression by fold analysis (n = 3, p < 0.05). Numbers in the gated areas mark the percentages of cells that were positive for this specific marker. p-values are indicated as *** p ≤ 0.001; error bars indicate SD.
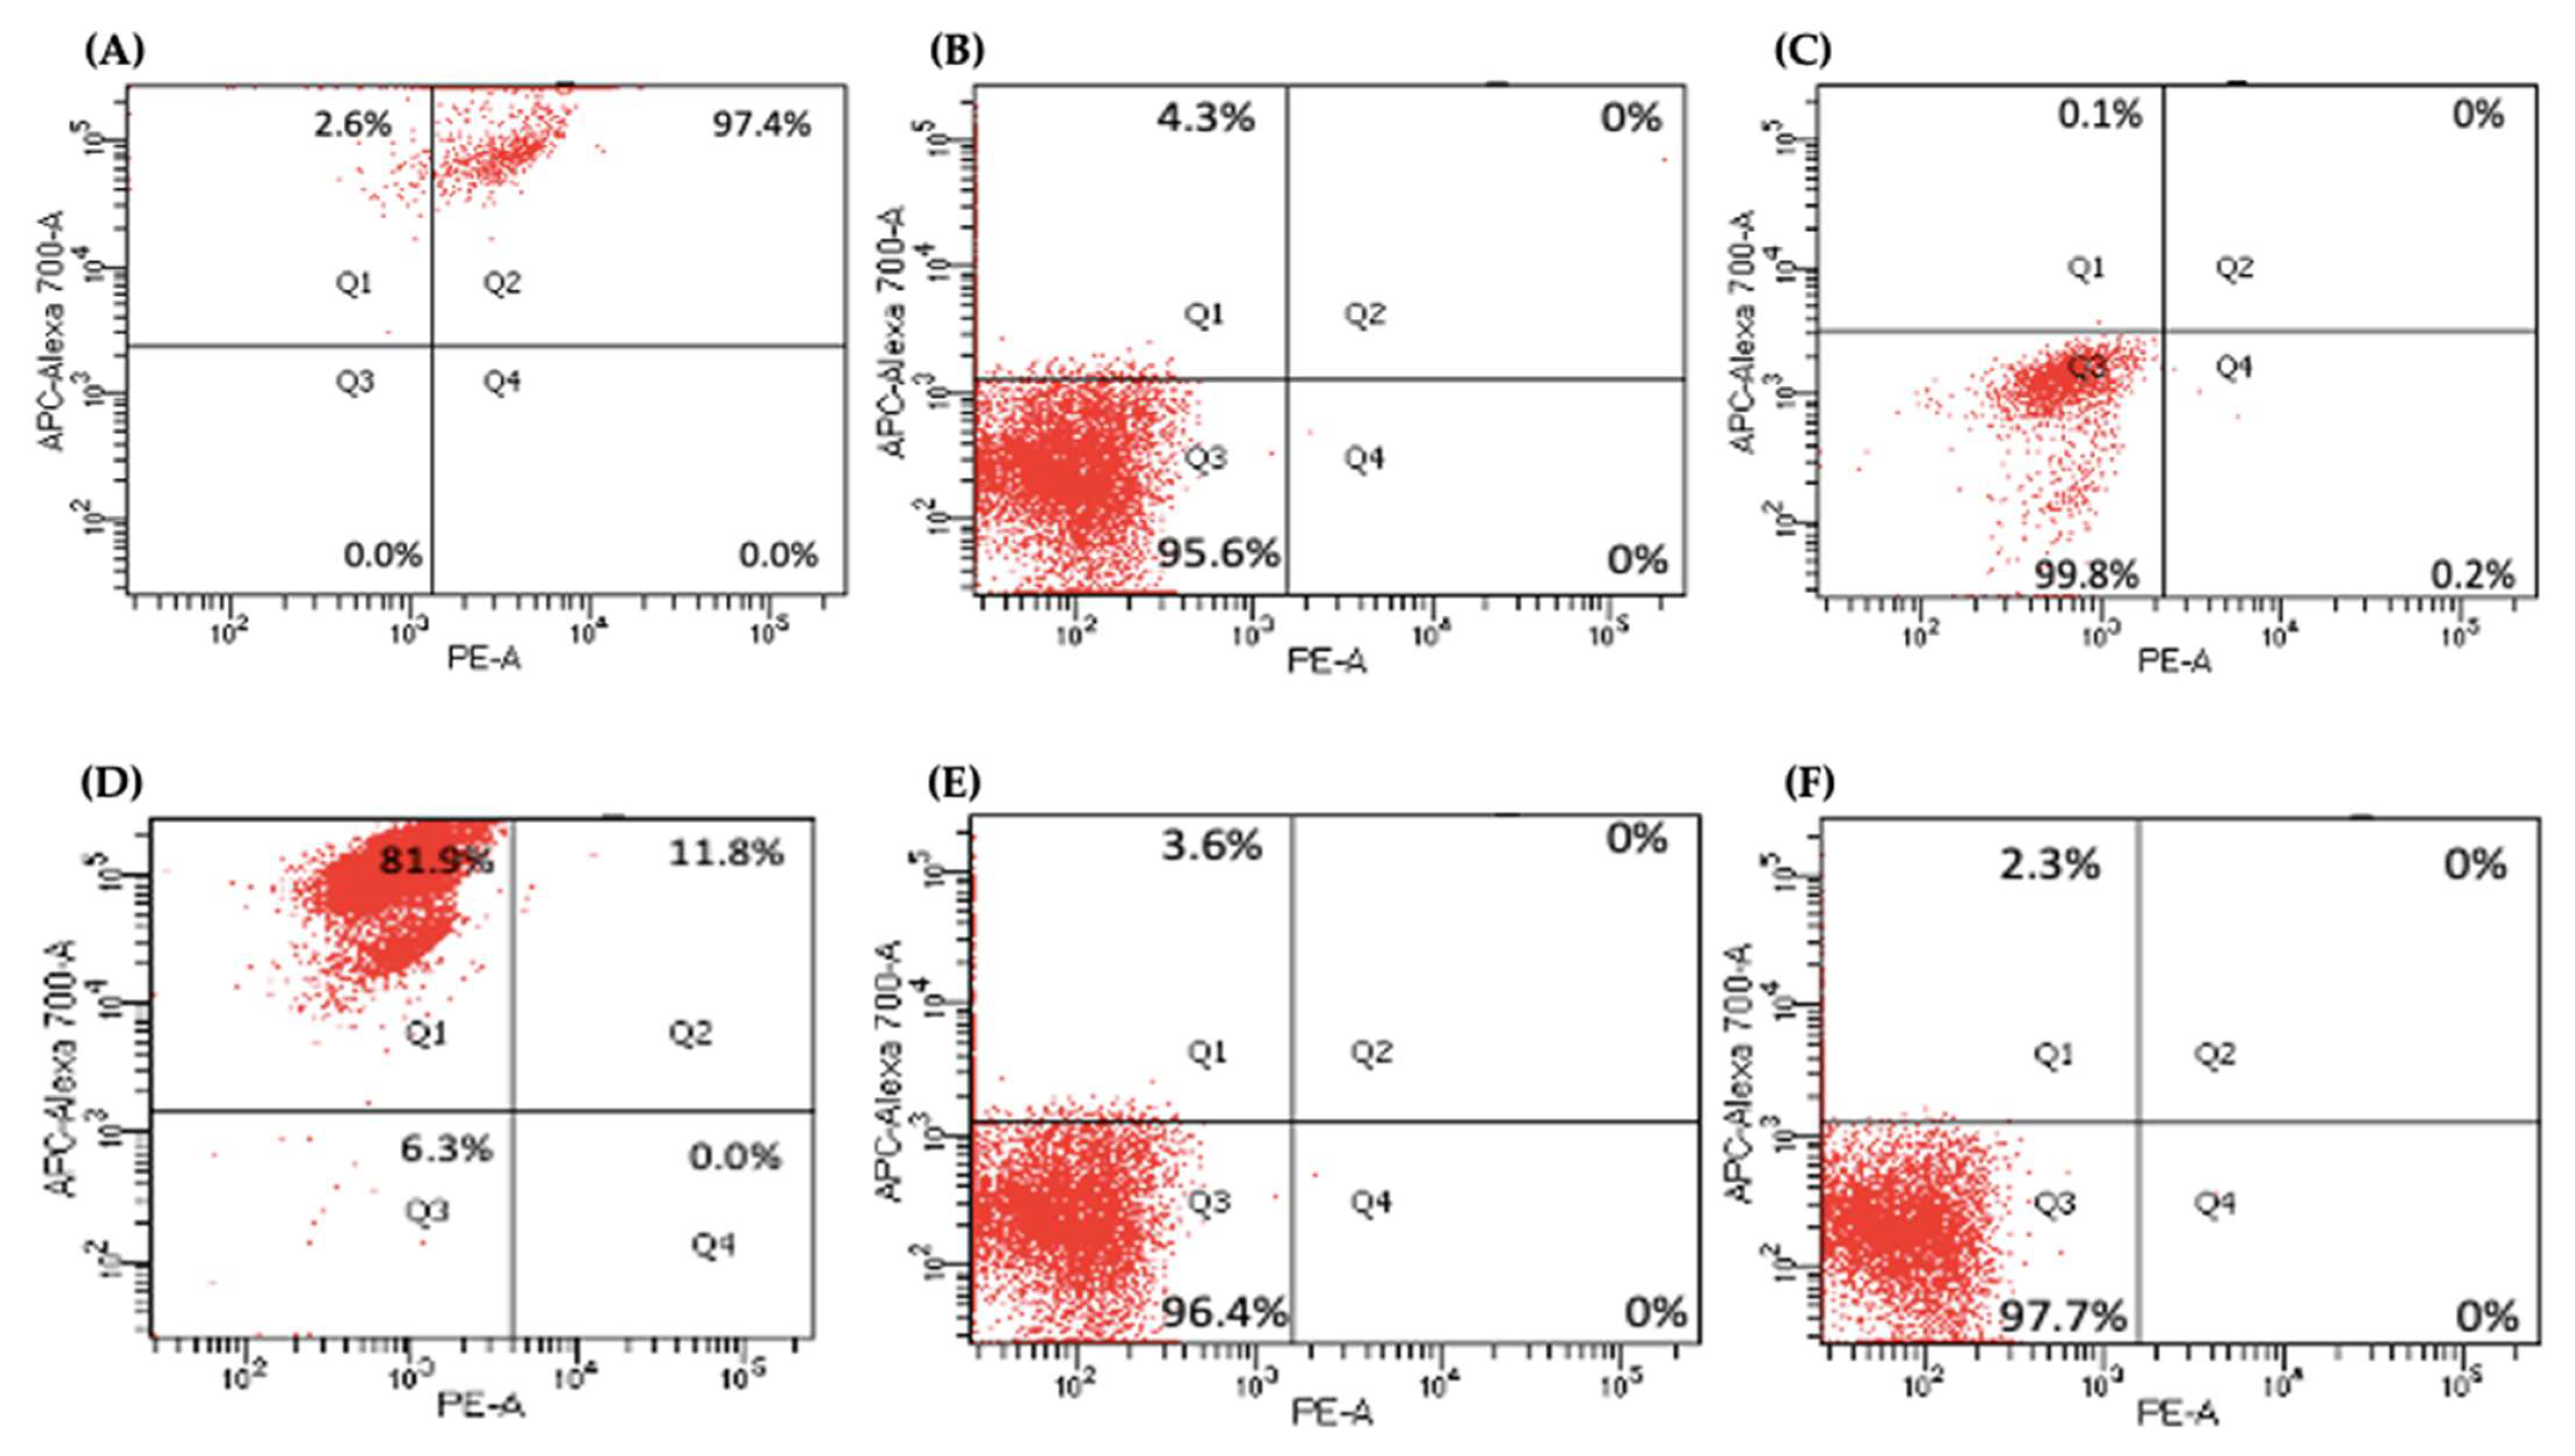
Figure 6. Flow cytometry analysis of CD24 and CD13 in miR-21 KO cell lines. (A–C) Expression of CD13 and CD24 in the Panc-1 KOs: (A) Panc-1 vector alone (control cells); (B) miR-21 KO2; (C) miR-21 KO4. Expression levels of both CD13 and CD24 were significantly reduced in Panc-1 miR-21 KO2 and KO4, compared with the Panc-1 control cells. (D–F): Expression of CD13 and CD24 in MiaPaCa-2 KOs: (D) MiaPaCa-2 vector alone (control cells); (E) miR-21 KO2; (F) miR-21 KO4. Expression levels of CD24 were significantly increased in MiaPaCa-2 control cells, while CD13 was significantly reduced not only in MiaPaCa-2 control cells but also in MiaPaCa-2 miR-21 KO2 and miR-21 KO4. APC-Alexa 700 symbolizes the CD24 marker, while PE stands for CD13. Numbers in the gated areas mark the percentages of cells that were positive for this specific marker.
Table 1. Percentage of expression of CD24 and CD13 in PDAC Cell Lines.
| Cancer Stem Cell Markers | Control | Panc-1 KO2 |
KO4 | Control | MiaPaCa-2 KO2 |
KO4 |
|---|---|---|---|---|---|---|
| CD24+ CD13+ | 97.4% | 0% | 0% | 11.8% | 0% | 0% |
| CD24− CD13− | 0% | 95.6% | 99.8% | 6.3% | 96.4% | 97.7% |
| CD24+ CD13− | 2.6% | 4.3% | 0.1% | 81.9% | 3.6% | 2.3% |
| CD24− CD13+ | 0% | 0% | 0.2% | 0% | 0% | 0% |
2.6. miR-21 KO Reduce Cellular Invasion in Panc-1 and MiaPaca-2 Cells
The invasiveness of both Panc-1 and MiaPaca-2 cells was studied by using Boyden chambers with Matrigel over a 16 h period. KO miR-21 resulted in a significant suppression of invasiveness by 31% and 22% in Panc-1; 27% and 16% in MiaPaca-2 cells (n = 3; p < 0.0001 and 0.001; p < 0.0001, respectively; Figure 7A). There was no significant change in the cell number over the 16 h in Panc-1 cells; however, a significant 3% reduction in MiaPaCa-2 cellular proliferation was detected in miR-21 KOs (n = 3; p > 0.05; p < 0.01, respectively; Figure 7B). The results show that miR-21 KO reduces invasiveness. The Panc-1 miR-21 KO cells did not exhibit a decrease in clonogenicity compared to control cells after 12 days, however, the MiaPaCa-2 miR-21 KO cells presented a reduction in proliferation compared to MiaPaCa-2 control (Figure 7C).
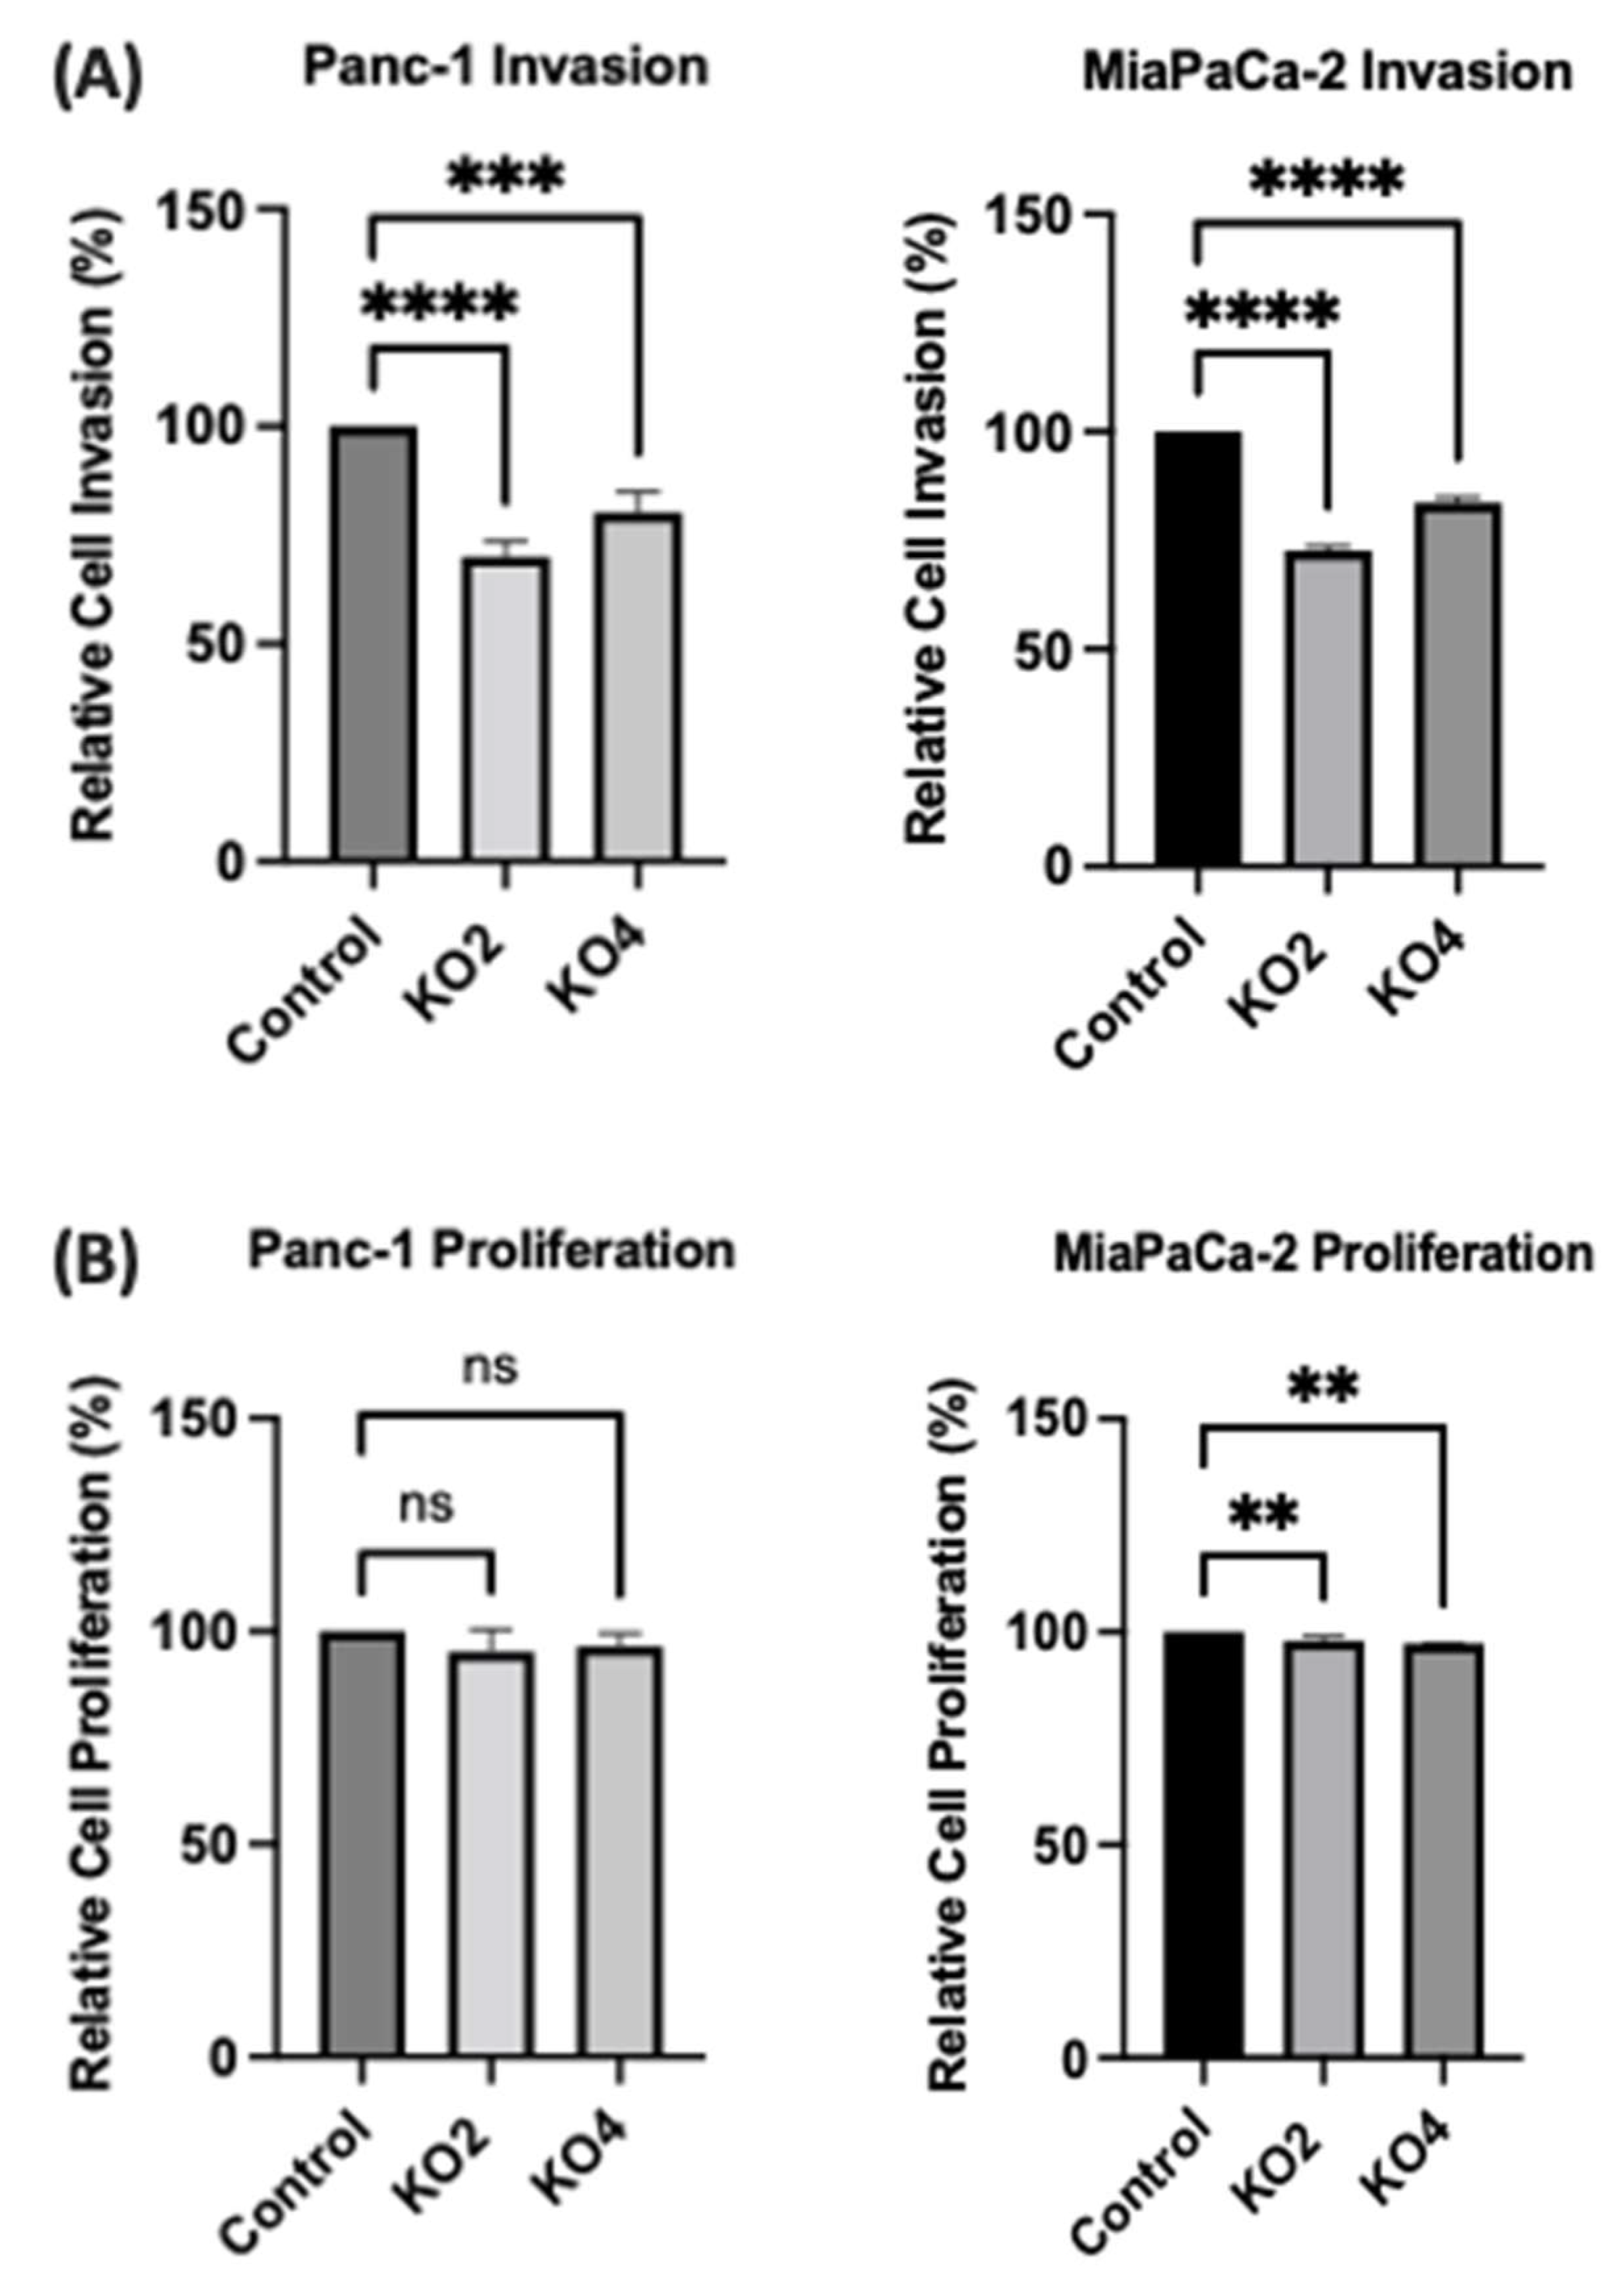
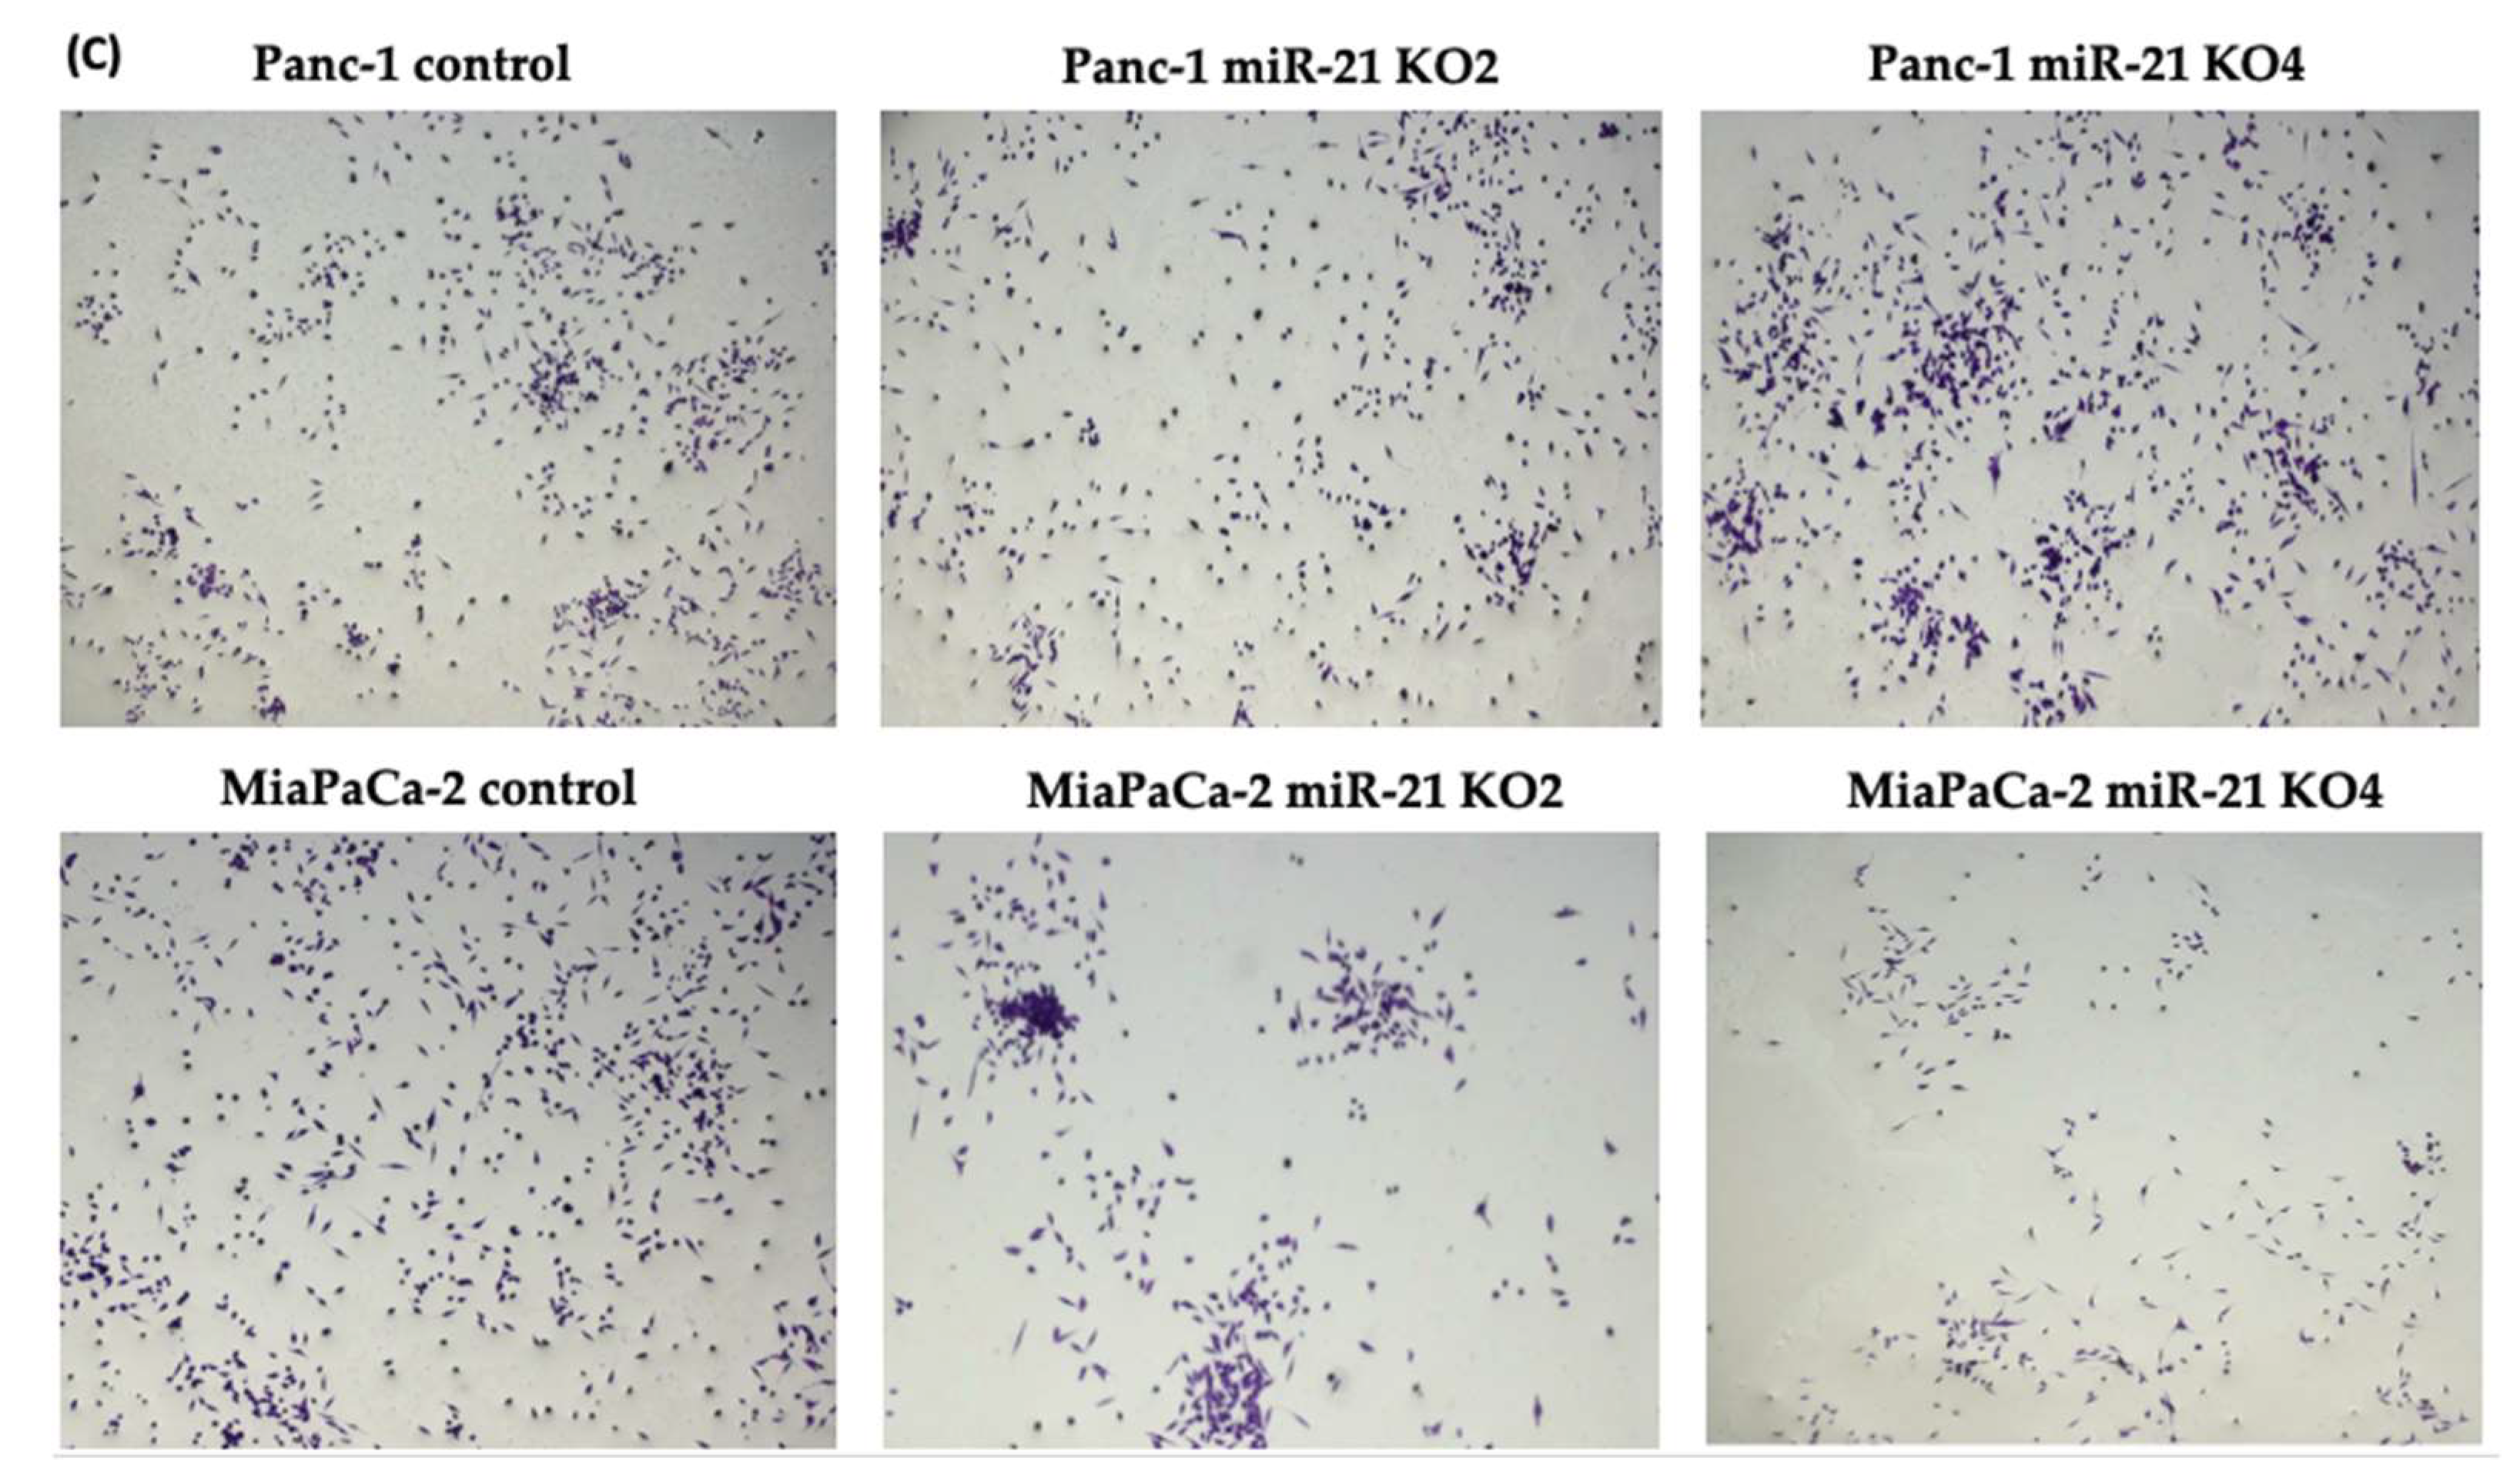
Figure 7. miR-21 reduced cellular invasion of Panc-1 and MiaPaca-2 cells. (A) Control and miR-21 KO cells were plated on Matrigel-coated transwell filters and the extent of invasion was determined after 16 h. The results are plotted as Relative Cell Invasion (%), which is the percentage of invaded cells compared to the total number of cells seeded. (B) The total cell number/proliferation did not change during the course of the experiment in the Panc-1 miR-21 KOs (n = 3; p > 0.05 for all), however, a small significant reduction was detected in the MiaPaCa-2 miR-21 KOs (n = 3; p < 0.01 for all). (C) Colony formation assay for Panc-1 and MiaPaCa-2 control and miR-21 KO cells. The colonies were observed with crystal violet staining of cells following 12 days. Images were obtained by using EVOS FL Auto 2 Imaging System (ThermoFisher, UK) with 10x magnification. p-values are indicated as ** p ≤ 0.01; *** p ≤ 0.001; **** p ≤ 0.0001; error bars indicate SD.
This entry is adapted from the peer-reviewed paper 10.3390/ijms23031275
References
- Carrato, A.; Falcone, A.; Ducreux, M.; Valle, J.W.; Parnaby, A.; Djazouli, K.; Alnwick-Allu, K.; Hutchings, A.; Palaska, C.; Parthenaki, I.; et al. A systematic review of the burden of pancreatic cancer in. Europe: Real-world impact on survival, quality of life and costs. J. Gastrointest. Cancer 2015, 46, 201–211.
- Von Hoff, D.D.; Korn, R.; Mousses, S. Pancreatic cancer—Could it be that simple? A different context of vulnerability. Cancer Cell 2009, 16, 7–8.
- Gall, F.P.; Kessler, H.; Hermanek, P. Surgical treatment of ductal pancreatic carcinoma. Eur. J. Surg. Oncol. 1991, 17, 173–181.
- Srivastava, S.K.; Srivastava, S.K.; Arora, S.; Singh, S.; Bhardwaj, A.; Averett, C.; Singh, A.P. MicroRNAs in pancreatic malignancy: Progress and promises. Cancer Lett. 2014, 347, 167–174.
- Cartwright, T.; Richards, D.A.; Boehm, K.A. Cancer of the pancreas: Are we making progress? A review of studies in the US Oncology Research Network. Cancer Control 2008, 15, 308–313.
- Bartel, D.P. MicroRNAs: Genomics, biogenesis, mechanism, and function. Cell 2004, 116, 281–297.
- Lin, S.; Gregory, R.I. MicroRNA biogenesis pathways in cancer. Nat. Rev. Cancer 2015, 15, 321–333.
- Turchinovich, A.; Tonevitsky, A.G.; Burwinkel, B. Extracellular miRNA: A collision of two paradigms. Trends Biochem. Sci. 2016, 41, 883.
- Friedman, R.C.; Farh, K.K.; Burge, C.B.; Bartel, D.P. Most mammalian mRNAs are conserved targets of microRNAs. Genome Res. 2009, 19, 92–105.
- Yu, J.; Li, A.; Hong, S.M.; Hruban, R.H.; Goggins, M. MicroRNA alterations of pancreatic intraepithelial neoplasias. Clin. Cancer Res. 2012, 18, 981–992.
- Zhao, X.; Ren, Y.; Cui, N.; Wang, X.; Cui, Y. Identification of key microRNAs and their targets in exosomes of pancreatic cancer using bioinformatics analysis. Medicine 2018, 97, e12632.
- Slack, F.J.; Weidhaas, J.B. MicroRNA in cancer prognosis. N. Engl. J. Med. 2008, 359, 2720–2722.
- Gilles, M.; Hao, L.; Huang, L.; Rupaimoole, R.; Lopez-Casas, P.P.; Pulver, E.; Jeong, J.C.; Muthuswamy, S.K.; Hidalgo, M.; Bhatia, S.N.; et al. Personalized RNA medicine for pancreatic cancer. Clin. Cancer Res. 2018, 24, 1734–1747.
- Galasso, M.; Sandhu, S.K.; Volinia, S. MicroRNA expression signatures in solid malignancies. Cancer J. 2012, 18, 238–243.
- Hussain, S.P. Pancreatic cancer: Current progress and future challenges. Int. J. Biol. Sci. 2016, 12, 270.
- Kasaka, N.; Iguchi, H.; Ochiya, T. Circulating microRNA in body fluid: A new potential biomarker for cancer diagnosis and prognosis. Cancer Sci. 2010, 101, 2087–2092.
- Wang, J.; Chen, J.; Chang, P.; LeBlanc, A.; Li, D.; Abbruzzesse, J.L.; Frazier, M.L.; Killary, A.M.; Sen, S. MicroRNAs in plasma of pancreatic ductal adenocarcinoma patients as novel blood-based biomarkers of disease. Cancer Prev. Res. 2009, 2, 807–813.
- Kojima, M.; Sudo, H.; Kawauchi, J.; Takizawa, S.; Kondou, S.; Nobumasa, H.; Ochiai, A. MicoRNA markers for diagnosis of pancreatic and biliary-tract cancers. PLoS ONE 2015, 10, e0118220.
- Chan, A.; Prassas, I.; Dimitromanolakis, A.; Brand, R.E.; Serra, S.; Diamandis, E.P.; Blasutig, I.M. Validation of biomarkers that complement ca19.9 in detecting early pancreatic cancer. Clin. Cancer Res. 2014, 20, 5787–5795.
- Sawabu, N.; Watanabe, H.; Yamaguchi, Y.; Ohtsubo, K.; Motoo, Y. Serum tumor markers and molecular biological diagnosis in pancreatic cancer. Pancreas 2004, 28, 263–267.
- Schultz, N.A.; Dehlendorff, C.; Jensen, B.V.; Bjerregaard, J.K.; Nielsen, K.R.; Bojesen, S.E.; Calatayud, D.; Nielsen, S.E.; Yilmaz, M.; Holländer, N.H.; et al. MicroRNA biomarkers in whole blood for detection of pancreatic cancer. JAMA 2014, 311, 392–404.
- Li, C.; Heidt, D.G.; Dalerba, P.; Burant, C.F.; Zhang, L.; Adsay, V.; Wicha, M.; Clarke, M.F.; Simeone, D.M. Identification of pancreatic cancer stem cells. Cancer Res. 2007, 67, 1030–1037.
- Li, C.; Lee, C.J.; Simeone, D.M. Identification of human pancreatic cancer stem cells. Methods Mol. Biol. 2009, 568, 161–173.
- Niess, H.; Camaj, P.; Renner, A.; Ischenko, I.; Zhao, Y.; Krebs, S.; Mysliwietz, J.; Jäckel, C.; Nelson, P.J.; Blum, H.; et al. Side population cells of pancreatic cancer show characteristics of cancer stem cells responsible for resistance and metastasis. Target Oncol. 2015, 10, 215–227.
- Kim, M.P.; Fleming, J.B.; Wang, H.; Abbruzzese, J.L.; Choi, W.; Kopetz, S.; McConkey, D.J.; Evans, D.B.; Gallick, G.E. ALDH activity selectively defines an enhanced tumor-initiating cell population relative to CD133 expression in human pancreatic adenocarcinoma. PLoS ONE 2011, 6, e20636.
- Klonisch, T.; Wiechec, E.; Hombach-Klonisch, S.; Ande, S.R.; Wesselborg, S.; Schulze-Osthoff, K.; Los, M. Cancer stem cell markers in common cancers—Therapeutic implications. Trends Mol. Med. 2008, 14, 450–460.
- Marcato, P.; Dean, C.A.; Pan, D.; Araslanova, R.; Gillis, M.; Joshi, M.; Helyer, L.; Pan, L.; Leidal, A.; Gujar, S.; et al. Aldehyde dehydrogenase activity of breast cancer stem cells is primarily due to isoform ALDH1A3 and its expression is predictive of metastasis. Stem Cells 2011, 29, 32–45.
- Miranda-Lorenzo, I.; Dorado, J.; Lonardo, E.; Alcala, S.; Serrano, A.G.; Clausell-Tormos, J.; Cioffi, M.; Megias, D.; Zagorac, S.; Balic, A.; et al. Intracellular autofluorescence: A biomarker for epithelial cancer stem cells. Nat. Methods 2014, 11, 1161–1169.
- Valle, S.; Martin-Hijano, L.; Alcalá, S.; Alonso-Nocelo, M.; Sainz, B., Jr. The Ever-Evolving Concept of the Cancer Stem Cell in Pancreatic Cancer. Cancers 2018, 10, 33.
- Santamaria, S.; Delgado., M.; Kremer., L.; Garcia-Sanz, J.A. Will a mAb-Based Immunotherapy Directed against Cancer Stem Cells Be Feasible? Front. Immunol. 2017, 8, 1509.
- Plaks, V.; Kong, N.; Werb, Z. The cancer stem cell niche: How essential is the niche in regulating stemness of tumor cells? Cell Stem Cell 2015, 16, 225–238.
- Dawood, S.; Austin, L.; Cristofanilli, M. Cancer stem cells: Implications for cancer therapy. Oncology 2014, 28, 1101–1107, 1110.
- Lei, Y.; Zhang, D.; Yu, J.; Dong, H.; Zhang, J.; Yang, S. Targeting autophagy in cancer stem cells as an anticancer therapy. Cancer Lett. 2017, 393, 33–39.
- Cojoc, M.; Mäbert, K.; Muders, M.H.; Dubrovska, A. A role for cancer stem cells in therapy resistance: Cellular and molecular mechanisms. Semin. Cancer Biol. 2015, 31, 16–27.
- Dalla Pozza, E.; Dando, I.; Biondani, G.; Brandi, J.; Costanzo, C.; Zoratti, E.; Fassan, M.; Boschi, F.; Melisi, D.; Cecconi, D.; et al. Pancreatic ductal adenocarcinoma cell lines display a plastic ability to bidirectionally convert into cancer stem cells. Int. J. Oncol. 2015, 46, 1099–1108.
- Kalluri, R.; Weinberg, R.A. The basics of epithelial mesenchymal transition. J. Clin. Investig. 2009, 119, 1420–1428.
- Felipe Lima, J.; Nofech-Mozes, S.; Bayani, J.; Bartlett, J.M.S. EMT in breast carcinoma—A review. J. Clin. Med. 2016, 5, 65.
- Lamouille, S.; Xu, J.; Derynck, R. Molecular mechanisms of epithelial–mesenchymal transition. Nat. Rev. Mol. Cell Biol. 2014, 15, 178–196.
- Iacobuzio-Donahue, C.A.; Fu, B.; Yachida, S.; Luo, M.; Abe, H.; Henderson, C.M.; Vilardell, F.; Wang, Z.; Keller, J.W.; Banerjee, P.; et al. DPC4 gene status of the primary carcinoma correlates with patterns of failure in patients with pancreatic cancer. J. Clin. Oncol. 2009, 27, 1806–1813.
- Winter, J.M.; Ting, A.H.; Vilardell, F.; Gallmeier, E.; Baylin, S.B.; Hruban, R.H.; Kern, S.E.; Iacobuzio-Donahue, C.A. Absence of E-cadherin expression distinguishes noncohesive from cohesive pancreatic cancer. Clin. Cancer Res. 2008, 14, 412–418.
- Renz, B.W.; D’Haese, J.G.; Werner, J.; Westphalen, C.B.; Ilmer, M. Repurposing Established Compounds to Target Pancreatic Cancer Stem Cells (CSCs). Med. Sci. 2017, 5, 14.
- Arumugam, T.; Ramachandran, V.; Fournier, K.F.; Wang, H.; Marquis, L.; Abbruzzese, J.L.; Gallick, G.E.; Logsdon, C.D.; McConkey, D.J.; Choi, W. Epithelial to mesenchymal transition contributes to drug resistance in pancreatic cancer. Cancer Res. 2009, 69, 5820–5828.
- Buck, E.; Eyzaguirre, A.; Barr, S.; Thompson, S.; Sennello, R.; Young, D.; Iwata, K.K.; Gibson, N.W.; Cagnoni, P.; Haley, J.D. Loss of homotypic cell adhesion by epithelial-mesenchymal transition or mutation limits sensitivity to epidermal growth factor receptor inhibition. Mol. Cancer Ther. 2007, 6, 532–541.
- Maier, H.J.; Schmidt-Strassburger, U.; Huber, M.A.; Wiedemann, E.M.; Beug, H.; Wirth, T. NF-kappaB promotes epithelial-mesenchymal transition, migration and invasion of pancreatic carcinoma cells. Cancer Lett. 2010, 295, 214–228.
- Uysal-Onganer, P.; Kawano, Y.; Caro, M.; WalkeR, M.M.; Diez, S.; Darrington, R.S.; Waxman, J.; Kypta, R.M. Wnt-11 promotes neuroendocrine-like differentiation, survival and migration of prostate cancer cells. Mol. Cancer. 2010, 9, 55.
- Arisan, E.D.; Rencuzogullari, O.; Freitas, I.L.; Radzali, S.; Keskin, B.; Kothari, A.; Warford, A.; Uysal-Onganer, P. Upregulated Wnt-11 and miR-21 Expression Trigger Epithelial Mesenchymal Transition in Aggressive Prostate Cancer Cells. Biology 2020, 9, 52.
- Guo, X.; Wang, X.F. Signaling cross-talk between TGF-beta/BMP and other pathways. Cell Res. 2009, 19, 71–88.
- Wang, L.; Yao, M.; Fang, M.; Zheng, W.J.; Dong, Z.Z.; Pan, L.H.; Zhang, H.J.; Yao, D.F. Expression of hepatic Wnt5a and its clinicopathological features in patients with hepatocellular carcinoma. Hepatobiliary Pancreat. Dis. Int. 2018, 17, 227–232.
- Wang, X.; Liu, D.; Zhou, K.; Wang, B.; Liu, Q.; Deng, F.; Li, Q.; Ma, Y. Expression of Wnt-11 and Rock2 in esophageal squamous cell carcinoma by activation of the WNT/PCP pathway and its clinical significance. Pathol. Res. Pract. 2016, 212, 880–885.
- Hotz, B.; Arndt, M.; Dullat, S.; Bhargava, S.; Buhr, H.J.; Hotz, H.G. Epithelial to mesenchymal transition: Expression of the regulators snail, slug, and twist in pancreatic cancer. Clin. Cancer Res. 2007, 13, 4769–4776.
- De Craene, B.; Berx, G. Regulatory networks defining EMT during cancer initiation and progression. Nat. Rev. Cancer 2013, 13, 97–110.
- Fedele, M.; Cerchia, L.; Chiappetta, G. The Epithelial-to-Mesenchymal Transition in Breast Cancer: Focus on Basal-Like Carcinomas. Cancers 2017, 9, 134.
- Klymkowsky, M.W.; Savagner, P. Epithelial-mesenchymal transition: A cancer researcher’s conceptual friend and foe. Am. J. Pathol. 2009, 174, 1588–1593.
- Traub, P.G.; Perides, G.; Scherbarth, A.; Traub, U. Tenacious binding of lipids to vimentin during its isolation and purification from Ehrlich ascites neoplastic cells. FEBS Lett. 1985, 193, 217–221.
- Naito, Y.; Iacobuzio-Donahue, C.A. Biomarker profiles associated with metastatic pancreatic cancer. Mod. Pathol. 2010, 23, 366A.
- Javle, M.M.; Gibbs, J.F.; Iwata, K.K.; Pak, Y.; Rutledge, P.; Yu, J.; Black, J.D.; Tan, D.; Khoury, T. Epithelial-mesenchymal transition (EMT) and activated extracellular signal-regulated kinase (p-Erk) in surgically resected pancreatic cancer. Ann. Surg. Oncol. 2007, 14, 3527–3533.
- Shibue, T.; Weinberg, R.A. EMT, CSCs, and drug resistance: The mechanistic link and clinical implications. Nat. Rev. Clin. Oncol. 2017, 14, 611–629.
- Rhim, A.D.; Mirek, E.T.; Aiello, N.M.; Maitra, A.; Bailey, J.M.; McCallister, F.; Reichert, M.; Beatty, G.L.; Rustgi, A.K.; Vonderheide, R.H.; et al. EMT and dissemination precede pancreatic tumor formation. Cell 2012, 148, 349–361.
- Rao, C.V.; Mohammed, A. New insights into pancreatic cancer stem cells. World J. Stem Cells 2015, 7, 547–555.
- Chalquest, R.R. Preveterinary requirements and admission to American veterinary colleges: Important changes. J. Am. Vet. Med. Assoc. 1986, 189, 27–29.
- Kure, S.; Matsuda, Y.; Hagio, M.; Ueda, J.; Naito, Z.; Ishiwata, T. Expression of cancer stem cell markers in pancreatic intraepithelial neoplasias and pancreatic ductal adenocarcinomas. Int. J. Oncol. 2012, 41, 1314–1324.
- Hruban, R.H.; Adsay, N.V.; Albores-Saavedra, J.; Anver, M.R.; Biankin, A.V.; Boivin, G.P.; Furth, E.E.; Furukawa, T.; Klein, A.; Klimstra, D.S.; et al. Pathology of genetically engineered mouse models of pancreatic exocrine cancer: Consensus report and recommendations. Cancer Res. 2006, 66, 95–106.
- Oshima, Y.; Suzuki, A.; Kawashimo, K.; Ishikawa, M.; Ohkohchi, N.; Taniguchi, H. Isolation of mouse pancreatic ductal progenitor cells expressing CD133 and c-Met by flow cytometric cell sorting. Gastroenterology 2007, 132, 720–732.
- Wang, V.M.Y.; Ferreira, R.M.M.; Almagro, J.; Evan, T.; Legrave, N.; Zaw Thin, M.; Frith, D.; Carvalho, J.; Barry, D.J.; Snijders, A.P.; et al. CD9 identifies pancreatic cancer stem cells and modulates glutamine metabolism to fuel tumour growth. Nat. Cell Biol. 2019, 21, 1425–1435.
- Lee, S.H.; Kim, H.; Hwang, J.-H.; Shin, E.; Lee, H.S.; Hwang, D.W.; Cho, J.Y.; Yoon, Y.S.; Han, H.S.; Cha, B.H. CD24 and S100A4 expression in resectable pancreatic cancers with earlier disease recurrence and poor survival. Pancreas 2014, 43, 380–388.
- Liu, Y.; Wu, T.; Lu, D.; Zhen, J.; Zhang, L. CD44 overexpression related to lymph node metastasis and poor prognosis of pancreatic cancer. Int. J. Biol. Markers 2018, 33, 308–313.
- Li, X.; Zhao, H.; Gu, J.; Zheng, L. Prognostic value of cancer stem cell marker CD133 expression in pancreatic ductal adenocarcinoma (PDAC): A systematic review and meta-analysis. Int. J. Clin. Exp. Pathol. 2015, 8, 12084–12092.
This entry is offline, you can click here to edit this entry!