The discussion on local food has been gaining attention in recent years, but there is still a lack of clear understanding of the term ‘local food’ in the literature. The relationship between local food and sustainability issues is still unclear and has various connotations. This discordance leads to further discussions on whether buying local food should be considered a sustainable behavior and whether consumer preference for local food can be perceived as a sustainable practice. A scoping literature review was conducted in order to fill this gap and to shed light on the main tendencies of the scientific literature regarding this topic.
1. Introduction
Improving the quality of life of the population and introducing sustainable practices into people’s daily life has appeared on the agenda of global society [
1]. Access to healthy food and the introduction of sustainable nutrition practices are two important challenges today. The growing interest in sustainable practices and high-quality and healthy products is reflected in the UN Sustainable Development Goals (SDGs): goal 2, ‘end hunger, achieve food security and improved nutrition and promote sustainable agriculture’ [
2]. Support of short food supply chains (SFSC) may be one of the solutions to achieve this goal. SFSCs are considered as drivers of sustainable development, as they increase sustainability in all its dimensions; they reduce economic uncertainties, ensure fairness and trust between consumers and producers, and minimize pollution [
3]. SFSCs are often associated with the concept of ‘local food’ and ‘local food systems’ but the connection between these concepts remains unclear [
3,
4,
5]. Furthermore, the factors influencing consumer preference towards local food have obtained limited attention among scholars [
6].
The application of sustainable practices is important and beneficial for SFSC stakeholders: producers, buying organizations, local governments, and consumers. Indeed, local food has been promoted by governmental and civil society organizations for decades [
7]. Raising awareness of local food consumption as a sustainable practice among stakeholders could contribute to the further promotion of local food production and distribution.
The COVID-19 pandemic has brought new challenges for food security and social and economic systems, but at the same time, it has provided opportunities for local food production. The Food and Agriculture Organization of the United Nations (FAO) has conducted a survey among different cities in order to monitor local food system status during the COVID-19 pandemic. About 40 percent of the cities that responded to the survey indicated that restrictive measures on human mobility introduced during the pandemic have led to a shortage of labor in local agriculture and food-related activities. The respondents further stated that the shortage of labor negatively affected local food production [
8]. In this report, the FAO identified five main areas to support local food production and create resilient local food systems. One of these areas is promotion of local food production and providing SFSCs with a greater degree of self-sufficiency. The new barriers to, and opportunities for, local food production during the COVID-19 pandemic have been studied in the scientific literature. The COVID-19 pandemic has forced both customers and restaurants to shift their food habits to more locally grown products; therefore, purchasing local food products has become one of the most notable sustainable practices [
9]. The COVID-19 pandemic will have long-lasting effects on food supply chains, including the growth of online grocery shopping and the extent to which consumers will prioritize ‘local’ food supply chains [
10]. While in some countries the COVID-19 pandemic significantly restricted local food systems and created more food insecurity, in other countries local food systems continued to operate and were even strengthened by higher social capital and adaptive capacities [
11].
2. Study Characteristics
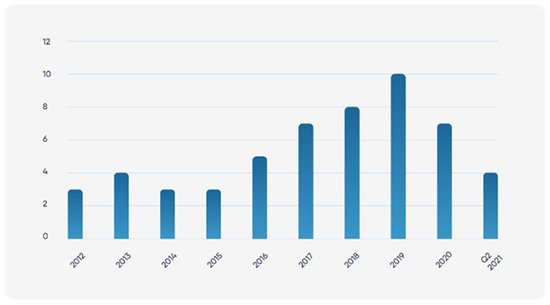
The literature retrieved shows a steady growing trend of the research in the field of consumers’ preference for local food starting from 2016 (Figure 1). Although researchers observe a slight decrease in the studies in the year 2020, the decrease can be explained by the COVID-19 pandemic. Given that almost all the studies were conducted using surveys the lockdowns made it impossible to conduct the research properly. The literature sample comprises 2 quarters of the year 2021 and as researchers can see the number of literature publications in 6 month of 2021, researchers may expect that the total number of the studies in 2021 will approach the pre-COVID period.
Figure 1. Literature publications per year.
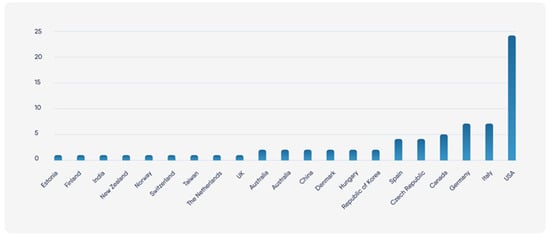
Figure 2 shows the distribution of the literature works by the countries which the researchers whose papers researchers examined in this study belong. The leader of research on consumer preference for local food is the USA, with 24 papers on the topic. Italy and Germany have seven papers each, which make them European leaders in research in the field of consumer preference for local food. Researchers also observed the presence of research from Canada (5 papers), and Czech Republic and Spain (4 papers).
Figure 2. Distribution of the literature by country.
The authors of this research found it interesting to track the distribution of food types by country. In order to do so, researchers collected the food types discussed in the literature and matched them with the countries where the research was conducted. As can be observed from Table 1, there is no dependence of the food type on geography, except for Guadeloupe (yams) and India (mung bean), who considered these products as indigenous. The USA and Germany had the widest range of studied products. This evidence is apt, as the USA and Germany are the leaders in research on this topic.
Table 1. Food type distribution by country.
| |
Australia |
Canada |
Denmark |
Estonia |
Finland |
Germany |
Guadeloupe |
Hungary |
India |
Italy |
New Zealand |
Spain |
USA |
| apples |
|
|
/ |
/ |
|
/ |
|
|
|
|
|
|
/ |
| beef |
|
/ |
|
|
|
|
|
|
|
|
|
|
|
| beef salami |
|
|
/ |
|
|
|
|
|
|
|
|
|
|
| beer |
|
|
|
|
|
/ |
|
|
|
|
|
|
|
| blackberry jam |
|
|
|
|
|
|
|
|
|
|
|
|
/ |
| bread |
|
|
|
|
|
/ |
|
|
|
|
|
|
|
| broccoli |
|
|
|
|
|
|
|
|
|
|
|
|
/ |
| butter |
|
|
|
|
|
/ |
|
|
|
|
|
|
|
| chicken breasts |
/ |
|
|
|
|
|
|
|
|
|
|
|
/ |
| clams |
|
|
|
|
|
|
|
|
|
|
|
|
/ |
| craft beer |
|
|
|
|
|
|
|
|
|
|
|
|
/ |
| eggs |
|
|
/ |
|
|
/ |
|
|
|
|
|
|
/ |
| flour |
|
|
|
|
|
/ |
|
|
|
|
|
|
|
| fresh lamb meat |
|
|
|
|
|
|
|
|
|
|
|
/ |
|
| fruit yogurt |
/ |
|
|
|
|
|
|
|
|
|
|
|
|
| garlic |
|
|
|
|
|
|
|
|
|
|
/ |
|
|
| hard apple cider |
|
|
|
|
|
|
|
|
|
|
|
|
/ |
| honey |
|
|
|
|
|
|
|
/ |
|
/ |
|
|
|
| ketchup |
|
|
|
|
|
/ |
|
|
|
|
|
|
|
| lemons |
|
|
|
|
|
|
|
|
|
|
/ |
|
|
| lettuce |
|
|
|
|
|
|
|
|
|
|
|
|
/ |
| milk |
|
|
/ |
|
|
/ |
|
|
|
/ |
|
|
/ |
| mung bean |
|
|
|
|
|
|
|
|
/ |
|
|
|
|
| mussels |
|
|
|
|
|
|
|
|
|
|
|
|
/ |
| oysters |
|
|
|
|
|
|
|
|
|
|
|
|
/ |
| pork |
|
|
|
|
/ |
|
|
|
|
|
|
|
|
| pork chops |
|
|
|
|
|
|
|
|
|
|
|
|
/ |
| pork cutlet |
|
|
|
|
|
/ |
|
|
|
|
|
|
|
| rice |
|
|
|
|
|
|
|
|
|
/ |
|
|
|
| saffron |
|
|
|
|
|
|
|
|
|
|
|
/ |
|
| scallops |
|
|
|
|
|
|
|
|
|
|
|
|
/ |
| seaweed salad |
|
|
|
|
|
|
|
|
|
|
|
|
/ |
| steak |
|
|
|
|
|
/ |
|
|
|
|
|
|
|
| strawberries |
|
|
|
|
|
|
|
|
|
|
|
|
/ |
| tomatoes |
|
|
|
|
|
/ |
|
|
|
|
/ |
|
/ |
| wine |
|
|
|
|
|
/ |
|
|
|
|
|
|
|
| yams |
|
|
|
|
|
|
/ |
|
|
|
|
|
|
Table 2 represents the distribution of the keywords used in the studied papers by frequency, in a numerical expression and in percentage. A significant finding of this analysis was that the only keywords that included the word ‘sustainable’ or its derivatives were ‘sustainable food’, which was mentioned twice [
20,
21] in the studied literature, which amounts to ‘sustainable food’ only being included in 3.92% of all the keywords used; and with ‘sustainability’ being mentioned three times, 5.88% [
22,
23]. This outcome underlines that sustainable issues were not widely studied in the literature sample.
Table 2. Distribution of the keywords by frequency.
| Word Combination |
Frequency |
% |
Rank |
| local food |
29 |
56.86 |
1 |
| willingness to pay |
14 |
27.45 |
2 |
| consumer preferences |
13 |
25.49 |
3 |
| organic |
13 |
25.49 |
3 |
| choice experiment |
11 |
21.57 |
5 |
| analysis |
7 |
13.73 |
6 |
| attributes |
6 |
11.76 |
7 |
| consumer behavior |
5 |
9.80 |
8 |
| consumer preference |
4 |
7.84 |
9 |
| local foods |
4 |
7.84 |
9 |
| oysters |
4 |
7.84 |
9 |
| regional food |
4 |
7.84 |
9 |
| latent class |
3 |
5.88 |
13 |
| marketing |
3 |
5.88 |
13 |
| perception |
3 |
5.88 |
13 |
| product |
3 |
5.88 |
13 |
| sustainability |
3 |
5.88 |
13 |
| branding program |
2 |
3.92 |
18 |
| choice experiments |
2 |
3.92 |
18 |
| choice-based conjoint analysis |
2 |
3.92 |
18 |
| cider |
2 |
3.92 |
18 |
| class segmentation |
2 |
3.92 |
18 |
| component analysis |
2 |
3.92 |
18 |
| conjoint analysis |
2 |
3.92 |
18 |
| consumer behavior |
2 |
3.92 |
18 |
| consumer demand |
2 |
3.92 |
18 |
| country of origin |
2 |
3.92 |
18 |
| credence attributes |
2 |
3.92 |
18 |
| discrete choice experiment |
2 |
3.92 |
18 |
| economics |
2 |
3.92 |
18 |
| experiments |
2 |
3.92 |
18 |
| farm |
2 |
3.92 |
18 |
| farmers |
2 |
3.92 |
18 |
| field experiment |
2 |
3.92 |
18 |
| food miles |
2 |
3.92 |
18 |
| food origin |
2 |
3.92 |
18 |
| food system |
2 |
3.92 |
18 |
| health |
2 |
3.92 |
18 |
| horticulture |
2 |
3.92 |
18 |
| latent class segmentation |
2 |
3.92 |
18 |
| logistic regression |
2 |
3.92 |
18 |
| market |
2 |
3.92 |
18 |
| organic production |
2 |
3.92 |
18 |
| price |
2 |
3.92 |
18 |
| principal component analysis |
2 |
3.92 |
18 |
| production |
2 |
3.92 |
18 |
| quality perception |
2 |
3.92 |
18 |
| seafood |
2 |
3.92 |
18 |
| supply chain |
2 |
3.92 |
18 |
| sustainable food |
2 |
3.92 |
18 |
| tomatoes |
2 |
3.92 |
18 |
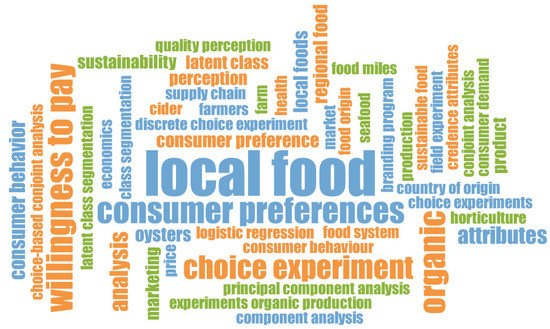
Figure 3 represents a word cloud of the keywords of the studied papers. As in Table 3, researchers see the common presence of the keyword combinations ‘local food’, ‘consumer preferences’, and ‘willingness to pay’, which is obvious for this research, since these keywords were used to retrieve the sample. Other noticeable keywords are related to the research and analysis methods applied in the studies: ‘choice experiment’, ‘principal component analysis’, and ‘logistic regression’. Another interesting finding was the frequent presence of the keyword ‘organic’, which stresses the link between local and organic food concepts, and which researchers will discuss later in the paper.
Figure 3. Keyword word cloud.
Table 3. Research method.
| Paper |
Methodology |
| Holmes and Yan 2012 [24] |
hypothetical choice experiment |
| Lesschaeve et al. 2012 [25] |
online survey |
| Carroll et al. 2012 [26] |
choice experiment |
| Grebitus et al. 2013 [27] |
experimental auction, non-hypothetical Vickrey auction |
| Kalabova et al. 2013 [28] |
online/offline questionnaire survey |
| Rikkonen et al. 2013 [29] |
online questionnaires or/and phone interviews |
| Tempesta and Vecchiato 2013 [30] |
choice experiment |
| Denver and Jensen 2014 [31] |
choice experiment |
| Gracia 2014 [32] |
real choice experiment |
| Moor et al. 2014 [33] |
Survey |
| Barlagne et al. 2015 [34] |
an economic experiment |
| Hasselbach and Roosen 2015 [35] |
Interviews |
| Meas et al. 2015 [36] |
choice experiment |
| Aprile et al. 2016 [37] |
Survey |
| Hempel and Hamm 2016a [38] |
survey, choice experiment |
| Hempel and Hamm 2016b [39] |
offline survey, choice experiment |
| Lim and Hu 2016 [40] |
choice experiment |
| Schifani et al. 2016 [41] |
face-to-face questionnaire |
| Berg and Preston, 2017 [42] |
online and offline survey |
| Ferrazzi et al. 2017 [43] |
Survey |
| Kecinski et al. 2017 [44] |
dichotomous choice field experiment |
| Mugera et al. 2017 [45] |
random utility discrete choice model framework |
| Palmer et al. 2017 [46] |
focus groups, survey |
| Sanova et al., 2017 [47] |
Survey |
| Singh et al. 2017 [48] |
semi-structured and structured interviews |
| Arsil et al. 2018 [49] |
Survey |
| Brayden et al. 2018 [50] |
online survey, choice experiment |
| Byrd et al. 2018 [51] |
online survey, choice experiments |
| Hashem et al. 2018 [52] |
semi-structured interviews, survey |
| Picha and Skorepa 2018 [22] |
Survey |
| Picha et al. 2018 [53] |
offline survey |
| Printezis and Grebitus 2018 [54] |
hypothetical online choice experiment |
| Wenzig and Gruchmann 2018 [55] |
Survey |
| Annunziata et al. 2019 [20] |
self-administered questionnaire |
| Denver et al. 2019 [56] |
quantitative survey, choice experiment |
| Fan et al. 2019 [57] |
economic experiment |
| Farris et al. 2019 [58] |
discrete choice experiment |
| Meyerding and Trajer 2019 [59] |
survey, choice experiment |
| Meyerding et al. 2019 [60] |
survey, choice experiment |
| Profeta and Hamm 2019 [61] |
Interviews |
| Richard and Pivarnik 2019 [62] |
Survey |
| Skallerud and Wien 2019 [63] |
Survey |
| Werner et al. 2019 [64] |
focus groups |
| Chen et al. 2020 [21] |
online survey |
| Kiss et al. 2020 [65] |
online survey |
| Li et al. 2020a [66] |
framed field experiment |
| Li et al. 2020b [67] |
incentive-compatible framed field experiment |
| Oravecz et al. 2020 [68] |
personal interview by a paper-based questionnaire with open and decisive questions |
| Sanjuan-Lopez and Resano-Ezcaray 2020 [23] |
hypothetical and real choice experiments |
| Yang and Leung 2020 [69] |
hedonic price model |
| Attalah et al. 2021 [70] |
choice experiment |
| He et al. 2021 [71] |
Experiment |
| Jensen et al. 2021 [72] |
online survey |
| Moreno and Malone 2021 [73] |
a discrete choice experiment, the open-ended survey |
Table 3 shows the methodologies applied in the studied literature. Since, all the articles studied consumer preferences for local food, in most of the cases, quantitative methods of analysis were applied: offline and online consumer surveys with open-end and closed-end questions and choice experiments. Some research works applied qualitative methods, such as focus groups and interviews, in order to gather evidence.
This entry is adapted from the peer-reviewed paper 10.3390/su14020772