Head and neck squamous cell carcinoma (HNSCC) comprises the majority of tumors in head and neck tissues. The prognosis of HNSCC has not significantly improved for decades, signifying the need for new diagnostic and therapeutic targets. Recent evidence suggests that oral microbiota is associated with carcinogenesis.
- Oral Microbiota
- Head and Neck Cancers
- oral cancer
- cancer
- tumor
- squmaous cell carcinoma
- microbiota
1. Introduction
2. Oral Microbiota in Head and Neck Cancers
| Study | Method | Sampling Type | Number of Samples | Microbiota Type | Microbiota Characterization |
|---|---|---|---|---|---|
| [18] | DNA-DNA hybridization | Whole unstimulated saliva through expectoration | 274 (229 OSCC-free controls; 45 OSCC) | 40 common oral bacteria were tested | Digoxigenin-labeled DNA using random primer technique was used |
| [44] | IHC | Tissue biopsy, PEFF | 15 (5 normal tissue; 10 GSCC) | P. gingivalis; S. gordonii | Rabbit polyclonal antibodies (1:1000) |
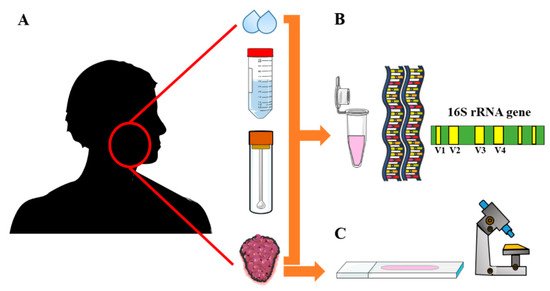
| [19] | 16S rRNA PCR | Stimulated saliva | 5 (2 matched non-OSCC controls; 3 OSCC) | Total bacterial diversity and relative abundance | PCR primers were based on the V4–V5 hypervariable region |
| [20] | 16S rRNA PCR | DNA extraction from tissue biopsy samples | 20 (10 tumor-free tissues from OSCC patients; 10 OSCC) | Total bacterial diversity and relative abundance | PCR primers for V4–V5 hypervariable region; the eubacterial primers: prbac1 and prbac2 |
| [41] | 16S rRNA PCR | Swab samples from normal controls and lesions | 83 (49 normal controls; 34 OSCC/OPMDs) | Total bacterial diversity and relative abundance | 16S rDNA V4 hypervariable region were sequenced using the Illumina MiSeq platform |
| [21] | 16S rRNA PCR | Oral rinse samples | 363 (242 normal controls; 121 OSCC/OPSCC cases) | Total bacterial diversity and relative abundance | The Illumina MiSeq primers targeting the V4 variable region |
| [22] | 16S rRNA PCR | Unstimulated saliva | 376 (127 normal controls; 124 OPMDs; 125 OSCC) | Total bacterial diversity and relative abundance | The PCR primer pair (F515/ R806) targeting the V4 region of bacterial 16S rDNA |
| [42] | 16S rRNA PCR | Swab samples from normal controls and lesions | 27 (9 normal controls; 9 OPMDs; 9 cancer) | Total bacterial diversity and relative abundance | The primer pair D88/E94 produced near full length of 16S amplicons (targets V6–V9) |
| [47] | 16S rRNA PCR | Paired normal and tumoral resection specimens | 242 (121 tumor-free controls; 121 tumors) | Total bacterial diversity and relative abundance | PCR of the V1–V4 hypervariable regions of the 16S rRNA gene using the M13 primers |
| [23] | 16S rRNA PCR | Swab samples from normal controls and lesions | 80 (40 anatomically matched normal controls; 40 OSCC) | Total bacterial diversity and relative abundance | The PCR primer pair (515F/926R) targeting the V4–V5 regions using Illumina MiSeq tool |
| [48] | 16S rRNA PCR | Mouth wash samples | 383 (254 matched normal controls; 129 HNSCC) | Total bacterial diversity and relative abundance | The PCR primer pair (347F/803R) targeting the V3–V4 variable regions of the 16S rRNA |
| [24] | 16S rRNA PCR | Unstimulated saliva; peripheral blood (genotyping) | 289 (151 matched controls; 138 OSCC) | 20 species were included for case–control comparison | The PCR primer pair (341F/926R) targeting the V3–V5 regions of the 16S rRNA |
| [45] | 16S rRNA PCR | Oral rinse samples | 83 (20 normal controls; 11 high-risk; 52 tumors) | Total bacterial diversity and relative abundance | The PCR primer pair (515F/806R) targeting the V4 variable region of the 16S rRNA |
| [25] | 16S rRNA PCR | Tissue biopsy samples | 52 (27 oral fibroepithelial polyp as controls; 25 OSCC) |
Total bacterial diversity and relative abundance | The PCR primer pair (27FYMF/519R) targeting the V1-V3 regions of the 16S rRNA |
| [50] | 16S rRNA PCR | Unstimulated whole saliva | 30 (7 healthy controls; 9 dental compromised; 14 HNSCC) | Total bacterial diversity and relative abundance | The PCR primer pair (341F/806R) targeting the V3–V4 variable regions of the 16S rRNA |
| [26] | 16S rRNA PCR | Oral rinse samples | 248 (51 healthy individuals; 197 OSCC) | Total bacterial diversity and relative abundance | The PCR primer pair (16SF/16SR) targeting the V3–V4 variable regions of the 16S rRNA |
| [27] | 16S rRNA PCR | Unstimulated saliva samples | 39 (OSCC) | Total bacterial diversity and relative abundance | The PCR primers (F515/R806) targeting the V4 region of the 16S rRNA |
| [28] | RNA amplification | Oral swab samples | 15 (4 OSCC; 11 OSCC-free sites/healthy individuals) | Active communities in tumor/tumor-free areas | Illumina adapter-specific primers were used to amplify the cDNA generated from mRNA |
| [29] | 16S rRNA PCR | Oral rinse samples | 38 (12 thyroid nodules as controls; 18 OSCC; 8 OPMDs) | Total bacterial diversity and relative abundance | The PCR primer pair (347F/803R) targeting the V3–V4 variable regions of the 16S rRNA |
| [30] | 16S rRNA PCR | Unstimulated saliva samples | 16 (4 healthy controls; 6 OSCC; 6 OPMDs) | Total bacterial diversity and relative abundance | The PCR primers (F515/R806) targeting the V4 gene region of the 16S rRNA |
| [43] | 16S rRNA PCR | Cytobrush (control); Tissue biopsy (OPSCC) | 52 (26 OPSCC; 26 controls) | P. melanogenica, F. naviforme, S. anginosus | Species-specific construct was designed that contained analyzed bacteria sequences |
| [31] | 16S rRNA PCR | Stimulated saliva samples | 140 (80 non-cancer controls; 60 OSCC) | Total bacterial diversity and relative abundance | PCR primers were developed for V3–V4 region of the 16S rRNA gene |
| [32] | 16S rRNA PCR | Oral swabs from tumor and normal tissues | 100 (50 from non-tumor sites; 50 tumors) | Total bacterial diversity and relative abundance | The PCR primer pair (338F/806R) targeting the V3–V4 variable regions of the 16S rRNA |
| [49] | 16S rRNA PCR | Oral rinse samples; Tissue biopsy | 272 (136 non-tumor controls; 136 tumor samples) | Total bacterial diversity and relative abundance | The PCR primer pair (341F/806R) targeting the V3–V4 variable regions of the 16S rRNA |
| [46] | 16S rRNA PCR | Saliva samples | 994 (495 healthy controls; 499 patients with NPC) | Total bacterial diversity and ASVs prevalence | The PCR primer pair (341F/805R) targeting the V3–V4 variable regions of the 16S rRNA |
| [33] | 16S rRNA PCR | Unstimulated whole mouth fluid | 74 (23 healthy controls; 31 OSCC; 20 OPMDs) | Total bacterial diversity and relative abundance | The PCR primer pair (319F/806R) targeting the V3–V4 variable regions of the 16S rRNA |
| [34] | 16S rRNA PCR | Saliva samples; Tissue biopsy | 59 (18 non-tumor tissues;18 tumor tissue; 23 OSCC saliva) | Total bacterial diversity and relative abundance | Adaptor-ligated 16S primers targeting the V4 region of the 16S rRNA gene fragment |
| [35] | 16S rRNA PCR | Tissue biopsy samples | 48 (24 paracancerous control tissues; 24 tumor tissues) | Total bacterial diversity and relative abundance | The PCR primer pair (341F/806R) targeting the V3–V4 variable regions of the 16S rRNA |
| [51] | 16S rRNA PCR | Unstimulated saliva samples | 120 (64 healthy controls; 56 from cancer patients) | Total bacterial diversity and relative abundance | The PCR primer pair (341F/806R) targeting the V3–V4 variable regions of the 16S rRNA |
| [36] | 16S rRNA PCR | Unstimulated saliva samples | 24 (8 healthy controls; 16 OSCC) | Total bacterial diversity and relative abundance | The PCR primer pair (515F/806R) targeting the V4 region of the 16S rRNA was used |
| [37] | 16S rRNA PCR, IHC | Tissue biopsy samples | 212 (HNSCC) | F. nucleatum; gram-negative bacteria | A unique PCR primer for F. nucleatum; LPS monoclonal Mouse antibody (clone C8) |
| [38] | 16S rRNA PCR | Unstimulated saliva samples | 49 (24 healthy controls; 25 OSCC) | Total bacterial diversity and relative abundance | The PCR primer pair (16SF/16SR) targeting the V3–V4 variable regions of the 16S rRNA |
| [39] | 16S rRNA PCR | Tissue biopsy samples | 100 (50 paracancerous control tissues; 50 tumor tissues) | Total bacterial diversity and relative abundance | A PCR primer pair targeting the V3–V4 variable regions of the 16S rRNA was used |
| [40] | 16S rRNA PCR | Oral swabs from tumor and normal tissues | 232 (116 contralateral normal tissues, 116 tumor tissues) | Total bacterial diversity and relative abundance | The PCR primer pair (515F/806R) targeting the V4 region of the 16S rRNA was used |
2.1. Oral Microbiota and OPMDs
2.2. Oral Microbiota and OSCC
2.3. Oral Microbiota in Other Types of HNSCC
2.4. Oral Dysbiosis and Tumor Progression in HNSCC
2.6. The Prognostic Value of Oral Microbiota in HNSCC
3. Summary
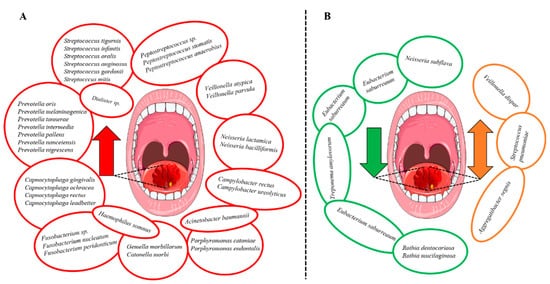
Bacterial genera that were increased in abundance in HNSCC patients included Fusobacterium [26,29,31,32,40], Peptostreptococcus [22,31,32,40], Alloprevotella [29,31,32], Capnocytophaga [31,32,40] and Prevotella [29,34,40]. Additionally, the species Prevotella melaninogenica [18,24], F. nucleatum [24,32,37,40] and Prevotella intermedia [24,32] were increased in HNSCC (Figure 3A). In contrast, certain bacterial genera including Streptococcus [26,29,32,34,40], Haemophilus [26,31], Rothia [31,32,34,36] and Veillonella [32,34,36] were decreased (Figure 3B). However, the findings were not always consistent since Veillonella dispar [24,38], Aggregatibacter segnis [32,38] and S. pneumoniae [34,40] were shown to be both increased and decreased in patients with HNSCC (Figure 3B). Survival outcomes were negatively associated with the decreased abundance of Haemophilus and Rothia. In contrast, genera Fusobacterium and species F. nucleatum were associated with improved survival and lower recurrence rates.
Oral microbiota were shown to be associated with cancers other than HNSCC including lung, colorectal and pancreatic cancers [9,11]. Importantly, carcinogenesis has recently been linked to periodontitis—a chronic inflammation largely mediated by oral dysbiosis [10]. In a recent meta-analysis, periodontitis and periodontal bacteria were associated with an increased incidence of cancer and poor survival rates. Interestingly, authors found that a higher cancer risk was associated with P. gingivalis and P. intermedia but not with F. nucleatum, Tannerella forsythia, Treponema denticola or Aggregatibacter actinomycetemcomitans [10]. Fusobacterium, specifically F. nucleatum, has a strong association to the tumorigenesis of colorectal cancer [52,53,54]. In agreement with this evidence, our review demonstrated that genus Fusobacterium [26,29,31,32,40] and F. nucleatum [24,32,37,40] are connected to HNSCC. However, it was also proposed that abundance of Fusobacterium could have a favorable effect on HNSCC progression and survival [37,49]. Another well-studied species is P. gingivalis, an anaerobic bacteria that has been connected among others to pancreatic cancer [55,56] and OSCC [57,58,59]. Noteworthy, only one study showed a statistically significant evidence of the association between P. gingivalis and HNSCC using immunostaining on tissue samples [44]. This finding raises the question whether stimulated/unstimulated saliva, swabs or tissue samples would represent the most reliable method for analyzing oral microbiota in cancer patients. Data are, however, conflicting in this regard. While unstimulated saliva was considered inferior to stimulated saliva [60,61], another study showed that there are no major differences in their reliability [62].
This entry is adapted from the peer-reviewed paper 10.3390/cancers14010046