Both OH and NH infrared (IR) stretching frequencies have been shown to be good descriptors of hydrogen bonds. Hydrogen bonding is a key parameter for important chemical and biological molecules, not the least in water. However, these resonances may be be difficult to identify in strongly hydrogen bonded cases. Density Functional Theory calculations have become a standard method to calculate IR frequencies. Coupled cluster calculations may predict frequencies accurately but only for small molecules due to the huge computer requirements. For larger molecules DFT methods produce results that with a scaling reproduce most of the infrared spectrum. The exception is in many cases the OH and NH stretching vibrations, as the potential energy well in these cases can be very asymmetric. The DFT calculations may be performed both in the harmonic or the anharmonic approximation. The aim is to give suggestions to the use of functionals, basis sets, harmonic vs. anharmic approximation in the calculations of OH and NH stretching frequencies in a practical manner.
- NH stretching frequencies
- OH stretching frequecies
- harmonic vs. anharmonic
- DFT calculations
Performing DFT calculations of XH (X=O or N) stretching frequencies in hydrogen bonded sytems a number of decisions have to be made: appropriate functional, basis set, harmonic vs. anharmonic approximation, computing time in relation to the size of the molecule. Examples of medium large and large molecules or systems see Fig.1. A different type of large system is a binary alocohol + cyclohexane. [1]

Figure 1. c From Ref. [2]
A recent paper has summarized the methods to calculate IR frequencies in general. [3] In the regime of weak hydrogen bonds Futami et al.[4] calculated the OH stretching frequencies of (R)-1,3-butanediol using the VPT2 approach [5] and the B3LYP/6-311++G(3df,3pd) functional and basis set.
In the same frequency range Medel and Suhm [6] investigated a series of alcolhols as seen. The frequency range is very narrow but very accurate predictions were obtained dividing the alcohols according to primary, ceconday and tertiary (see Figure 2).
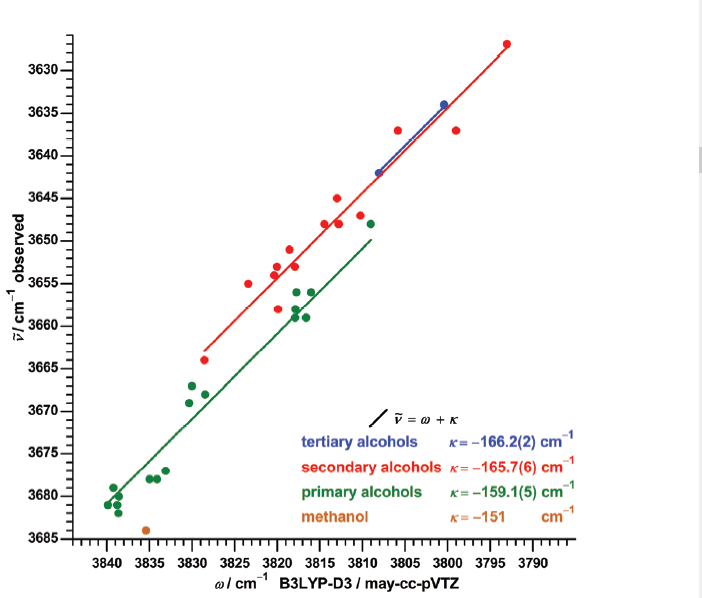 Figure 2. Plot of observed OH stretching frequencies vs. calculated (B3LYP-D3/may-cc-pVTZ) taken from Ref. 6 with permission from Royal Society of Chemistry.
Hansen, Hansen and Spanget-Larsen investigated two different types of hydrogen bonded systems either with OH or RNH groups as hydrogen bond donors. Refs. 7,8,9.
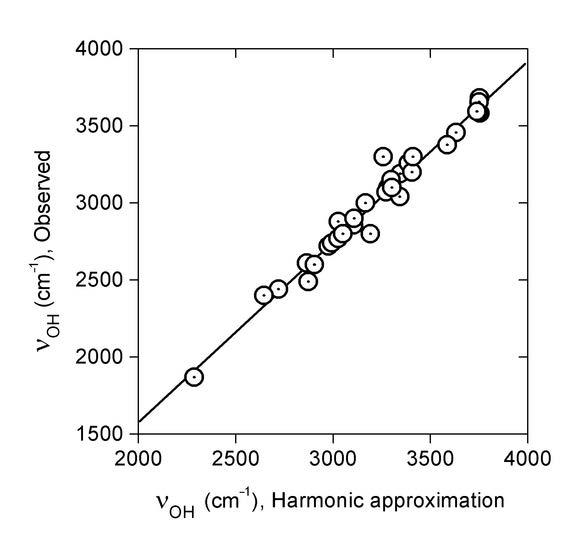
Fig. 3. Linear regression of observed OH stretching wavenumbers νOH (cm-1) on those predicted within the harmonic approximation, B3LYP/6-31G(d). Taken from Ref. 7 with permission from Elsevier.
The regression line of Figure 3 is: νOH{Obsd} = –757 + 1.171*νOH{Harm} (R = 0.985, SD = 74 cm-1). Eq. 1
In case of the -NHR derivatives a non-linear relationship was found (see Figure 4). REF
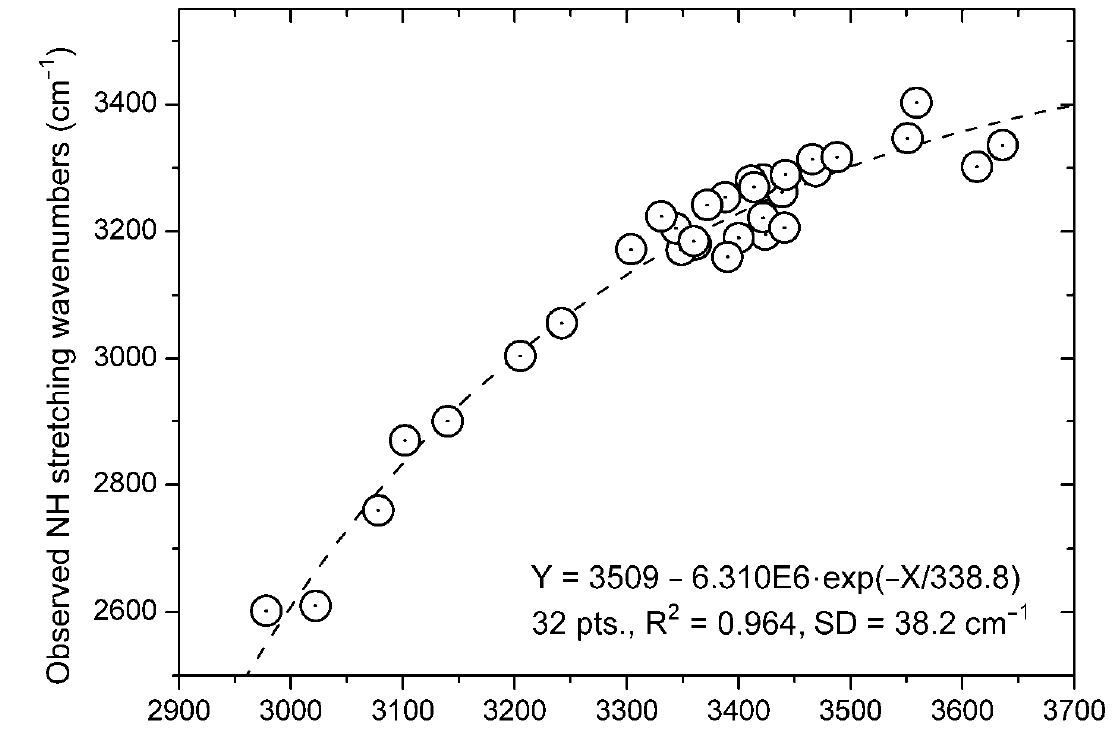
Figure 4. Plot of observed NH stretching frequencies vs. calculated (B3LYP/6-311++G(d,p). Data from Ref. 9 with permission from MDPI.
However, performing the same calculation but with B3LYP/6-31G* gave a correlation:
P(harm) =3470-6.714 x 10(super7) exp(-Harm/270.3). R² = 0.965 and SD= 38.1 cm-¹. Eq.2

Figure 5. Plot of NH stretching frequencies calculated with basis setes. 6-311++G(d,p) vs. 6-31G(d). Data from Ref. 9 with permission from MDPI.
This is very similar to the much higher basis set used in Fig. 5. As a matter of fact, the two types of calculations can be correlated with R²=0.991 and SD = 15 cm-1. Calculations were also performed with the B3PW91. These were linearly correlated to the B3LYP calculations with a R² = 0.9999 and and SD of 2.6 cm-1.
Performing anharmoic calculations in case of the -OH stretching frequencies led to the plot seen in Fig. . A good correlatation is found between the harmonic and the anharmonic data as seen in Figure 6.
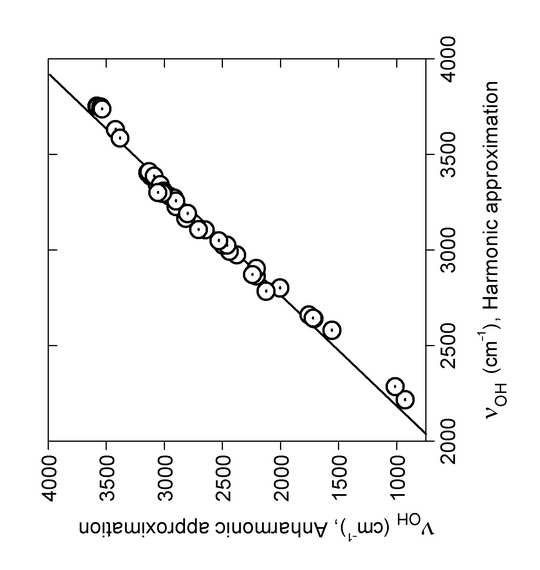 Figure 6. Linear regression of OH stretching wavenumbers νOH (cm-1) calculated in the PT2 anharmonic approximation on the corresponding harmonic wavenumbers, B3LYP/6-31G(d). The regression line is νOH{Anh} = –2791 + 1.732*νOH{Harm} (R = 0.99, SD = 88 cm-1). From Ref. 7 with permission from Elsevier.
In case of the NH stretching frequencies a similar plot is found:
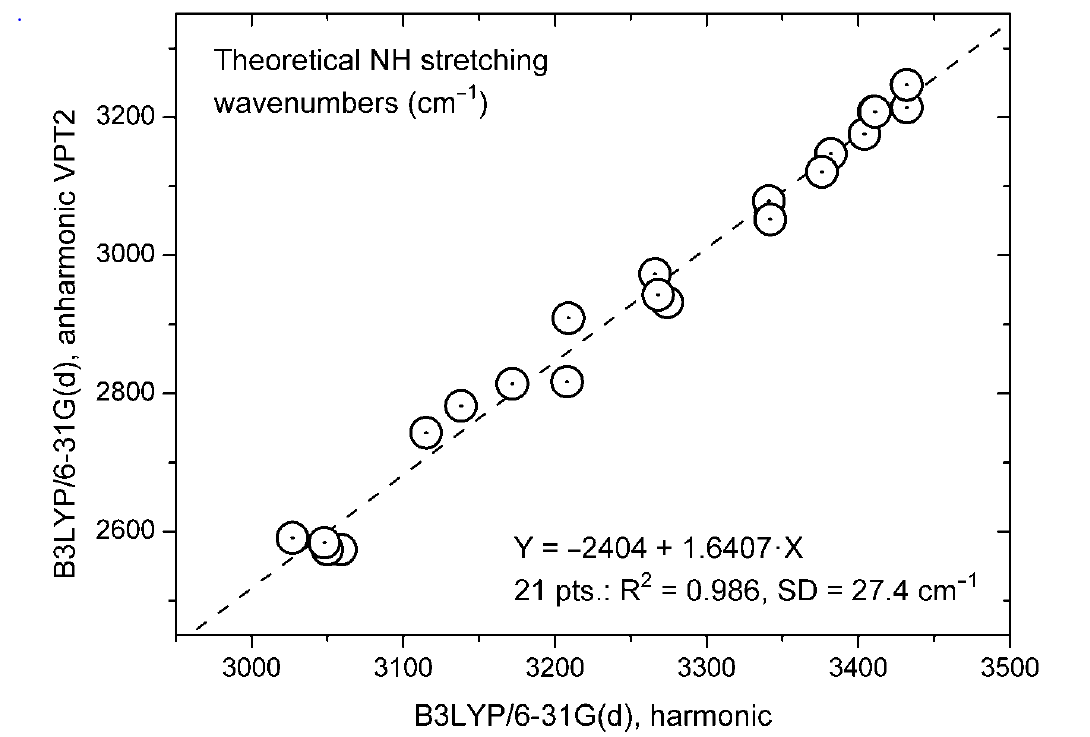
Figure . Plot of NH stretching frequencies anharmonic (VPT2 B3LYP/6-31G(d) vs. the harmonic one. Taken from Ref. 9 with permission from MDPI.
A calculations doing a VPT2 calculation at molecule a in Fig. 1, but with the higher basis set 311++G(d,p) took 28 days using 8 processors and resulted in a predicted NH stretching frequency of 2930 cm-1 as compared to the experimental value of 2760 cm-1.
Considering the use of the simple basis set G(d). A strongly hydrogen bonded example is the enol form of nitromalonamide. PT2 calculations gave 1428 cm-1 [10], whereas the P(harm) prediction gave 1920 cm-1. The latter result was confirmed by using Car-Parrinello and path integral molecular dynamics. [11]
In designing a scheme for prediction of XH stretching frequencies in hydrogen bonded systems, it is important to include molecules with extensive conjugation, steric interations and a range of hydrogen bond strengths varying from very weak to very strong. This has led to the simple equations 1 and 2, which can predict OH and NH stretching frequencies in even very large molecules.
References
- Aseel M. Bala; William G. Killian; Cesar Plascencia; Jackson A. Storer; Andrew T. Norfleet; Lars Peereboom; James E. Jackson; Carl T. Lira; Quantitative Analysis of Infrared Spectra of Binary Alcohol + Cyclohexane Solutions with Quantum Chemical Calculations. The Journal of Physical Chemistry A 2020, 124, 3077-3089, 10.1021/acs.jpca.9b11245.
- Seoncheol Cha; Bogdan Marekha; Manfred Wagner; Johannes Hunger; Hydrogen-Bond Structure and Dynamics of TADDOL Asymmetric Organocatalysts Correlate with Catalytic Activity.. Chemistry – A European Journal 2019, 25, 9984-9990, 10.1002/chem.201901594.
- Qin Yang; Marco Mendolicchio; Vincenzo Barone; Julien Bloino; Accuracy and Reliability in the Simulation of Vibrational Spectra: A Comprehensive Benchmark of Energies and Intensities Issuing From Generalized Vibrational Perturbation Theory to Second Order (GVPT2). Frontiers in Astronomy and Space Sciences 2021, 8, 1-26, 10.3389/fspas.2021.665232.
- Futami, Y.; Minamoto, C.; Kudoh, S.; Anharmonic calculations of frequencies and intensities of O-H stretching vibrations of (R)-1,3-dibutanediol conformers in the fundamentals and first overtones by density functional theory. Spectrochim Acta Part A: Molecualr and Biomolcular Spectroscopy 2018, 197, 251-254, https://doi.org.10.1016/j.saa.2018.02.029.
- Vincenzo Barone; Anharmonic vibrational properties by a fully automated second-order perturbative approach. The Journal of Chemical Physics 2005, 122, 014108, 10.1063/1.1824881.
- Robert Medel; Martin A. Suhm; Predicting OH stretching fundamental wavenumbers of alcohols for conformational assignment: different correction patterns for density functional and wave-function-based methods. Phys. Chem. Chem. Phys. 2021, 23, 5629-5643, 10.1039/d1cp00342a.
- Jens Spanget-Larsen; Bjarke K.V. Hansen; Poul Erik Hansen; OH stretching frequencies in systems with intramolecular hydrogen bonds: Harmonic and anharmonic analyses. Chemical Physics 2011, 389, 107-115, 10.1016/j.chemphys.2011.09.011.
- Poul Erik Hansen; Jens Spanget-Larsen; On prediction of OH stretching frequencies in intramolecularly hydrogen bonded systems. Journal of Molecular Structure 2012, 1018, 8-13, 10.1016/j.molstruc.2012.01.011.
- Poul Erik Hansen; Mohammad Vakili; Fadhil S. Kamounah; Jens Spanget-Larsen; NH Stretching Frequencies of Intramolecularly Hydrogen-Bonded Systems: An Experimental and Theoretical Study. Molecules 2021, 26, 7651, 10.3390/molecules26247651.
- Giuseppe Buemi; Felice Zuccarello; Theoretical study of malonamide and nitromalonamide in vacuum and in water solution. Journal of Molecular Structure: THEOCHEM 2005, 719, 137-148, 10.1016/j.theochem.2004.12.031.
- Piotr Durlak; Krzysztof Mierzwicki; Zdzisław Latajka; Investigations of the Very Short Hydrogen Bond in the Crystal of Nitromalonamide via Car–Parrinello and Path Integral Molecular Dynamics. The Journal of Physical Chemistry B 2013, 117, 5430-5440, 10.1021/jp312473b.