Your browser does not fully support modern features. Please upgrade for a smoother experience.
Please note this is an old version of this entry, which may differ significantly from the current revision.
Subjects:
Agriculture, Dairy & Animal Science
Coccidiosis, which can be induced by Eimeria spp., causes tremendous economic losses in the poultry production. Eimeria tenella (E. tenella) is one of the poultry Eimeria spp. that damage cecal tissue.
- Eimeria tenella
- broiler chickens
1. Background
Coccidiosis causes tremendous economic losses in broiler production by impairing gut health and depressing growth performance and feed efficiency of broiler chickens, and expensive anti-coccidial treatments also increase the overall production cost [1,2]. Avian coccidiosis are induced by Eimeria spp., which are protozoan parasites, and there are 7 known Eimeria spp. that can infect chickens: Eimeria acervulina, E. maxima, E. tenella, E. brunetti, E. necatrix, E. mitis, and E. praecox [3]. Each species resides at the different section of the intestinal tract of broiler chickens, and thereby it has different modes of actions to affect growth performance and gut health of broilers [4]. Teng et al. [5] reported that E. maxima decreased digestibility of crude proteins and amino acids in broilers. Eimeria spp. can be transmitted via the fecal–oral route. The infection is initiated by ingestion of sporulated (infectious) oocysts, and after the asexual and sexual replications, un-sporulated oocysts are excreted with feces [6]. In an appropriate environment, the oocysts can be sporulated and become infectious, and this life cycle can be repeated with poultry growth cycle.
Eimeria tenella (E. tenella) resides in the mucus membrane of ceca, and during its replications, epithelial cells in ceca are damaged, resulting in hemorrhagic diarrhea and impaired growth performance and intestinal health in broilers [7]. The ceca, the main intestinal compartment for bacterial fermentation, can be reservoirs for pathogenic bacteria and their toxins that can cause oxidative stress after entering the blood stream of broilers [8]. However, ceca also play crucial roles in producing beneficial bacterial metabolites including vitamins, volatile fatty acids (VFA), lactic acid, and antimicrobial compounds via bacterial fermentation [9]. The VFA are not only inhibit the growth of pathogenic bacteria, but also are energy substrates for the host and induce gut development of chickens by accelerating gut epithelial cell proliferation [10]. Moreover, VFA interact with fat metabolism via mitogen-activated protein kinase (MAPK) pathway [11]. These suggest that VFA are closely associated with feed efficiency by providing extra energy to the host or influencing metabolism of chickens.
To cope with Eimeria spp. infection in broiler production, anti-coccidial drugs, and vaccination has been used in the broiler industry. However, the use of anti-coccidial drugs has been restricted by inhibiting the use of old anti-coccidial drugs and requiring Veterinary Feed Directives (VFD) registrations because of the spread of resistant Eimeria strain and consumer pressure [12,13]. Furthermore, vaccination is expensive and can prevent spread of Eimeria spp. [14]. Recently, a lot of attention has been paid to find nutritional interventions to control Eimeria spp. infection in broilers. Diverse bioactive compounds, including essential oils [15], probiotics [16], sodium butyrate [17], and plant extracts [18], were studied to control or to ameliorate negative effects of E. tenella infection and in broilers. The modes of actions of those bioactive compounds may include damaging cell wall of E. tenella, modulating cecal microbiota, and/or enhancing the immunity of broilers. To find suitable nutritional interventions, it is important to understand mode of actions of E. tenella on the growth of chickens and to set up appropriate experimental infection models to test novel nutritional interventions. Therefore, the hypothesis of this study was that impaired cecal health due to E. tenella infection may result in reduced growth performance and impaired intestinal health because of reduced VFA production and increased oxidative stress.
2. Growth Performance and Lesion Score
As shown in Table 1, no significant differences were observed in BW, ADG, and ADFI in the acute phase (p > 0.1) among the treatments. However, daily feed intake tended to quadratically increase on 6 dpi (p = 0.08) and 7 dpi (p = 0.09) due to E. tenella infection (Figure 1). In the acute phase, FCR was linearly increased due to the inoculation of E. tenella (p < 0.05). There were no significant differences in growth performance among the treatments in the recovery phase.
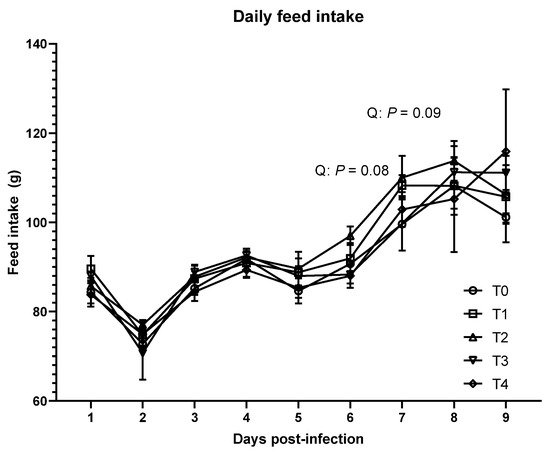
Figure 1. Daily feed intake of broiler chickens infected with different dosages of Eimeria tenella. Daily feed intake was measured in the T0 (treatment 0; Sham-challenged with phosphate-buffered saline); T1 (treatment 1; challenged with 6250 sporulated oocysts of E. tenella); T2 (treatment 2; challenged with 12,500 sporulated oocysts of E. tenella); T3 (treatment 3; challenged with 25,000 sporulated oocysts of E. tenella); T4 (treatment 4; challenged with 50,000 sporulated oocysts of E. tenella) groups during 1 to 9 days post-infection. At each time point, orthogonal polynomial contrasts analysis was conducted to see linear pattern (L) and quadratic pattern (Q) among the treatments.
Table 1. Growth performance parameters including body weight (BW; g), average daily gain (ADG; g/d), average daily feed intake (ADFI; g/d), and feed conversion ratio (FCR; g/g) of broiler chickens infected with different dosages of Eimeria tenella during the acute phase [0 to 6 days post-infection (dpi)] and recovery phase (6 to 9 dpi) 1.
| Items | Eimeria tenella-Challenged | Polynomial Contrast | |||||||
|---|---|---|---|---|---|---|---|---|---|
| T0 | T1 | T2 | T3 | T4 | SEM | p Value | Lin. | Quad. | |
| Initial BW | 359.4 | 360.3 | 356 | 359.5 | 358 | 3.72 | 0.38 | ||
| 0 to 6 dpi | |||||||||
| BW | 703.4 | 705.5 | 697 | 699.5 | 680.77 | 27.28 | 0.55 | 0.16 | 0.43 |
| ADG | 57.33 | 57.53 | 57.01 | 56.54 | 53.80 | 4.32 | 0.56 | 0.16 | 0.37 |
| ADFI | 84.92 | 87.24 | 88.63 | 86.05 | 84.31 | 4.61 | 0.55 | 0.69 | 0.11 |
| FCR | 1.48 | 1.52 | 1.55 | 1.52 | 1.57 | 0.06 | 0.19 | 0.04 | 0.64 |
| 6 to 9 dpi | |||||||||
| BW | 881.8 | 859 | 876.9 | 885.73 | 889.19 | 79.63 | 0.97 | 0.69 | 0.72 |
| ADG | 65.81 | 57.40 | 61.68 | 63.83 | 69.70 | 13.74 | 0.62 | 0.43 | 0.22 |
| ADFI | 115.4 | 120.9 | 123.77 | 123.1 | 123.1 | 14.86 | 0.87 | 0.4 | 0.55 |
| FCR | 1.9 | 2.17 | 2.03 | 1.97 | 1.77 | 0.39 | 0.50 | 0.38 | 0.16 |
| 0 to 9 dpi | |||||||||
| ADG | 60.16 | 57.49 | 58.83 | 58.97 | 59.10 | 6.47 | 0.97 | 0.94 | 0.66 |
| ADFI | 95.09 | 98.47 | 100.6 | 98.16 | 97.24 | 6.81 | 0.72 | 0.65 | 0.22 |
| FCR | 1.62 | 1.74 | 1.71 | 1.67 | 1.64 | 0.14 | 0.54 | 0.85 | 0.15 |
1 T0: treatment 0 (Sham-challenged with phosphate-buffered saline); T1, treatment 1 (challenged with 6250 sporulated oocysts of Eimeria tenella); T2, treatment 2 (challenged with 12,500 sporulated oocysts of Eimeria tenella); T3, treatment 3 (challenged with 25,000 sporulated oocysts of Eimeria tenella); T4, treatment 4 (challenged with 50,000 sporulated oocysts of Eimeria tenella). At each time point, orthogonal polynomial contrasts analysis was conducted to see linear pattern (L) and quadratic pattern (Q) among the treatments.
Cecal lesion due to E. tenella infection was not detected in the T0 group on 6 dpi (Figure 2). The T4 group had a higher lesion score compared to the T1 group (p < 0.05); lesion scores > 0 and <2 were also obtained in T1, T2, and T3 groups.
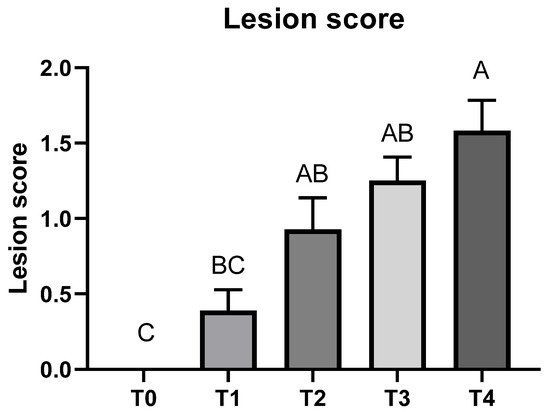
Figure 2. Cecal lesion score of broiler chickens infected with different dosages of Eimeria tenella on 6 days post-infection. Cecal lesion score was measured in the T0 (treatment 0; Sham-challenged with phosphate-buffered saline); T1 (treatment 1; challenged with 6250 sporulated oocysts of E. tenella); T2 (treatment 2; challenged with 12,500 sporulated oocysts of E. tenella); T3 (treatment 3; challenged with 25,000 sporulated oocysts of E. tenella); T4 (treatment 4; challenged with 50,000 sporulated oocysts of E. tenella) groups on 6 days post-infection. Different letters at the same time point represent significantly different (p < 0.05) by utilizing the Kruskal–Wallis test followed by the Dwass, Steel, Critchlow-Fligner post hoc test.
3. Oocyst Shedding and Fecal/ileal Moisture Content
As shown in Figure 3, E. tenella was not detected in the feces of the sham-challenged (T0) group at all time points. On 5 to 6 dpi, the T4 group had significantly higher oocyst shedding compared to T1 group, and E. tenella infection linearly increased oocyst shedding. However, there were no significant differences in oocyst shedding among the treatments on 6 to 7 dpi and 7 to 8 dpi.
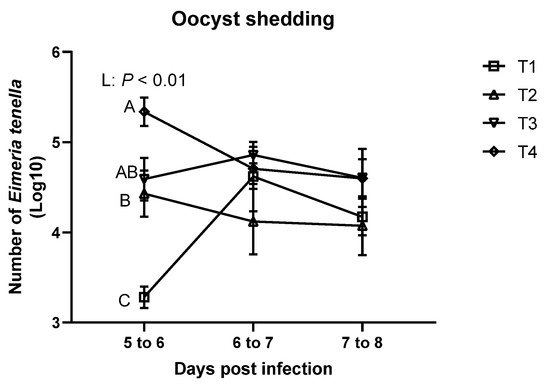
Figure 3. Oocyst shedding of broiler chickens infected with different dosages of Eimeria tenella. Fecal oocyst shedding was measured using McMaster chamber in the T0 (treatment 0; Sham-challenged with phosphate-buffered saline); T1 (treatment 1; challenged with 6250 sporulated oocysts of E. tenella); T2 (treatment 2; challenged with 12,500 sporulated oocysts of E. tenella); T3 (treatment 3; challenged with 25,000 sporulated oocysts of E. tenella); T4 (treatment 4; challenged with 50,000 sporulated oocysts of E. tenella) groups on 5 to 6, 6 to 7, and 7 to 8 days post-infection. Number of E. tenella oocysts is shown as log10 (oocysts/g feces). At each time point, orthogonal polynomial contrasts analysis was conducted to see linear pattern (L) and quadratic pattern (Q) among the treatments. Different letters at the same time point represent significantly different (p < 0.05) by proc mixed followed by the Tukey’s multiple comparison test among the treatment groups.
As shown in Table 3, Fecal moisture content was modulated due to E. tenella infection on 7 to 8 dpi (p < 0.05). Fecal moisture content was quadratically decreased on 5 to 6 dpi (p < 0.05), and quadratically increased on 6 to 7 dpi (p < 0.05) due to E. tenella infection. E. tenella infection linearly increased fecal moisture content on 7 to 8 dpi (p < 0.05). On 6 dpi, E. tenella infection altered ileal moisture content, and ileal moisture content was linearly decreased on 6 dpi due to E. tenella infection (p < 0.05).
Table 3. Fecal moisture content (fecal consistency) and ileal moisture content of broiler chickens infected with different dosages of Eimeria tenella on 5 to 6 days post-infection (dpi), 6 to 7 dpi, and 7 to 8 dpi (fecal moisture content), and at 6 and 9 dpi (ileal moisture content) 1.
| Items | Eimeria tenella-Challenged | Polynomial Contrast | |||||||
|---|---|---|---|---|---|---|---|---|---|
| T0 | T1 | T2 | T3 | T4 | SEM | p Value | Lin. | Quad. | |
| Feces | |||||||||
| 5 to 6 dpi | 78.23 | 76.76 | 75.91 | 76.56 | 76.99 | 1.66 | 0.22 | 0.22 | 0.04 |
| 6 to 7 dpi | 68.14 | 69.68 | 73.38 | 74.64 | 68.66 | 4.87 | 0.12 | 0.35 | 0.03 |
| 7 to 8 dpi | 70.81 | 71.87 | 73.09 | 75.07 | 74.86 | 2.52 | 0.03 | <0.01 | 0.65 |
| Ileum | |||||||||
| 6 dpi | 81.75 | 81.83 | 80.6 | 80.94 | 80.81 | 0.76 | 0.03 | 0.01 | 0.33 |
| 9 dpi | 80.34 | 80.1 | 81.24 | 80.62 | 79.93 | 1.22 | 0.42 | 0.9 | 0.18 |
1 T0: treatment 0 (Sham-challenged with phosphate-buffered saline); T1, treatment 1 (challenged with 6250 sporulated oocysts of E. tenella); T2, treatment 2 (challenged with 12,500 sporulated oocysts of E. tenella); T3, treatment 3 (challenged with 25,000 sporulated oocysts of E. tenella); T4, treatment 4 (challenged with 50,000 sporulated oocysts of E. tenella). At each time point, orthogonal polynomial contrasts analysis was conducted to see linear pattern (L) and quadratic pattern (Q) among the treatments.
3. Summary
Orthogonal polynomial contrasts showed that E. tenella mild-infection reduced VFA production in the ceca, and this caused energy deficiency, which increased feed intake and impaired feed efficiency of broiler chickens. This suggests that the cecal VFA concentrations could be a key parameter to represent feed efficiency and E. tenella infection severity in broiler chickens. Furthermore, mild-infection of E. tenella modulated intestinal morphology, antioxidant capacity, and gastrointestinal permeability in the recovery phase. Different inoculation dosages of E. tenella changed oocyst shedding patterns and ileal/fecal moisture content. These current data showed that the mechanisms of E. tenella impair feed efficiency and gut health of broilers, which will be beneficial to strategies to cope with E. tenella infection in broiler chickens.
This entry is adapted from the peer-reviewed paper 10.3390/ani11123428
This entry is offline, you can click here to edit this entry!