This overview summarizes the recent advances that have been achieved in the understanding of the climatic indices and their influence on the functioning of the Mediterranean from a physical point of view
- atmospheric forcing
- climatic indices
- Mediterranean Sea
Definition
The Mediterranean Sea, strategically situated across a dynamic frontier line that separates two regions with different climates (Europe and North Africa), has been the focus of attention of many studies dealing with its thermohaline circulation, deep water formation processes or heat and freshwater budgets. Large-scale atmospheric forcing has been found to play an important role in these topics and attention has been renewed in climatic indices that can be used as a proxy for atmospheric variability.
1. Introduction
The Mediterranean Sea acts as a natural laboratory since, despite its reduced dimensions, most of the processes typical of global ocean circulation, such as deep water formation or thermohaline circulation, take place in the basin. Moreover, semi-enclosed basins such as the Mediterranean are appropriate for characterizing heat and water flux since it makes possible a basin budget closure. There is a lot of research devoted to the Mediterranean heat [1,2,3,4,5,6,7,8,9] and water [1,5,6,9,10,11,12,13,14,15,16,17,18] budgets but, despite these efforts, estimation of the surface freshwater flux has been found to depend on the methodology and datasets used and, hence, is subject to significant uncertainty, particularly in its seasonal and interannual variability. For instance, estimates of the water deficit (evaporation minus precipitation) are found to range from 421 [5] to 1230 mm·y−1 [14], confirming the difficulty of obtaining a reliable estimate.
More than 60 years of climatological datasets were analyzed in recent research [9], with longer time series available. The seasonal cycle of the net heat is positive (that is, toward the ocean) between March and September, with a maximum in June, whereas negative values (that is, toward the atmosphere) are found during the rest of the year, with a minimum in December. On a yearly basis, a nearly neutral budget of 0.7 Wm−2 is reported for the whole Mediterranean but there are remarkable differences between the eastern and western sub-basins: ~12 Wm−2 (toward the ocean) is found for the western Mediterranean and around −6.4 Wm−2 (toward the atmosphere) for the eastern Mediterranean [9], mainly related to the high latent heat losses that take place in this sub-basin (up to 100 Wm−2).
For the freshwater deficit, a seasonal cycle with an amplitude of around 600 mm·y−1, with maximum in August–September and minimum in May, is described [9]. The long-term mean of the basin-averaged deficit is 680 ± 70 mm·y−1 but it is almost 70% higher in the Eastern Mediterranean due to higher evaporation and lower precipitation in this basin. A higher deficit (positive trend) of 1.6 ± 0.9 mm·y−2 is reported for the entire 60-year period in which the decrease in precipitation seems to be the dominant factor, although one study [17] also underlines the role of evaporation changes.
With respect to interannual variability, only a few of the most recent works have focused on this topic and the associated forcing mechanisms, since longer datasets are necessary. For example, in one study [9], several different periods of evaporation and precipitation anomalies are described: from the early 1950s to the late 1960s, a positive trend was reported; then, it changed to negative, until the late 1980s, when a new change was observed. This variability is also found in the net heat flux exchanged between the atmosphere and the ocean and indicates a ~40-year period multidecadal oscillation that is likely to be related to large-scale atmospheric forcing. To explore this linkage, several climatic indices representing this large-scale atmospheric forcing can be tested as a proxy to monitor the long-term variability of climatic variables that influence the Mediterranean.
2. Geographical Frame
The Mediterranean Sea (Figure 1a) is a semi-enclosed basin situated along the border that separates the European and North African climatic regions. It has a total surface of 2.5 million of km2, extending for 3000 km in longitude and 1500 in latitude and connecting with the Atlantic Ocean through the Strait of Gibraltar and with the Black Sea through the Dardanelles Strait. The Strait of Sicily separates the basin into two main sub-basins, the Western and Eastern Mediterranean.
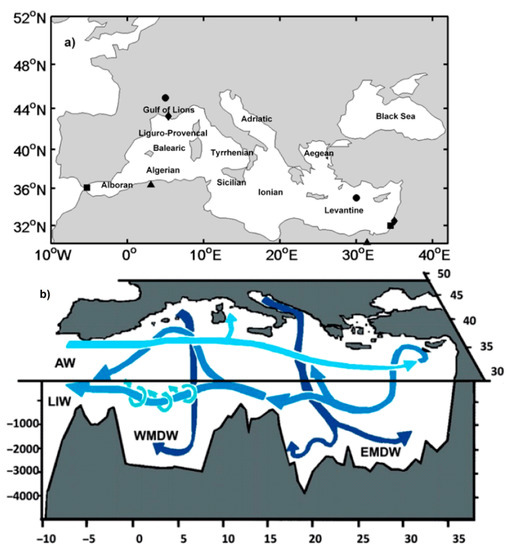
Figure 1. (a) Map of the Mediterranean Sea with the main basins and sub-basins. Symbols indicate the locations selected for measuring pressure differences in the station-based Mediterranean Oscillation (MO) indices (a triangle for Algiers–Cairo, a square for Gibraltar–Israel, a circle for France–Levantine and a diamond for Marseille–Jerusalem); (b) Sketch of the Mediterranean thermohaline circulation.
The Mediterranean circulation (Figure 1b) is driven, as the leading mechanism, by atmosphere-ocean interactions. This forcing depends on the heat and freshwater exchange and, hence, on the meteorological and oceanic conditions [19]. Since the average precipitation (P) and river runoff (R) do not balance the average evaporation (E) over the basin, a net inflow of Atlantic waters (AW) through the Strait of Gibraltar is necessary to compensate for the deficit. This compensation mechanism generates thermohaline circulation constituted by several cells [20,21]. The main one transports the AW entering the basin in the surface layer eastward, across the western and eastern basins, gradually increasing its salinity and density as a consequence of the evaporative losses. This modified Atlantic water (MAW) reaches the Levantine basin, where winter cooling caused by intense dry winds forces its sinking to intermediate depths (300–500 m), producing the Levantine intermediate water (LIW) [22].
3. Large-Scale Atmospheric Forcing: Climatic Indices
Large-scale atmospheric patterns strongly influence the weather and climate of wide regions. Climatic indices are defined in order to quantify the variability of these general patterns and their effects on local climatic systems. They provide information on how the overall physical variability is linked to the evolution of the local climatic parameters. Hence, they can be used as a proxy to monitor the long-term variability of climatic variables that influence the Mediterranean circulation. For this reason, the improvement of our knowledge of the interrelation between the climatic indices and the Mediterranean climate and circulation is essential in order to understand their variability and evolution under climate change. The most outstanding climatic indices that influence the Mediterranean region, namely the North Atlantic oscillation (NAO), East Atlantic (EA) pattern, East Atlantic–West Russia (EA–WR) pattern and the Mediterranean oscillation (MO), will be reviewed in the following sections. The Scandinavian (SCAN) pattern produces weak variations in the sea level pressure anomaly field and plays a secondary role in the large-scale atmospheric forcing over the Mediterranean [28,29].
The spatial structure of the large-scale atmospheric patterns can be described in numerous ways and, therefore, there are several accepted definitions of the climatic indices that represent their modes of variability and temporal evolution. Two approaches have been historically followed: the combination (usually difference) between the sea level pressure (SLP) anomalies measured at different stations over the region of influence of the atmospheric patterns (e.g., see [29,30,31,32,33,34,35] for MO index; see [33,34,35,36,37] for a complete review of station-based NAO indices) or from the principal components (PC) time series of the first empirical orthogonal function (EOF) of SLP or some other climate variable (see [38,39] for MO index; see [40] for a summary of several NAO definitions).
The definition based on the PC has the advantage of representing the variability of the atmospheric patterns in its whole extension, not being affected by the noise introduced in the SLP measurements by the short-term meteorological events present in the station-based indices (see [40,41,42] or [43] for MO). A widely used analysis of the most outstanding modes of atmospheric variability is carried out at the National Oceanic and Atmospheric Administration (NOAA) Climate Prediction Centre (CPC). They identify the main modes by a rotated PC analysis [44] of the measured monthly mean 500 mb height anomaly fields in the area 20° N–90° N. Their database provides monthly index values for each mode computed by this method (see details in [45]).
4. Conclusion
The NAO index is widely recognized as representative of one the most important modes of atmospheric variability in the northern hemisphere and hence the Mediterranean basin. Both phases of the NAO are associated with basin-wide changes and, for instance, the observed decrease in the basin averaged precipitation from the mid-1960s to early 1990s is likely to be linked to the multidecadal oscillation of the NAO index that switched from negative to positive phase. The EA pattern plays an interesting role in heat losses since its negative phase induces northeasterly flow of cold dry air, increasing the air–sea temperature and humidity gradients, which leads to strong positive anomalies in the heat loss over the whole basin, especially in wintertime. The most interesting effect of EA–WR is that the associated sign variations produce significant differences in the basin heat loss distribution, generating opposite sign anomalies in the western and eastern basins. Finally, the MO, although not independent from the others, has turned out to be a valuable tool for measuring the atmospheric forcing over the basin since, on an annual basis, it provides the highest correlation with the main climatic variables that influence the freshwater and heat budgets in the Mediterranean Sea and, hence, its thermohaline circulation.
This entry is adapted from the peer-reviewed paper 10.3390/app10175790