Your browser does not fully support modern features. Please upgrade for a smoother experience.
Please note this is an old version of this entry, which may differ significantly from the current revision.
Subjects:
Regional & Urban Planning
During the last two decades, determining the urban boundaries of cities has become one of the major concerns in the urban and regional planning subject domains. Many scholars have tried to model the change of urban boundaries as it helps with sustainable development, and here researchers reported a ICN model.
- Model
- urban and regional planning
- city
- Boundary
1. Introduction
1.1. Theoretical Background of the Urban Boundary Demarcation
Cities are the outcome of the historical evolution of space, clustered and stacked according to the communities and resource agglomeration over many decades (Lee 2021). This integrated nature of city clusters form different city scales according to their degree of urban agglomeration, which have caused dramatic changes in the urban boundaries of cities. In such a context, understanding of the urban boundaries of cities provides significant insights into recognizing the dynamic nature of the urbanization process of the cities and mapping out specific development policies to avoid, minimize, or solve the social and environmental problems along with the urbanization process of the cities (Peng et al. 2018). It also distinguishes urban development trends and patterns, urban sprawling effects and the distribution of resources in cities, which helps to address the socio-economic-ecological causes and consequences of these cities (Xiaofang et al. 2020). In such a context, demarcating the urban boundaries of cities provides significant insights for the urban planners, transport engineers and geographers in many dimensions.
However, lesser attention has been paid from the research community to delineate the urban boundaries in a systematic manner, as most of the countries continue to remain on the minimum population size threshold with fixed administrative classifications to delineate the urban boundaries of cities by considering the diversity of natural and physical attributes. (Dijkstra et al. 2021), (Henriques et al. 2020). For instance, in Sri Lanka, Municipalities and Urban Council areas are distinguished as urbanized areas by considering the population density and natural and physical characteristics of the land in these areas—regardless of its urban functionality. Thus, applying these thresholds and classifications as spatial units to classify the urban boundaries of cities has resulted in a significant mismatch of the cities’ actual scale, size, and shape of the urban boundaries and reduced the international comparability of the urban scales of cities (Dijkstra et al. 2021), (Song et al. 2018). This contradiction of urban area classification is discussed in depth by (Henriques et al. 2020), and it distinguishes the different approaches applied to classify the different territories as urban, depending on the different official institutions and the purposes that initiate these classifications. In such a context, this dilemma hindered the implementation of sustainable development measures and the social policy making of cities because such efforts were not affected to the actual city area (Dijkstra et al. 2021). For instance, municipality services (i.e., garbage collection, sewerage and drainage cleaning, infrastructure, and community development projects, etc.) and municipality policies, (i.e., taxation, public funding, and social security regulations, etc.) are significantly underestimated from the actual urban area of the city and limited to the administratively or arbitrarily defined city area. Hence, apart from the administrative boundary definition, it has been proposed to include multiple urban boundary definitions which are mainly focused on the geographic features, urban form, economic composition, and commuter distribution, (i.e., trip generation and distribution), etc. (Mortoja et al. 2020), (Chakraborti et al. 2018). In order to solve this complexity, for the purpose of study, this article defines ‘urban boundary’ as the maximum functional extent, (i.e., urban fringe) of the urban cluster, which is derived by the maximum self-similarity distribution of Fractal Dimension of percolation clusters by the iCN Model. Here, self-similarity denotes the similarity of individual parts to the whole structure when it is scaled down or magnified to each individual part. Thus, Fractal Dimension depicts the statistical ratio of complexity of structure by comparing how self-similarity changes with scale (Jiang and Brandt 2016), (Zhang et al. 2014).
1.2. Existing Applications, Limitations and Failures
Taking into consideration the aforesaid research domain, multiple techniques and approaches have been employed to demarcate the urban boundaries of cities. Among them, satellite imagery and remotely sensed approach methods are highly utilized, considering their spatial nature of the data and flexibility—to capture the corresponding city area by the percentage of impervious surface or developed land (Chen et al. 2019), (Peng et al. 2018). However, during recent years the applicability of visible (i.e., RGB) satellite imagery to demarcate urban areas has been exceedingly criticized, as these methods are solely capable of distinguishing the visual interpretation of the urban areas of cities, which may misinterpret the actual urban area (Liu and Yang 2015), (Mundhe and Jaybhaye 2014). On the other hand, the impervious-surface-based urban boundary classifications contain significant theoretical and technical limitations. For instance, Peng and his colleagues (Peng et al. 2018) utilized the spatial continuous data of impervious surface area (ISA) and the method of spatial continuous wavelet transform to demarcate the urban boundaries. In this method, the impervious surface was mainly composed with the construction lands, buildings, and other buildup areas, excluding the water and green infrastructure lands which are considered as important elements in the urban environment (Xiaofang et al. 2020). Therefore, the urban boundary classification under the ISA method overestimated the urban boundaries in large scale cities, (i.e., due to larger impervious surface) and underestimated the urban boundaries of small-scale cities, (i.e., due to limited impervious surface).
In such a context, Xiaofang and his colleagues (Xiaofang et al. 2020) proposed a novel approach to map the urban areas of Chinese cities, by utilizing the nighttime light data. The study assumed that the emission of light, (i.e., streetlamps, automobiles, residential and commercial areas, etc.) and their intensities distinguished the urban lifestyle of Chinese cities. Thus, each city’s corresponding urban area was captured by the emission of light and scaled according to the light emission intensities. The study distinguished that the proposed method is well-applicable for large scale urban cluster boundary demarcation, as those urban clusters’ light emissions are significantly high during nighttime (Xiaofang et al. 2020), (Briggs et al. 2007). However, this method is comprised with several significant limitations (Tian et al. 2005). I. The proposed model is not applicable for urban boundary delineation in small cities, since it is unable to collect nighttime light emissions due to low light emission intensities (Tian et al. 2005), (Sutton et al. 1997). II. The light emission of cities does not distinguish the exact urban boundary of cities, as it only captures the nighttime functions and activities of cities (Briggs et al. 2007). III. The proposed method is more applicable for the developed countries due to the availability of high and accurate satellite imagery data and their financial capability to purchase the data. In such context, the applicability of remotely sensed approaches to derive the urban boundaries of cities is highly questionable.
Apart from the above-mentioned satellite-imagery-based urban boundary classification technics, density (i.e., either population or building) has been a frequently utilized approach to demarcate the urban boundaries of cities (Montero et al. 2021). In such a context, Arcaute and her colleagues (Arcaute et al. 2015) utilized population density distribution of “wards” to capture the urban boundaries of cities in the UK. Thus, the population density of each ward is calculated and merged with adjacent wards, which are above the given threshold limit, to generate city clusters. However, in this method, the density threshold limit and the appropriate density cutoff to delineate the urban boundaries of cities depend on the scholar’s preference and ground knowledge. This significantly questions the model accuracy, since the utilized threshold limits are not uniquely defined (Dong et al. 2015). When calculating the population density of a wider administrative area, this method causes an underestimation of the urban boundaries of cities, resulting in a lower population density for the particular administrative unit, regardless of its urban functionality (Dijkstra et al. 2021). Additionally, at present, it is well established that the administrative demarcations hardly represent the actual picture of the cities’ urbanization process and their urban boundary, as it is purposefully utilized for administrative purposes (Montero et al. 2021), (Dong et al. 2015).
As a solution for this, Song and his colleagues (Song et al. 2018) have presented an alternative density approach to delineate the city boundaries by utilizing the Kernel Density estimation on the points of interest of population density distribution and activities. The study was well distinguished and proved that the urban boundaries derived by the proposed approach does significantly vary with administrative boundaries of these cities, as it clearly misleads on the actual urban boundaries of cities. Although this method proposed a unique and successful approach to demarcate the urban boundaries of cities, it is still comprised with several minor limitations. I. This method utilized raster population layers to initiate the Kernel Density, hence the accuracy of the derived urban boundaries is limited to the cell size of the utilized population raster later (Montero et al. 2021), (Tian et al. 2005). II. This method was inadequate to capture the dynamic and complex morphological changes of cities and their urban boundaries by utilizing a rigid proxy, such as population density. This mainly caused the population census to be carried out every decade according to the administrative zones and then to downscale the population according to the ancillary information (Nicolau et al. 2019), (Mennis 2003). Hence, it does not incorporate the complex and dynamic spatial changes of cities to the population distribution (Montero et al. 2021), (Eicher and Brewer 2001). As a result, the applicability of the density approach to defining the city boundaries resulted in substantial model constraints.
Considering the above-mentioned theoretical and technical limitations of the existing urban boundary delineating methods, this study attempts to make a significant contribution to the four key limitations noted in the emerging research in the domain of the urban boundary demarcating studies. I. The existing urban boundary demarcating methods are scale dependent and only applicable to the specific scaling limit of the cities’ urban boundary demarcation (i.e., nighttime light emission method applicable for regional scale). Therefore, this study is focusing on elaborating a scale-free method to demarcate the urban boundary of cities by utilizing the road intersection points which are considered as the primary indicators of interaction and agglomeration. II. It is identified that the existing studies still rely on the arbitrarily defined threshold limits to demarcate urban boundaries; hence, this study proposed a rational approach to demarcate the urban boundary of cities by utilizing fractal geometry self-similarity distribution of the urban cluster. III. It denotes that the existing models are unable to capture the complex and dynamic spatial changes of the cities when demarcating their urban boundaries. Hence, this study utilized transportation network as the proxy to demarcate the urban boundaries, as it captures dynamic and complex morphological changes of cities IV. Finally, instead of the commercialized urban boundary demarcating methods, this study proposed a universal and open-source approach to demarcate the urban boundary of cities, which can be equally applicable to any geographical region.
In such a context, this study utilized the iCN Model to derive the urban boundaries of cities. The iCN Model is a multi-functional urban simulation tool developed by (Kalpana et al. 2021), which is capable of modeling the urban agglomeration and urban development pattern of cities. Thus, in this study, the same analytical framework was used to determine urban boundaries of cities. In such context, this study hypothesized that since the iCN Model depicts the urban development degree of each city cluster, their perimeter should represent the urban boundary of those cities. The study selected Sri Lanka as its study area and chose few Sri Lankan cities to test the hypothesis and assess the model validity empirically and spatially with real ground scenarios and the satellite-imagery-classified urban spaces, respectively.
The findings of the study will help geographers and urban and transport planners to have a better understanding of how to determine the urban boundaries of cities while taking into account the dynamic and complex nature of modern cities. It will further distinguish the urban development pattern and the scaling nature of cities based on transportation infrastructure development. In this context, the proposed model would be a useful tool for delineating each city’s urban boundaries and distinguishing its urban development patterns. As a result, the proposed model can be used as a decision-making tool by transportation and urban planning practitioners, policymakers, and real estate developers to develop strategies based on the urban development patterns of each city. In other words, the proposed method provides excellent insight into how each transportation development influenced city urban development patterns and, ultimately, how it influenced city urban boundary changes. Finally, the proposed model would be useful for transportation planners to study how the development of transportation infrastructure affects the behavior and functionality of cities. Therefore, the findings of this study would be beneficial to the sustainable development of cities and their social and transport policy formulation.
2. Study Area
The entire country of Sri Lanka was selected as the study area, mainly due to the clear spatial representation and non-existence of external linkages, due to being an island. Hence, the study can precisely run the model without any disruptions and derive the cities and their corresponding urban boundaries. The basic characteristics of Sri Lanka is depicted in Table 1.
Table 1. The basic characteristics of Sri Lanka.
| The Basic Characteristics of Sri Lanka | |
|---|---|
| Total Population | 20,359,439 |
| Total Land Extent | 65,610 Km2 |
3. Data Description and Sources
Table 2 depicts the study utilized data and their sources.
Table 2. Study utilized data and their sources.
| Data Type | Extent | Year | Source | Data Format |
|---|---|---|---|---|
| Road Network | Sri Lanka | 2012 | Open Street Map | GIS data: Vector Format. Dissolved to Individual Polyline |
| Administrative Boundaries | Sri Lanka | 2012 | Survey Department of Sri Lanka | GIS data: Vector Format. Dissolved to Individual Polygon |
| Satellite Imagery | Sri Lanka | 2012 | USGS Earth Explorer | GIS data: Raster Format. Landsat 8. 12 Bands. |
4. Method of Study
Figure 1 depicts the detailed analytical framework of the study, which can be divided into three major sections: I. Data sourcing stage; II iCN Model implementation stage; III. Model evaluation and validation stage. The study utilized OSM Repository and USGS Earth Explorer to extract the road network and satellite imageries (i.e., Landsat 8) of Sri Lanka, respectively, and utilized open-source GIS application for the initial data handling and pre-processing tasks.
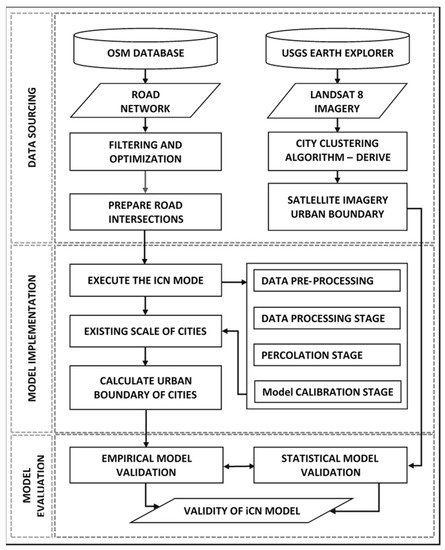
Figure 1. Analytical framework of the study.
The detailed steps of iCN Model implementation is presented in the following section.
5. iCN Model Implementation
The implementation of the iCN Model can be divided into four major steps: I. Data Pre-processing Stage, which includes the initial data preparations; II. Data Processing Stage, which contains the intersection points generating and data optimization steps; III. Clustering Stage, which consists of the application of the percolation process; and IV. Calibrating stage, which consists of the calculating of the fractal geometry to derive the existing urban boundaries of cities. The open-source GIS applications were utilized to initiate each and every modeling step. The detailed information of the iCN model implementation is discussed in depth in (Kalpana et al. 2021).
This entry is adapted from the peer-reviewed paper 10.3390/socsci10120448
References
- Lee, Kyung-Young. 2021. Factors Influencing Urban Livability in Seoul, Korea: Urban Environmental Satisfaction and Neighborhood Relations. Social Sciences 10: 138.
- Peng, Jian, Yi’na Hu, Yanxu Liu, Jing Ma, and Shiquan Zhao. 2018. A new approach for urban-rural fringe identification: Integrating impervious surface area and spatial continuous wavelet transform. Landscape and Urban Planning 175: 72–79.
- Hu, Xiaofang, Yuguo Qian, Steward TA Pickett, and Weiqi Zhou. 2020. Urban mapping needs up-to-date approaches to provide diverse perspectives of current urbanization: A novel attempt to map urban areas with nighttime light data. Landscape and Urban Planning 195: 103709.
- Dijkstra, Lewis, Teodora Brandmüller, Thomas Kemper, Arbab Asfandiyar, and Paolo Veneri. 2021. Applying the Degree of Urbanisation—n—A Methodological Manual to Define Cities, Towns and Rural Areas for International. Luxembourg: Publications Office of the European Union.
- Henriques, Cristina, Alexandre Domingues, and Margarida Pereira. 2020. What Is Urban after All? A Critical Review of Measuring and Mapping Urban Typologies in Portugal. ISPRS International Journal of Geo-Information 9: 630.
- Song, Yongze, Ying Long, Peng Wu, and Xiangyu Wang. 2018. Are all cities with similar urban form or not? Redefining cities with ubiquitous points of interest and evaluating them with indicators at city and block levels in China. International Journal of Geographical Information Science 32: 2447–76.
- Mortoja, Md Golam, Tan Yigitcanlar, and Severine Mayere. 2020. What is the most suitable methodological approach to demarcate peri-urban areas? A systematic review of the literature. Land Use Policy 95: 104601.
- Chakraborti, Suman, Dipendra Nath Das, Biswajit Mondal, Hossein Shafizadeh-Moghadam, and Yongjiu Feng. 2018. A neural network and landscape metrics to propose a flexible urban growth boundary: A case study. Ecological Indicators 93: 952–65.
- Jiang, Bin, and S. Anders Brandt. 2016. A fractal perspective on scale in geography. SPRS International Journal of Geo-Information 5: 95.
- Zhang, Jingxiong, Peter Atkinson, and Michael F. Goodchild. 2014. Scale in Spatial Information and Analysis. Boca Raton: CRC Press.
- Chen, Jiandong, Wei Fan, Ke Li, Xin Liu, and Malin Song. 2019. Fitting Chinese cities’ population distributions using remote sensing satellite data. Ecological Indicators 98: 327–33.
- Liu, Ting, and Xiaojun Yang. 2015. Monitoring land changes in an urban area using satellite imagery, GIS and landscape metrics. Applied Geography 56: 42–54.
- Mundhe, Nitin N., and Ravindra G. Jaybhaye. 2014. Impact of urbanization on land use/land covers change using Geo-spatial techniques. International Journal of Geomatics and Geosciences 5: 50–60.
- Briggs, David J., John Gulliver, Daniela Fecht, and Danielle M. Vienneau. 2007. Dasymetric modelling of small-area population distribution using land cover and light emissions data. Remote Sensing of Environment 108: 451–66.
- Tian, Yongzhong, Tianxiang Yue, Lifen Zhu, and Nicholas Clinton. 2005. Modeling population density using land cover data. Ecological Modelling 189: 72–88.
- Sutton, Paul, Dar Roberts, Chris Elvidge, and Henk Meij. 1997. A comparison of nighttime satellite imagery and population density for the continental United States. Photogrammetric Engineering and Remote Sensing 63: 1303–13.
- Montero, Gaëtan, Cécile Tannier, and Isabelle Thomas. 2021. Delineation of cities based on scaling properties of urban patterns: A comparison of three methods. International Journal of Geographical Information Science 35: 919–47.
- Arcaute, Elsa, Erez Hatna, Peter Ferguson, Hyejin Youn, Anders Johansson, and Michael Batty. 2015. Constructing cities, deconstructing scaling laws. Journal of the Royal Society Interface 12: 20140745.
- Dong, Nan, Xiaohuan Yang, Hongyan Cai, and Liming Wang. 2015. A novel method for simulating urban population potential based on urban patches: A case study in Jiangsu Province, China. Sustainability 7: 3984–4003.
- Nicolau, Rita, João David, Mário Caetano, and José Pereira. 2019. Ratio of land consumption rate to population growth rate—Analysis of different formulations applied to mainland Portugal. ISPRS International Journal of Geo-Information 8: 10.
- Mennis, Jeremy. 2003. Generating surface models of population using dasymetric mapping. The Professional Geographer 55: 31–42.
- Eicher, Cory L., and Cynthia A. Brewer. 2001. Dasymetric mapping and areal interpolation: Implementation and evaluation. Cartography and Geographic Information Science 28: 125–38.
- Lindamullage Don Charls Hasintha Nawod Kalpana, Chethika Abenayake, Amila Jayasinghe, Pelpola KS Mahanama, and Niroshan Sanjaya. 2021. A novel approach to measure the pattern of urban agglomeration based on the road network. International Journal of Sustainable Development and Planning 16: 251–62.
- Hagen-Zanker, Alex. 2009. An improved Fuzzy Kappa statistic that accounts for spatial autocorrelation. International Journal of Geographical Information Science 23: 61–73.
- Gismondi, M., C. Kamusoko, T. Furuya, S. Tomimura, and M. Maya. 2013. MOLUSCE—An an open source land use change analyst. In FOSS4G OSGeo’s Global Conference for Open Source Geospatial Software. Nottingham: Birleşik Krallık.
This entry is offline, you can click here to edit this entry!