Cross-Amplification in Strigiformes: A New STR Panel: History
Please note this is an old version of this entry, which may differ significantly from the current revision.
Contributor:

Strigiformes are affected by a substantial decline mainly caused by habitat loss and destruction, poaching, and trapping. Moreover, the increasing trend in bird trade and the growing interest in wild-caught rather than captive-bred birds are expected to encourage illegal trade. The biomolecular investigation represents a valuable tool to track illegal trade and to explore the genetic variability to preserving biodiversity. Microsatellite loci (STRs) are the most used markers to study genetic variability. Despite the availability of species-specific microsatellite loci in Strigiformes, a unique panel permitting the description of the genetic variability across species has not been identified yet.

  • cross-amplification
  • nocturnal raptors
  • illegal trade
  • Strigiformes
  • forensic

A1. Preliminary Screening of STR Polymorphic Loci

Thirty-two microsatellite markers were chosen to evaluate their cross-species amplification potential on three species (Athene noctua, Strix aluco, Bubo bubo), belonging to two different sub-families, Striginae and Surninae, and three tribes (Strigini, Bubonini, Athenini) respectively [1].
Two unrelated individuals per species were selected from the CITES biobank and database (managed since 1995 by the Italian Institute of Environmental Protection and Research – ISPRA on behalf of the Italian Environmental Ministry). Data obtained revealed that twenty-one out of 32 markers used (15a6, Age5, Bb101, Bb126, BbuS027, Bbus116, Calex05, Fepo42, Oe054, Oe128, Oe129, Oe142, Oe149, Oe321, Oe53, Oe81, Oe84, SneD113, SneD202, SneD218, Tgu06) gave amplicons in A. noctua, S. aluco and B. bubo DNA samples. The remaining 11 microsatellites were not included because they either did not give any amplification product or led to unreliable PCR amplicons.

2. Evaluation of the STR Potential in Family Groups

Three family groups constituted by father, mother and one offspring for each of the nine species were chosen and analyzed at the twenty-one loci selected in the previous section.
Data obtained revealed that 12 of them resulted polymorphic in at least 2 species (15a6, Fepo42, Oe053, Oe054, Oe128, Oe129, Oe142, Oe149, Oe321, SneD113, SneD218, Tgu06) and were retained for further analyses. Fepo42 and Oe054 resulted monomorphic in S. aluco, and Oe129 did not give any amplification product in B. bubo but were retained.

3. Evaluation of the STR Potential in Other Subfamilies of Strigidae

In order to evaluate the potential application of the STR panel for forensic purposes, the 12 microsatellites were used on a larger panel of samples, which included:
1. Additional species belonging to the already analyzed tribes of Bubonini and Strigini (Bubo scandiacus, Strix uralensis, Strix nebulosa);
2. Two species belonging to the tribes of Asionini (Asio otus) and Otini (Otus scops);
3. Two species belonging to the Surninae subfamily, Tribes Surnini (Surnia ulula, Glaucidium passerinum).
4. Tyto alba, belonging to the Tytonidae family, subfamily Tytoninae.
Three family groups were chosen for each species except for A. otus, S. uralensis and G. passerinum because only two confirmed parental nuclei were available in the database. The final dataset consisted of 81 individuals belonging to 27 families.
The DNA of each of the 81 individuals was amplified using the twelve primer sets. Data obtained revealed that the DNA from the additional species included in the analysis (O. scops, A. otus, B. scandiacus, S. ulula, S. uralensis, S. nebulosa, G. passerinum, T. alba) was amplified at the examined loci with the following exceptions:
1. S. ulula showed fixed genotypes at four loci (Oe054, Oe129, Oe053, Oe321);
2. Ten loci were amplified in G. passerinum. However, only four loci were polymorphic. Because of lack of variable loci, G. passerinum was removed from the further analysis;
3. S. uralensis and S. nebulosa showed no polymorphisms at Oe321 and Oe054 loci;
4. In A. otus, a unique fixed allele was recorded at locus Oe142;
5. Six loci were amplified in T. alba (FePo42, Oe54, Oe128, Oe129, Oe321, Tgu06), but only 2 were variable (FePo42, Tgu06). Thus, this species was discarded from further analyses because two loci are not enough to be able to distinguish individuals reliably.
All the percentage values of polymorphic loci per species varied between 100% (n = 12 in A. noctua and O. scops) and 66.67% (n = 8 in S. ulula), if we do not take into account the value in G. passerinum and T. alba.

4. Genetic Variability between and within Species
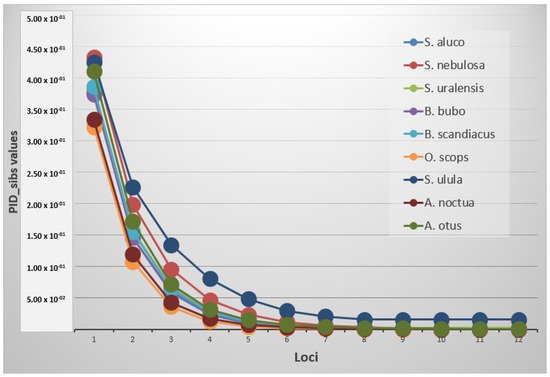
Statistical analysis was carried out on 9 species at 12 loci. The mean allele number (NA) was 3.7 (±0.2), with the highest values recorded respectively in O. scops (6.3 ± 0.6) and the lowest one in S. ulula (2.2 ± 0.3). Mean expected and observed heterozygosity (He and Ho) ranged from 0.750 ± 0.027 and 0.733 ± 0.049 in O. scops to 0.318 ± 0.074 and 0.356 ± 0.088 in S. ulula with an average value of 0.525 ± 0.025 and 0.566 ± 0.030, respectively. The probability of identity resulted in different thresholds depending on the species and if it was estimated for unrelated or related individuals (Figure 1). A PID value lower than 0.001 was reached in all the species using an average of 3.9 markers, while the same value was achieved with PIDsib using at least an average of 9.2 loci. S. ulula, S. nebulosa and S. uralensis were not included in this last computation because their threshold resulted higher using all the loci (minimum values respectively of 0.0155, 0.00162 and 0.00246).
Figure 1. Graph of the PIDsib trend in the species.
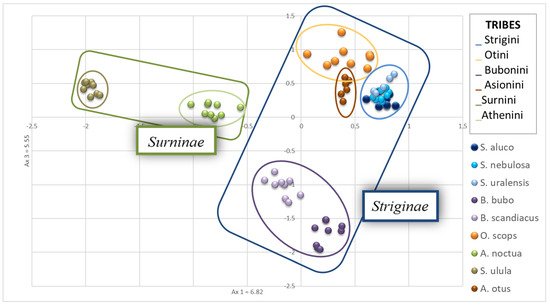
A principal component analysis was then carried out, revealing that, as expected, the three species of the genus Strix (S. uralensis, S. nebulosa, S. aluco) overlapped in the PCA graphic (Figure 2). A. otus and O. scops showed a low distance from each other and resulted not very distant from the Strix species. S. ulula exhibited the greatest genetic distance from the other species while A. noctua was in a mid-range position (Figure 2). B. scandiacus and B. bubo did not overlap, but the genetic distance of the two species is low.
Figure 2. Principal Component Analysis plot obtained using Genetix and visualized in Excel. Strix sp. overlapped while Bubo bubo and Bubo scandiacus plotted very closed each other. Surnia ulula individuals diverged consistently from other species. Ovals in different colors represent the distribution of individuals belonging to six tribes of Striginae and Surninae, in the blue and green squares, respectively.

5. Evaluation of the STR Potential Panel for Parentage Analysis in Family Groups

The paternity test yielded inconsistent results and different reliability values depending on the species. Using the software Colony 2.0, the correct parent pair was assigned with the maximum probability value (1.00) but decreased in S. nebulosa (0.992 and 0.907), S. uralensis (0.997), and S. ulula (0.983 and 0.753) when the computation has been limited to association with putative mother or father. In two individuals, respectively, of S. uralensis (S_ur6) and S. ulula (S_ul3), the probability of assignment to the right parent is reduced to 0.500. In Cervus, using the LOD computation, all the individuals have been correctly associated with the right parents with trio confidence values higher than 95%, except for S_ul3 that has been associated with the wrong father (S_ul5 instead of S_ul2). In S. uralensis (S_ur6), the assignment to the right mother did not reach a significant value. Using the Delta calculation, the probability values decreased in S. nebulosa, S. uralensis and S. ulula. Again, S_ul3 was associated with the wrong father.

6. Discussion

International wildlife trafficking today is recognized as one of the largest organized transnational crimes [2], which equals the trafficking of drugs, arms and humans (World Wildlife Report, United Nations: Office on Drugs and Crime).
Genotyping assays through microsatellites are a rapid, informative and low-cost approach for linking evidence to crimes in forensic investigations [3]. Thanks to high mutation rates, microsatellites are used within the context of monitoring illegal wildlife trade primarily to identify individuals, assign to specific populations or for relatedness testing. Oklander et al. [3] generated a multilocus microsatellite genotype reference database of the black and gold howler monkey (Alouatta caraya), a neotropical primate threatened by habitat loss and capture for illegal trade in Argentina, to assign confiscated individuals to localities of origin, illustrating the applicability of genotype databases for inferring hotspots of illegal capture. Potoczniak et al. [3] developed a STR genotyping assay able to associate a biological sample to Asian elephant (Elephas maximus) or African elephant (Loxodonta africana). Fitzsimmons et al. [4] designed a panel of 26 microsatellite loci for Crocodylus spp. to verify population assignment, mating system and gene flow. Jan and Fumagalli [5] isolated DNA microsatellite markers in seven parrot species threatened with extinction and subjected to illegal trafficking, characterized a total of 106 polymorphic microsatellite markers and tested them for individual identification and parental analyses. Mucci and colleagues [6] developed a panel of 16 de novo sequenced microsatellites (STRs) for Testudo graeca and tested its effectiveness for parentage analysis in two other species of endangered tortoises, T. hermanni and T. marginata.
Given the utility of STR-based approaches to answer questions related to wildlife crime investigations as forensic genetics, efforts should be devoted to the characterization of microsatellite primers for species threatened by illegal trafficking. However, while in human forensics, the selection of around 20 core STR loci allowed the standardization around the globe for human identity testing [7][8], accomplishing this same achievement is more challenging for the hyper-diverse animal assemblage encountered in wildlife forensics [2]. The lack of species-specific molecular markers or their inadequate representation in genetic databases is major limitation in wildlife forensics [9].
Cross-amplification is a widely used approach permitting to avoid investing time and money in the development of new markers, and many studies have proven the efficiency of microsatellite loci developed in closely related species [6][10][11][12][13].
The first aim of this entry was to test for the presence of a minimum number of microsatellite loci reliable for individual identification and parentage analysis for forensic purposes in 11 species of Strigiformes listed in the CITES Appendix II and regularly traded in the Italian national market.
Literature data show that cross-species transferability is unevenly distributed across taxa. Barbará et al. [14] reviewed 64 primer notes and found more than 40% transfer success in mammals, more than 25% in fishes and more than 10% in birds. Our results permitted to define a unique panel of 12 out of 32 highly polymorphic microsatellites (37%), able to identify individuals in nine species of two subfamilies of Strigiformes (Striginae and Surninae) belonging to Family Strigidae (A. otus, A. noctua, B. bubo, B. scandiacus, O. scops, S. aluco, S. nebulosa, S. uralensis, S. ulula).
The test was non-efficient in individuals of T. alba in which only six markers yield a positive result but four of them resulted monomorphic. Such results could rely on the fact that T. alba is the only species of this study belonging to a different family [15]. The two monophyletic families of Strigiformes, Tytonidae and Strigidae, diverged in the middle of the Eocene [16]. The phylogenetic divergence of Tytonidae from Strigidae could be justified by the retrieved inefficiency of markers panel tested on species. Since only two subfamilies represent Tytonidae family with a single genus each [17] - Tytoninae with Tyto and Phodilinae with Phodilus - it is not possible to verify the discriminant power of tested markers on other species of the same taxon.
The common barn owl T. alba is one of the most cosmopolitan species and represents a taxon-rich species complex with several subspecies [18]. The interest in its conservation status clears the need for integrating this set with more polymorphic loci for this species. Twenty-one microsatellite loci already isolated and characterized in T. alba [19] could be tested for cross-amplification in CITES species to implement this panel.
The principal component analysis results reflect the most recent knowledge about taxonomy and systematics of Strigiformes [17].
A slightly better but similar result was obtained for G. passerinum, for which only 4 markers were polymorphic. The high number of monomorphic loci in this species could be due to several cumulative factors: the low number of related individuals analyzed, the high inbreeding of captive-bred individuals, or the inefficiency of the selected markers for this species. Unlike T. alba, microsatellites were developed only for a species of the same genera: Glaucidium brasilianum [20].
Evaluating the STR panel potential in identifying family groups, we found that in two out of the nine species analyzed (S. uralensis and S. ulula), the probability value associated with parent pairs was reduced. The PIDsib almost reached the 0.001 threshold value in S. ulula, S. nebulosa and S. uralensis. However, PID and PIDsib values are subjected to bias due to the low number of tested individuals per species and bottleneck in captive breeding facilities. For these three species, it could be helpful to increase the number of samples and markers to obtain a more confident individual identification and association to parent pairs.
Besides reducing time and costs when adopting a cross-amplification approach, another advantage of using a shared panel among several species is the possibility of comparing genetic variability values among species. Nevertheless, even if microsatellites loci are very useful genetic markers in studying the mating system, population genetics, and conservation of owls, many studies focus on species belonging to the same genus. Dial et al. [21] screened many markers developed in strigids but found only four polymorphic pairs in the great horned owl (Bubo virginianus), short-eared owl (Asio flammeus) and the snowy owl (Bubo scandiacus). In addition, another eight reliably amplified polymorphic fragments only in the great horned owl, eleven in the short-eared owl, and ten in the snowy owl.
Hsu et al. [22] developed six new microsatellite markers containing tetranucleotide repeat motifs (GATA/CTAT) for Lanyu scops owl (Otus elegans botelensis). They tested them, and additional further microsatellite primer pairs previously developed from O. elegans on four other species of owls (Otus lettia, Otus spilocephalus, Otus scops and Ninox scutulata). Data obtained showed a reduced degree of polymorphism with most of the loci resulting
It gives a valuable tool to implement research involving most Strigidae threatened by illegal trafficking, habitat loss and fragmentation in Italy and other countries.
Delport et al. [23] tested 19 loci originally developed for Vidua and Geospiza for cross-amplification in Nesospiza buntings. They detected a degree of polymorphism and heterozygosity lower in loci developed for Vidua than those explicitly developed for Nesospiza. These data demonstrate that microsatellite markers isolated in the reference species are frequently less variable in related species. Moreover, cross-species amplification is usually limited to the loci that were found polymorphic in the referent species.
This entry selected from the literature the most variable loci in each reference species: most polymorphic loci were discarded only when they were found monomorphic or did not give amplification products in all the target species, with only three exceptions, because of their utility in other species. We are aware that this a priori selection can cause an ascertainment bias, as suggested by Delport et al. [23]; however, we found high levels of polymorphisms in nine out 11 analyzed species.
Variability indices found in different species using this panel were not discordant from the ones found in the natural populations with different markers: Pellegrino et al. [24] found in the A. noctua European populations an average and an effective number of alleles = 5.6 and 3.5, respectively, and observed and expected heterozygosities equal to 0.59 and 0.61, respectively. Pertoldi et al. [25] found lower alleles in the Danish population (effective number of alleles = 2.8; Ho = 0.51 and He = 0.60), probably caused by a population bottleneck in the last decades.
Microsatellite loci represent reliable molecular markers to describe genetic variability or its drastic reduction, as demonstrated by Macías-Duarte et al. [26] that found different values in three different populations of Athene cunicularia, with the average number of alleles varying from 2.7 in Clarion Islands to 5.1 in Florida and 22.5 in Western North America.
Though their high polymorphism makes them adequate for conservation and forensic genetics purposes, the main difficulties are represented by comparing samples between laboratories.
This problem that has been resolved through the exchange of reference samples has been recently fixed by the set-up of an allelic ladder [27]. According to these authors, we constructed an allelic ladder for each locus to standardize a protocol between laboratories for conservation and forensic purposes.
Comparability between laboratories is now also possible thanks to high-throughput sequencing (HTS) technologies [28]. This application that has been developed and used in human forensics [29][30][31] has been already applied also in conservation genetics [32][33][34][35]. This method permits the sequencing of STRs, allowing the identification of the correct number of repeats. The possibility of multiplexing several dozen of markers from a single individual will allow cost and time reduction. De Barba et al. [36] used this protocol in the study of a brown bear population yielded reliable results of parentage analysis also from low quality DNA, confirming a broader application in conservation genetics and forensics.

This entry is adapted from the peer-reviewed paper 10.3390/genes12111721

References

  1. Wink, M.; El-Sayed, A.A.; Sauer-Gürth, H.; Gonzalez, J. Molecular phylogeny of owls (Strigiformes) inferred from DNA sequences of the mitochondrial cytochrome b and the nuclear RAG-1 gene. Ardea 2009, 97, 581–591.
  2. Smart, U.; Cihlar, J.C.; Budowle, B. International Wildlife Trafficking: A perspective on the challenges and potential forensic genetics solutions. Forensic Sci. Int. Genet. 2021, 54, 102551.
  3. Potoczniak, M.J.; Chermak, M.; Quarino, L.; Tobe, S.S.; Conte, J. Development of a multiplex, PCR-based genotyping assay for African and Asian elephants for forensic purposes. Int. J. Leg. Med. 2020, 134, 55–62.
  4. Fitzsimmons, N.N.; Tanksley, S.; Forstner, M.R.J.; Louis, E.E.; Daglish, R.; Gratten, J.; Davis, S. Microsatellite markers for Crocodylus: New genetic tools for population genetics, mating system studies and forensics. Crocodilian Biol. Evol. 2001, 51–57.
  5. Jan, C.; Fumagalli, L. Polymorphic DNA microsatellite markers for forensic individual identification and parentage analyses of seven threatened species of parrots (family Psittacidae). PeerJ 2016, 2016, 1–7.
  6. Mucci, N.; Giangregorio, P.; Cirasella, L.; Isani, G.; Mengoni, C. A new STR panel for parentage analysis in endangered tortoises. Conserv. Genet. Resour. 2020, 12, 67–75.
  7. Zhou, Z.; Shao, C.; Xie, J.; Xu, H.; Liu, Y.; Zhou, Y.; Liu, Z.; Zhao, Z.; Tang, Q.; Sun, K. Genetic polymorphism and phylogenetic analyses of 21 non-CODIS STR loci in a Chinese Han population from Shanghai. Mol. Genet. Genom. Med. 2020, 8, 1–8.
  8. Kumar, A.; Kumar, R.; Kumawat, R.K.; Shrivastava, P.; Chaubey, G. Genomic diversity at 22 STR loci (extended CODIS STR) in the population of Rajasthan, India. Gene Rep. 2021, 23, 101150.
  9. Rocco, F.D.; Anello, M. The Use of Forensic DNA on the Conservation of Neotropical Mammals. In Molecular Ecology and Conservation Genetics of Neotropical Mammals; Springer Nature Switzerland AG: Cham, Switzerland, 2021; pp. 85–98.
  10. Gebhardt, K.J.; Waits, L.P. Cross-species amplification and optimization of microsatellite markers for use in six Neotropical parrots. Mol. Ecol. Resour. 2008, 8, 835–839.
  11. Dawson, D.A.; Horsburgh, G.J.; Küpper, C.; Stewart, I.R.K.; Ball, A.D.; Durrant, K.L.; Hansson, B.; Bacon, I.; Bird, S.; Klein, Á.; et al. New methods to identify conserved microsatellite loci and develop primer sets of high cross-species utility—As demonstrated for birds. Mol. Ecol. Resour. 2010, 10, 475–494.
  12. Maulidi, A.; Fatchiyah, F.; Hamidy, A.; Kurniawan, N. Microsatellite Marker for Cross-Species Amplification: Study Case for Indonesian Sundaland Python (Serpentes: Pythonidae). J. Exp. Life Sci. 2018, 8, 61–65.
  13. Du Toit, Z.; Dalton, D.L.; du Plessis, M.; Jansen, R.; Grobler, J.P.; Kotzé, A. Isolation and characterization of 30 STRs in Temminck’s ground pangolin (Smutsia temminckii) and potential for cross amplification in other African species. J. Genet. 2020, 99.
  14. Barbará, T.; Palma-Silva, C.; Paggi, G.M.; Bered, F.; Fay, M.F.; Lexer, C. Cross-species transfer of nuclear microsatellite markers: Potential and limitations. Mol. Ecol. 2007, 16, 3759–3767.
  15. König, C.; Weick, F. Owls of the World; AandC Black Publishers Ltd.: London, UK, 2008.
  16. Prum, R.O.; Berv, J.S.; Dornburg, A.; Field, D.J.; Townsend, J.P.; Lemmon, E.M.; Lemmon, A.R. A comprehensive phylogeny of birds (Aves) using targeted next-generation DNA sequencing. Nature 2015, 526, 569–573.
  17. Wink, M.; Sauer-Gurth, H. Molecular taxonomy and systematics of owls (Strigiformes)—An update. Airo 2021, 29, 487–500.
  18. Aliabadian, M.; Alaei-Kakhki, N.; Mirshamsi, O.; Nijman, V.; Roulin, A. Phylogeny, biogeography, and diversification of barn owls (Aves: Strigiformes). Biol. J. Linn. Soc. 2016, 119, 904–918.
  19. Burri, R.; Antoniazza, S.; Siverio, F.; Klein, Á.; Roulin, A.; Fumagalli, L. Isolation and characterization of 21 microsatellite markers in the barn owl (Tyto alba). Mol. Ecol. Resour. 2008, 8, 977–979.
  20. Proudfoot, G.; Honeycutt, R.; Douglas Slack, R. Development and characterization of microsatellite DNA primers for ferruginous pygmy-owls (Glaucidium brasilianum). Mol. Ecol. Notes 2005, 5, 90–92.
  21. Dial, C.R.; Talbot, S.L.; Sage, G.K.; Seidensticker, M.T.; Holt, D.W. Cross-species Amplification of Microsatellite Markers in the Great Horned Owl Bubo virginianus, Short-eared Owl Asio flammeus and Snowy Owl B. scandiacus for Use in Population Genetics, Individual Identification and Parentage Studies. J. Yamashina Inst. Ornithol. 2012, 44, 1–12.
  22. Hsu, Y.C.; Li, S.H.; Lin, Y.S.; Severinghaus, L.L. Microsatellite loci from Lanyu scops owl (Otus elegans botelensis) and their cross-species application in four species of strigidae. Conserv. Genet. 2006, 7, 161–165.
  23. Delport, W.; Grant, T.J.; Ryan, P.G.; Bloomer, P. Ten microsatellite loci for evolutionary research on Nesospiza buntings. Mol. Ecol. Notes 2006, 6, 1180–1183.
  24. Pellegrino, I.; Negri, A.; Boano, G.; Cucco, M.; Kristensen, T.N.; Pertoldi, C.; Randi, E.; Šálek, M.; Mucci, N. Evidence for strong genetic structure in European populations of the little owl Athene noctua. J. Avian Biol. 2015, 46, 462–475.
  25. Pertoldi, C.; Pellegrino, I.; Cucco, M.; Mucci, N.; Randi, E.; Laursen, J.T.; Sunde, P.; Loeschcke, V.; Kristensen, T.N.; du Toit, Z.; et al. Genetic consequences of population decline in the Danish population of the little owl (Athene noctua). Mol. Ecol. 2020, 14, 358–367.
  26. Macías-Duarte, A.; Conway, C.J.; Holroyd, G.L.; Valdez-Gómez, H.E.; Culver, M. Genetic Variation among Island and Continental Populations of Burrowing Owl (Athene cunicularia) Subspecies in North America. J. Raptor Res. 2019, 53, 127–133.
  27. Biello, R.; Zampiglia, M.; Corti, C.; Deli, G.; Biaggini, M.; Crestanello, B.; Delaugerre, M.; Di Tizio, L.; Leonetti Francesco, L.; Stefano, C.; et al. Mapping the geographic origin of captive and confiscated Hermann’s tortoises: A genetic toolkit for conservation and forensic analyses. Forensic Sci. Int. Genet. 2021, 51, 102447.
  28. Glenn, T.C. Field guide to next-generation DNA sequencers. Mol. Ecol. Resour. 2011, 11, 759–769.
  29. Fordyce, S.L.; Ávila-Arcos, M.C.; Rockenbauer, E.; Børsting, C.; Frank-Hansen, R.; Petersen, F.T.; Willerslev, E.; Hansen, A.J.; Morling, N.; Gilbert, T.P. High-throughput sequencing of core STR loci for forensic genetic investigations using the Roche Genome Sequencer FLX platform. BioTechniques 2011, 51, 127–133.
  30. Bornman, D.M.; Hester, M.E.; Schuetter, J.M.; Kasoji, M.D.; Minard-Smith, A.; Barden, C.A.; Faith, S.A. Short-read, high-throughput sequencing technology for STR genotyping. BioTechniques. Rapid Dispatches 2012, 23, 1–7.
  31. Van Neste, C.; Van Nieuwerburgh, F.; Van Hoofstat, D.; Deforce, D. Forensic STR analysis using massive parallel sequencing. Forensic Sci. Int. Genet. 2012, 6, 810–818.
  32. Stoeckle, B.C.; Theuerkauf, J.; Rouys, S.; Gula, R.; Lorenzo, A.; Lambert, C.; Kaeser, T.; Kuehn, R. Identification of polymorphic microsatellite loci for the endangered Kagu (Rhynochetos jubatus) by high-throughput sequencing. J. Ornithol. 2012, 153, 249–253.
  33. Pimentel, J.S.M.; Carmo, A.O.; Rosse, I.C.; Martins, A.P.V.; Ludwig, S.; Facchin, S.; Pereira, A.H.; Brandão-Dias, P.F.P.; Abreu, N.L.; Kalapothakis, E. High-throughput sequencing strategy for microsatellite genotyping using neotropical fish as a model. Front. Genet. 2018, 9, 1–8.
  34. Qi, W.H.; Lu, T.; Zheng, C.L.; Jiang, X.M.; Jie, H.; Zhang, X.Y.; Yue, B.S.; Zhao, G.J. Distribution patterns of microsatellites and development of its marker in different genomic regions of forest musk deer genome based on high throughput sequencing. Aging 2020, 12, 4445–4462.
  35. Song, C.; Feng, Z.; Li, C.; Sun, Z.; Gao, T.; Song, N.; Liu, L. Profile and development of microsatellite primers for Acanthogobius ommaturus based on high-throughput sequencing technology. J. Oceanol. Limnol. 2020, 38, 1880–1890.
  36. De Barba, M.; Miquel, C.; Lobréaux, S.; Quenette, P.Y.; Swenson, J.E.; Taberlet, P. High-throughput microsatellite genotyping in ecology: Improved accuracy, efficiency, standardization and success with low-quantity and degraded DNA. Mol. Ecol. Resour. 2017, 17, 492–507.
More
Video Production Service