Your browser does not fully support modern features. Please upgrade for a smoother experience.
Please note this is an old version of this entry, which may differ significantly from the current revision.
Subjects:
Engineering, Electrical & Electronic
The use of power networks can induce harmonic pollution, disturbances, and power quality events within a power grid, leading to abnormal operating conditions of equipment and materials. It is, therefore, mandatory to characterize power quality disturbances in order to enhance the power system’s efficiency and reliability.
- smart grid
- signal processing
- disturbance classification
- power quality
1. Power Grid Disturbances
Power grid disturbances can be classified as either affecting the fundamental frequency component (50 Hz or 60 Hz) or harmonic disturbances. Fundamental frequency disturbances affect the amplitude, frequency, and initial phase shift of the fundamental frequency such as voltage dips, outages, overvoltages and unbalances. Harmonic disturbances induce distortion of the signals (voltages or currents) waveform and are characterized by the appearance of new frequency components that are multiples of the fundamental frequency.
2. Typical Power Quality Disturbances
A balanced electrical grid is a three-phase power system characterized by sinusoidal waveforms, where the three-phases have the same fundamental frequency (equal to the nominal value), the same voltage magnitude, and a phase shift of 120∘. If one of these conditions is not satisfied, the power grid is considered to be experiencing a power quality disturbance. A power quality disturbance is defined as any problem that causes voltage or frequency deviations in the power supply and may result in equipment failure or malfunction of the power grid, which may cause issues at the load ends. These power quality events include voltage sag, very short interruptions, voltage swell, voltage fluctuation, voltage unbalance, harmonics, inter-harmonics, distortion, spikes, notches, flicker, noise and transients. Figure 1 depicts a classification of major power quality disturbances as described in the literature [1][2][3][4]. These power quality disturbances can be broadly classified into two categories, which are power quality variations and events. Power quality variation is regarded as a steady-state disturbance and corresponds to a small frequency and amplitude deviation from its nominal values. Conversely, a power quality event is related to a large deviation such as outage, sag, and swell. These disturbances can have a substantial influence on grid stability, security (protective relays malfunction), equipment’s useful life, and power system measurement performance and generate electromagnetic noise.
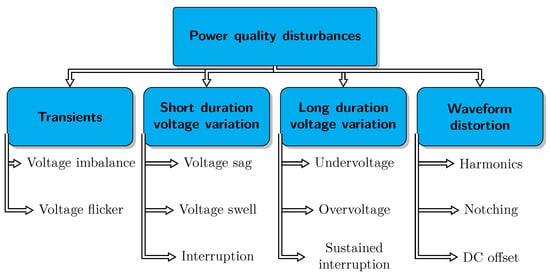
Figure 1. Power quality disturbance classification.
2.1.Causes and Consequences
Poor power quality issues can be due to several causes and conditions. Inductive and capacitive loads such as motors, ballasts, and electronic devices can induce a voltage and current phase angle, which deteriorates the power factor quality. Nonlinear loads and operating loads with rapidly changing energy demand cause harmonics, which require static and dynamic filters to mitigate. Improper load distribution across each phase leads to phases being unbalanced. High energy loads turning on or off cause voltage variations (dips and swells), which can be mitigated by proper load capacity resizing and adjusting transformer tapping. Transients are characterized by fast (sub-half cycle) changes in voltage, which exceeds the device insulation breakdown voltage rating, and are caused by switch contacts (arcing) and lightning.
These PQ disturbances affect businesses in different ways such as loss of production, products damage, reduced lifetime of equipment, loss of data or data corruption, etc. Table 2 summarizes typical power quality disturbance causes and the main consequences [1][5].
Table 2. Power quality disturbance causes and consequences.
| Category | Typical Causes | Main Consequences |
|---|---|---|
| Notching | Lightning strike, transformer energization, capacitor switching, disconnection of heavy loads, power electronic rectifiers commutation | Destruction of components and insulation materials, data processing error, electromagnetic interference, etc. |
| Voltage spikes | Lightning, switching of lines or power factor correction capacitors, disconnection of heavy loads | Destruction of components and of insulation materials, data processing errors or data loss, electromagnetic interference |
| Voltage flicker | Line, capacitor or load switching, frequent start/stop of electric motors and oscillating loads, arc furnace | Light flickering, unsteadiness of visual perception |
| Overvoltage | Switching large load, energizing a capacitor bank, incorrect tap settings on transformers | Light flicker, stoppage or damage of sensitive equipment |
| Harmonic | Nonlinear loads (variable speed drives, SMPS), data processing equipment, high efficiency lighting, arc furnaces, electric machines working above the knee of the magnetization curve | Transformers overheating, neutral overload, overheating of cables and equipment, loss of efficiency in electric machines, increased probability in the occurrence of resonance, electromagnetic interference with communication systems, errors in measures when using average reading meters, nuisance tripping of thermal protections. |
| Undervoltage | Switching on a large load or switching off a large capacitor bank | Light flicker, unsteadiness of visual perception |
| Voltage swell | Start or stop of heavy loads, badly dimensioned power sources and regulated transformers, system faults, load and capacitor switching | Light flicker, data loss, stoppage or damage of sensitive equipment |
| Voltage sag | Faulty consumer installations, faulty transmission or distribution electric network, start-up of large motors and connection of heavy loads | Malfunction of information technology equipment, tripping of contactors and electromechanical relays and loss of efficiency in electric rotating machines |
| Interruptions | Equipment failure in the power system network, tripping of protection devices, storms, human errors, failure of protection devices | Stoppage of all equipment |
Power quality characterization is of paramount importance in order to improve the power systems safety and reliability. Figure 2 depicts power quality characterization stages, which include signal acquisition based on appropriate sensors, feature extraction stage for signal parameter estimation, detection stage, and finally the classification stage to determine PQ disturbance types [6]. The feature extraction stage is performed based on advanced signal processing approaches, which include power spectral density estimation techniques, demodulation techniques, and time–frequency analysis. The classification stage is mainly performed using machine learning approaches.
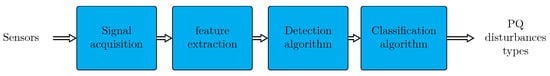
Figure 2. PQ monitoring algorithm.
2.2. Power Quality Analysis
Moving towards smart grids requires advanced control strategies, energy management systems, modern protective devices, and power quality monitoring to deal with PQ issues. The latter can be performed using measurement substations, which use intelligent electronic devices, including PMUs and supervisory control and data acquisition (SCADA) infrastructure. PMUs are used for the secure measurement and parameter estimation of power signals. These parameters are transferred to a central controller via a SCADA infrastructure for further post-processing and transient characterization of PQ disturbance. These characteristics allow higher power quality and less downtime while supporting power from intermittent power sources and distributed generation.
2.3. Definition
Power quality is an estimate of the stability of the power supply in terms of voltage magnitude, frequency, and waveform required for the safe, correct, and continuous operation of a specific electrical load. Indeed, maintaining PQ requirements of voltage and current in a power system to the right level enables safe and continuous operation of electric loads. Good power quality can be viewed as a steady supply voltage that is within the prescribed range, has a frequency close to the rated value, and has a waveform close to sine wave (no distortion, no harmonics, no spikes and flicker, etc.). The electric power system is composed of electricity generation devices, electric power transmission lines, an electric power distribution network, and finally, the electricity meters at the end-users level. The electric power system complexity combined with meteorological events, generation and consumption fluctuations, power electronics usage at grid and consumers levels, as well as the integration of intermittent and distributed generation systems provide several factors that comprimise the power quality.
2.4. Wide Area Measurement System
A wide area measurement system (WAMS) is a stand-alone measurement technology, information tool, and operational infrastructure that complements the conventional supervisory control and data acquisition system (SCADA) used for main grid control and monitoring [7]. WAMS is designed for the monitoring of real-time dynamics of power systems, identification of control and stability weaknesses, and implementation of countermeasures in order to enhance the power system reliability [8]. It allows obtaining more detailed data (specifically, the real-time synchrophasors) on the steady-state power system operating condition and transients that arise due to various power system disturbances. The main objectives of WAMS are real-time monitoring, post-disturbance analysis, adaptive protection and power system restoration. Figure 3 provides a scheme describing the components of WAMS. It includes PMUs, PDC, GPS for time synchronization of the phasors, communication channels, visualization and analysis tools, a wide area situational awareness system and a wide area protection and control system.
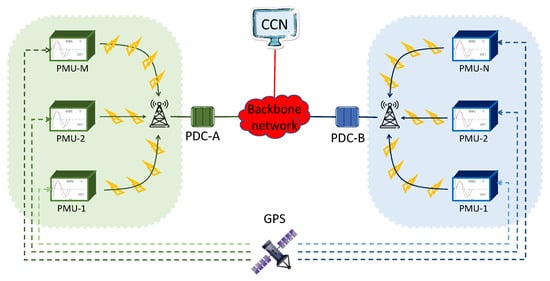
Figure 3. Phasor data concentrator in Wide Area Measurement System (CCN stands for central control network).
2.5. Phasor Measurement Units
A phasor measurement unit (PMU) is a high-speed smartmeter used for power systems state estimation and power quality monitoring with accuracy in the order of microseconds, which is much faster than the existing SCADA technologies [9][10]. PMU allows estimating the frequency, magnitude and phase angle of an electrical phasor quantity (voltage or current) with respect to global time reference in order to obtain synchronized real-time measurements of multiple widely dispersed locations in the power system network [11][12]. Time synchronization is mainly provided by the Global Positioning System (GPS) or IEEE 1588 Precision Time Protocol. The measured quantities are represented by a synchrophasor, as depicted by Figure 4. The calculation of real-time phasor measurements that are synchronized to an absolute time reference is of paramount importance as it allows an efficient response to power system disturbances and possible cascading blackouts.
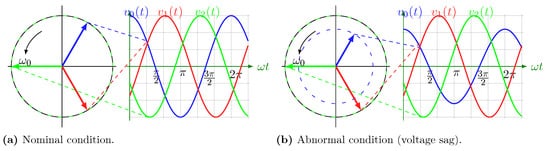
Figure 4. Synchrophasor representation of a sinusoidal signal for healthy and faulty conditions (voltage sag on phase 1).
PMU measures voltages and currents at critical substations of the power transmission lines and computes time-stamped phasors, as depicted by Figure 5. A real-time comparison of these synchronized measurements allows assessing power system conditions and detecting disturbances that may affect the power quality. The phasor data are collected either on-site or at centralized locations using Phasor Data Concentrator (PDC) technologies (see Figure 3) [13]. A PDC receives and time-synchronizes phasor data from multiple PMUs to produce a real-time, time-aligned output data stream. These data are then transmitted to a regional monitoring system (central control network), which is operated by the local grid operator. Due to the precise synchronization of the measurements, this power grid monitoring allows controlling power flow from multiple energy generation sources, implementing demand response mechanisms (load shedding) and event detection and classification for black-out event prevention [11].
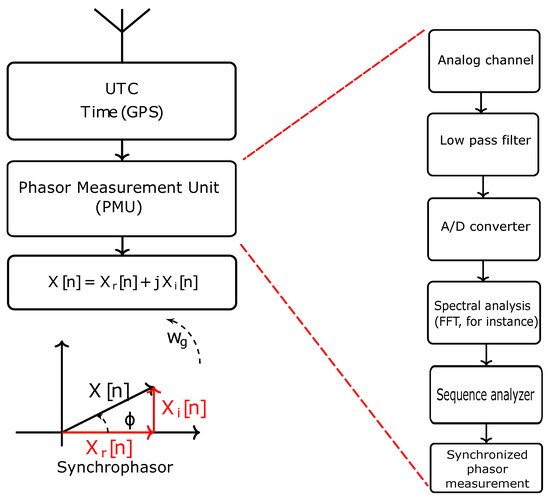
Figure 5. Phasor measurement units.
2.6. International Standards
Power quality in smart grids is defined by international standards and their local derivatives, adopted by various countries and electricity suppliers. Specifically, there are two international organizations that set forth power quality standards, which are the International Electrotechnical Commission (IEC) and the Institute of Electrical and Electronics Engineers (IEEE). Main power quality standards are as follows:
-
IEC/IEEE 60255-118-1:2018 is used for synchrophasor measurement systems in power systems. It defines PMU, synchrophasor, frequency, and ROCOF measurements. Even though it does not provide hardware and software for computing these quantities, it specifies methods for evaluating the compliance of these measurements with standard requirements under both static and dynamic conditions.
-
EN50160 is the European standard for power quality measurement, defining the acceptable limits of voltages and currents RMS values with respect to nominal values and the disturbance duration in AC power.
-
IEEE-519 is the North American guideline for power systems. It is intended as “recommended practice” and refers to both current and voltage distortion.
-
IEC 61000-4-30 is the standard defining methods for power quality monitoring. Specifically, it provides a description of measurement methods and PQ parameters interpretation [14]. Unlike earlier editions, the 2015 Edition 3 includes current measurements as well as voltage measurement.
Regarding PMU, the standard IEEE C37.118-2005 deals with issues related to PMUs integration into electric power systems. This standard is mainly describing the measurement accuracy testing and certification requirements, data transmission format and communication protocol. To handle power system dynamic behavior, the standard has been updated and split into two parts in 2011 (and its amendment C37.118-2014): C37.118-1 dealing with the phasor estimation and C37.118-2 describing the communications protocol. Moreover, two PMU classes have been introduced: M class to use in steady state measurement and P class to track power system dynamic activity. The phasor measurement unit is intended for accurate phasor estimation under both steady state and dynamic conditions. To be compliant with the IEEE C37.118-2014 standard, the PMU measurement and estimation accuracy is measured through several parameters such as total vector error (TVE), frequency error, and rate of change of frequency error.
This entry is adapted from the peer-reviewed paper 10.3390/electronics10212725
References
- Bollen, M.H. Understanding power quality problems. In Voltage Sags and Interruptions; IEEE Press: Piscataway, NJ, USA, 2000.
- Dahal, O.P.; Brahma, S.M.; Cao, H. Comprehensive clustering of disturbance events recorded by phasor measurement units. IEEE Trans. Power Deliv. 2013, 29, 1390–1397.
- Saini, M.K.; Kapoor, R. Classification of power quality events–a review. Int. J. Electr. Power Energy Syst. 2012, 43, 11–19.
- Oubrahim, Z. On Electric Grid Power Quality Monitoring Using Parametric Signal Processing Techniques. Ph.D. Thesis, Thèse de Doctorat de l’Université de Bretagne Occidentale, Brest, France, November 2017.
- De Almeida, A.; Moreira, L.; Delgado, J. Power quality problems and new solutions. In Proceedings of the International Conference on Renewable Energies and Power Quality, Vigo, Spain, 9–11 April 2003; Volume 3.
- Bollen, M.H.; Gu, I.Y.; Santoso, S.; McGranaghan, M.F.; Crossley, P.A.; Ribeiro, M.V.; Ribeiro, P.F. Bridging the gap between signal and power. IEEE Signal Process. Mag. 2009, 26, 12–31.
- Bashian, A.; Assili, M.; Anvari-Moghaddam, A.; Catalão, J.P.S. Optimal Design of a Wide Area Measurement System Using Hybrid Wireless Sensors and Phasor Measurement Units. Electronics 2019, 8, 1085.
- Bashian, A.; Assili, M.; Anvari-Moghaddam, A. A security-based observability method for optimal PMU-sensor placement in WAMS. Int. J. Electr. Power Energy Syst. 2020, 121, 106157.
- Monti, A.; Muscas, C.; Ponci, F. Phasor Measurement Units and Wide Area Monitoring Systems; Academic Press: Cambridge, MA, USA, 2016.
- Chakrabarti, S.; Kyriakides, E. Optimal placement of phasor measurement units for power system observability. IEEE Trans. Power Syst. 2008, 23, 1433–1440.
- Tholomier, D.; Kang, H.; Cvorovic, B. Phasor measurement units: Functionality and applications. In Proceedings of the 2009 Power Systems Conference, Clemson, SC, USA, 10–13 March 2009; pp. 1–12.
- Singh, B.; Sharma, N.; Tiwari, A.; Verma, K.; Singh, S. Applications of phasor measurement units (PMUs) in electric power system networks incorporated with FACTS controllers. Int. J. Eng. Sci. Technol. 2011, 3.
- Khan, R.H.; Khan, J.Y. A comprehensive review of the application characteristics and traffic requirements of a smart grid communications network. Comput. Netw. 2013, 57, 825–845.
- International Standard. Testing and Measurement Techniques—Power Quality Measurement Methods. March 2021. Available online: https://webstore.iec.ch/publication/68642 (accessed on 13 October 2021).
This entry is offline, you can click here to edit this entry!