Fibrosis is often known as a response of a tissue to injury, and since the three transforming growth factor-beta (TGF-β) isoforms (TGF-β1, -β2, and -β3) are the main regulators of cell migration, differentiation, proliferation, and gene expression, they were implicated in both reparative and fibrotic responses. All three TGF-β isoforms are homologues, sharing an extensive similarity in their amino acid sequences (80%), which may result in overlapping functions (i.e., SMAD-dependent signaling, modulating inflammatory responses); however, subtle differences in the sequences exist, thus potentially eliciting opposing effects. For example, several studies showed that TGF-β1 and -β2 are factors that drive the formation of fibrosis in corneal scarring models [8,9,10], whereas TGF-β3 was reported to downregulate fibrosis and promote scarless wound healing (healing without fibrosis).
1. Introduction
To date, we have a limited understanding of the opposing signaling mechanisms observed between TGF-β1/-β2 and TGF-β3 in the context of corneal fibrosis. However, it was shown that TGF-β1 stimulates the induction of stromal fibroblast differentiation to myofibroblasts, which are a contractile cell type, characterized by the expression of α-smooth muscle actin (αSMA, which is the protein product of the
ACTA2 gene) [
2,
20,
21]. During normal wound healing, myofibroblasts are transiently present and responsible for secreting a collagen-rich scar extracellular matrix (ECM) and closing the wound [
22,
23]. When persistent in tissues, they are a well-established early histological marker of progressive organ fibrosis (lung, kidney), cancer, and other diseases [
3,
12,
24]. When working inappropriately, myofibroblasts alter the tissue architecture and modulate the extracellular milieu [
24,
25,
26,
27,
28,
29,
30,
31,
32]. Previously, we developed an in vitro, three dimensional (3D) corneal stromal construct model comprised of human corneal fibroblasts (hCF) stimulated with a stable form of ascorbic acid (Vitamin C) to secrete a self-assembled matrix [
16,
33,
34]. This model was well characterized, and cells in such an environment were shown to function and exhibit a behavior akin to an in vivo model [
16,
33]. Additionally, we showed that when stimulated by TGF-β1 or -β3, this corneal stroma-like microenvironment mirrors the response observed in other corneal models [
5,
16,
33,
35].
In the cornea, there is a fine balance between corneal cells and their microenvironment, and this equilibrium is necessary to maintain corneal transparency [
36], which is imperative for visual acuity. If disturbed, as by an injury or disease, the ECM may become disrupted and disorganized, which potentially leads to opacification and blindness. ECM remodeling may disrupt cell proliferation and migration, as well as other processes shown to be dependent upon adhesion to the ECM [
37,
38,
39]. Integrins are major cell adhesion receptors for ECM ligands and key mediators for cell attachment to ECM and TGF-β-mediated myofibroblast differentiation [
36,
40,
41,
42]. Importantly, the activation of adhesion-dependent integrins recruits focal adhesion kinase (FAK), a crucial protein which is activated at focal adhesions that phosphorylate and bind to SRC [
42,
43,
44,
45]. This FAK/SRC complex induces many signaling cascades and triggers the cellular response to ECM by acting as a signaling integrator at sites of integrin/matrix engagement [
46]. Therefore, targeting FAK may interrupt signaling cascades that are important for fibroblast to myofibroblast differentiation, thereby disrupting the persistent fibrotic response.
2. Identification of Differentially Expressed Genes in hCF Constructs following TGF-β1 or TGF-β3 Treatment
To investigate whether TGF-β1 or -β3 treatment modulates the expression of genes involved in wound healing and fibrosis, we performed a RT
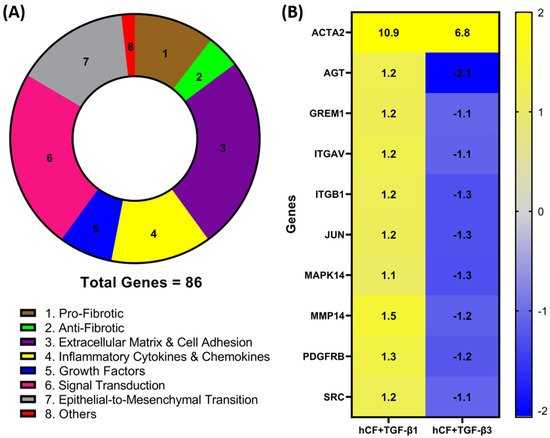
2 profiler PCR array analysis of the mRNA obtained from 4-week hCF 3D constructs after TGF-β1 or -β3 treatment. A total of 86 genes (
Table A1—
Appendix A) were measured, and their association with distinct pathways was mapped (
Figure 1A). Genes with a fold change (<−1.0 or >1.0) between mRNA profiles from untreated 3D constructs vs. treated (TGF-β1 or -β3) were confirmed. Whilst the magnitude of change was dissimilar for many genes, the presented heatmap (
Figure 1B) narrows that number and lists 9 genes—
AGT,
GREM1,
ITGAV,
ITGB1,
JUN,
MAPK14,
MMP14,
PDGFR, and
SRC—that expressed a >1.0-fold increase in TGF-β1 treatment and <−1.0-fold decrease in TGF-β3 treatment that were significantly (
p < 0.05) different compared to untreated, as well as between the two different TGF-β treatments. Furthermore, we extended our observations to include integrins
ITGAV and
ITGB1 (
Figure 1), as well as
ITGB3, ITGB5, and
ITGB6 (
Table A1—
Appendix A), which were elevated with TGF-β1 treatment compared to TGF-β3. These genes are involved in the profibrotic, extracellular matrix, and cell adhesion pathways, as shown in
Figure 1A. Also included in the heatmap is
ACTA2, which, following both TGF-β1 and -β3 treatments, was significantly (
p < 0.05) upregulated compared to untreated controls; however, TGF-β3 treatment did not augmented
ACTA2 expression to the same levels as seen with TGF-β1 treatment. Interestingly, these mRNA profiles highlight examples of dissimilarities, which show that TGF-β1 and -β3 impact distinct effects on genes involved in wound healing and fibrosis in hCF 3D constructs. In addition, the fact that
ACTA2 gene expression was upregulated after treatment with TGF-β1 and -β3 to varying degrees, supports previous data that these isoforms can have differential effects on corneal fibrosis.
Figure 1. Identification of differentially expressed fibrotic and wound-healing genes following TGF-β1 or -β3 treatment in hCF constructs. A RT2 Profiler PCR array analysis of human fibrosis and wound-healing gene expression was performed. Total RNA was extracted from human corneal fibroblast (hCF) 3D constructs that were untreated or treated continuously with TGF-β1 or -β3 for 4 weeks, subjected to cDNA synthesis, and analyzed with Human Fibrosis and Wound Healing PCR Array. (A) Pie chart showing distribution of targeted 86 genes and their relevant biological processes (labeled 1–8) within CR array. (B) Heatmap of targeted genes comparing RNA profile derived from hCF + TGF-β1 or hCF + TGF-β3 relative to untreated hCF constructs with a * p < 0.05: ACTA2, Alpha smooth muscle actin; AGT, Angiotensinogen; GREM1, Gremlin 1; ITGAV, Integrin Subunit Alpha V; ITGB1, Integrin Subunit Beta 1; JUN, Jun Proto-Oncogene, AP-1 Transcription Factor Subunit; MAPK14, Mitogen-Activated Protein Kinase 14; MMP14, Matrix Metallopeptidase 14; PDGFRB, Platelet Derived Growth Factor Receptor Beta; SRC, SRC Proto-Oncogene, Non-Receptor Tyrosine Kinase. Fold change values: blue (−2) to yellow (+2) through grey.
3. TGF-β1 Enhances FAK mRNA and Protein Expression
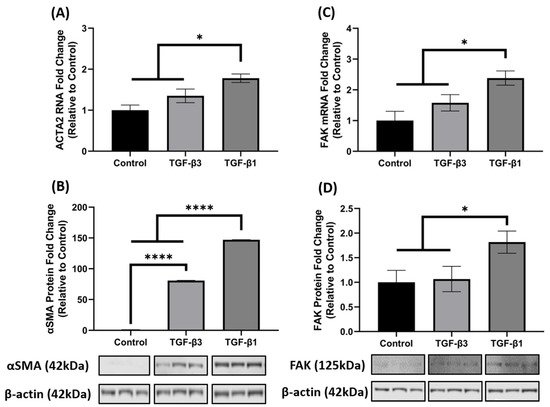
It is well established that TGF-β1 induces the key phenotypic myofibroblast marker, αSMA and exhibits activation of FAK, as FAK signaling is implicated in myofibroblast differentiation. Since ACTA2 was significantly increased in the 3D constructs after TGF-β1 and -β3 treatment in the array analysis (Figure 1B), we further investigated the opposing mechanisms of fibrosis by examining gene and protein expression of ACTA2 (gene)/αSMA (protein) and FAK in hCF 3D constructs after TGF-β1 or -β3 treatment. Similar to the array data, the qRT-PCR results showed that TGF-β1 and -β3 treatment increased ACTA2 gene expression as compared to control (untreated); however, unlike the array data, TGF-β1 significantly upregulated ACTA2 (* p < 0.05), whereas TGF-β3 did not (Figure 2A). At the protein level, however, both TGF-β1 and -β3 increased αSMA expression when compared with control (**** p < 0.0001). Interestingly, even though both TGF-β1 and -β3 treatments were significant, TGF-β1 increased αSMA ~2-fold higher than TGF-β3 (**** p < 0.0001) (Figure 2B). Similarly, TGF-β1 significantly increased both mRNA and protein FAK expression as compared to control (* p < 0.05), but TGF-β3 did not (Figure 2C,D), even though there was a slight increase in ACTA2 in the TGF-β3 treated samples. These data indicate that TGF-β1 significantly enhanced both ACTA2/αSMA and FAK gene and protein expression, whereas TGF-β3 did not augment their expression to a similar degree, thus showing differences in their activation capacity.
Figure 2. TGF-β1 treatment induced ACTA2/αSMA and FAK expression in hCF 3D constructs. Characterization of ACTA2/αSMA and FAK expression in 4-week human corneal fibroblast (hCF) 3D constructs. mRNA and protein were isolated from 4-week hCF constructs that were either untreated (control) or treated continuously with TGF-β1 or TGF-β3. (A,C) Extracted mRNA from constructs per experimental condition was examined by qRT-PCR analysis for ACTA2 and FAK. (B,D) Cell lysates were prepared from constructs and analyzed for relevant target proteins (αSMA and FAK) and β-Actin (loading control). Bands were measured by densitometry analysis, and average fold change of targeted proteins are shown relative to control ± SEM; n = 3 per group. * p < 0.05, **** p < 0.0001. ACTA2, Alpha smooth muscle actin; FAK, Focal Adhesion Kinase.
4. FAK Inhibition Attenuates TGF-β1-Mediated αSMA Expression in 3D Constructs
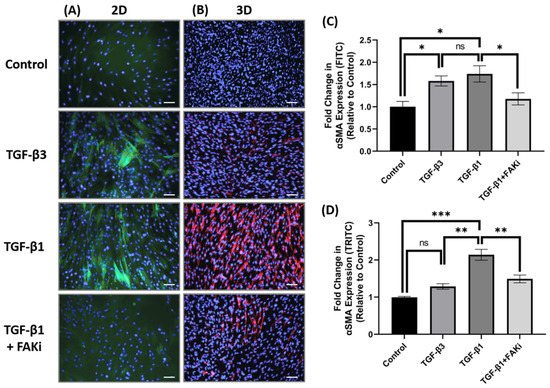
Considering the differences in FAK expression between TGF-β1 and -β3 treatment, we next challenged the TGF-β-mediated myofibroblast differentiation by interfering with FAK signaling. Here, an FAK inhibitor (FAKi; CAS 4506-66-5) was used to evaluate the contribution of TGF-β-mediated myofibroblast differentiation in hCF 2D cell and 3D construct models. Using immunofluorescent staining, we examined αSMA localization in hCF that had been left untreated (control) or stimulated with TGF-β3, TGF-β1, or TGF-β1 + FAKi. In 2D culture, TGF-β1 increased αSMA expression, as did TGF-β3 treatment (Figure 3A). In contrast, FAKi was effective in abrogating the increase in αSMA localization induced by TGF-β1, maintaining a similar amount of localization as seen with untreated control. We compared and quantified the αSMA localization relative to untreated controls to show that both TGF-β1 and -β3 drove myofibroblast differentiation (* p < 0.05), but FAKi treatment was similar to untreated control (Figure 3C). In 3D constructs, TGF-β1 strongly induced αSMA expression, as expected, and αSMA was less pronounced in TGF-β3 conditions. Impressively, the expression of TGF-β1-induced αSMA was blunted by FAKi (Figure 3B). Furthermore, we quantified αSMA localization relative to untreated controls to show significant enhancement in αSMA in TGF-β1 treatment (*** p < 0.001) (Figure 3D). Similarly, the αSMA expression levels of TGF-β3 and TGF-β1 + FAKi treatments were significantly reduced compared to TGF-β1 treatment (** p < 0.01). These data indicates that interfering with FAK can attenuated TGF-β1-mediated myofibroblast differentiation in 3D construct models.
Figure 3. FAK inhibition decreased expression of αSMA in 3D hCF constructs. (A) In 2D cell culture (2D), hCF were growth arrested 48 h prior to stimulation with either no growth factors (control), TGF-β3, TGF-β1, or TGF-β1 + FAK inhibitor (FAKi). After a further 24 h, the 2D cultures were examined for αSMA localization. Green = αSMA, Blue = TO-PRO-3. (B) In 3D constructs, hCF constructs were generated and stimulated with vitamin C to secrete their own extracellular matrix for 2 weeks. 3D hCF constructs were treated with either no growth factors (control), TGF-β3, TGF-β1, or TGF-β1 + FAKi. After a further 24 h, the 3D constructs were examined for αSMA localization. Red = αSMA, Blue = TO-PRO-3. Images of (C) 2D cell culture and (D) 3D constructs were captured, and fluorescent intensity of αSMA was quantified using Image-J software. Average fold change of fluorescent intensity relative to control is shown for all experimental groups ±SEM. All images were taken at 20× magnification. Scale bar: 50μm. Representative western blot images of αSMA and FAK via different treatment groups are shown. n = 3 per group. ns: non-significant, * p < 0.05, ** p < 0.01, *** p < 0.001. ACTA2, Alpha smooth muscle actin; FAK, Focal Adhesion Kinase.
5. FAK Inhibition Attenuates αSMA Expression at the mRNA and Protein Level in 3D Constructs
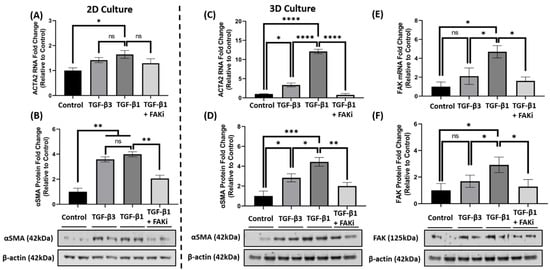
Considering the effect that FAK-inhibition has upon attenuating TGF-β1-mediated αSMA localization, we further explored whether FAKi inhibited αSMA at the molecular level. In 2D culture, qRT-PCR data indicated that TGF-β1 treatment significantly increased ACTA2 gene expression compared to that of control (* p < 0.05) (Figure 4A), while TGF-β3 treatment only showed a modest increase. With the introduction of FAKi, TGF-β1 + FAKi only showed a modest decrease in ACTA2 gene expression as compared to TGF-β1 treatment alone. At the protein level, however, both TGF-β1 and -β3 significantly increased αSMA protein expression compared with control (** p < 0.01) (Figure 4B), which agrees with the immunofluorescent data (Figure 3A). No significant difference in αSMA expression was observed between TGF-β1 and -β3 treatments. Interestingly, TGF-β1 + FAKi significantly reduced αSMA protein expression compared with that of TGF-β1 alone (** p < 0.01) (Figure 4B). In the 3D constructs, TGF-β1 significantly increased ACTA2/αSMA mRNA and protein expression compared with control (**** p < 0.0001 and * p < 0.05, respectively) (Figure 4C,D); however, despite showing significant differences compared to that of the control (* p < 0.05), TGF-β3 treatment only modestly increased ACTA2/αSMA expression. Interestingly, TGF-β1 + FAKi treatment significantly attenuated ACTA2/αSMA mRNA and protein expression when compared with TGF-β1 alone (**** p < 0.0001 and ** p < 0.01, respectively) (Figure 4C,D). When FAK mRNA and protein were analyzed under these same conditions, FAK expression was found to be significantly upregulated with TGF-β1 treatment when compared to that of untreated control (* p < 0.05), but only modestly increased with TGF-β3 (Figure 4E,F). Strikingly, FAK mRNA and protein significantly decreased with TGF-β1 + FAKi treatment compared to that of TGF-β1 alone (* p < 0.05).
Figure 4. FAK inhibition decreased αSMA expression at mRNA and protein level in 2D and 3D culture. (A,B) In 2D culture, hCFs were growth arrested 48 h prior to stimulation with either no growth factors (control), TGF-β3, TGF-β1, or TGF-β1 + FAK inhibitor (FAKi). (C–F) In 3D culture, hCF constructs were generated and stimulated with vitamin C to secrete their own extracellular matrix for 2 weeks. 3D hCF constructs were treated with no growth factors (control), TGF-β3, TGF-β1, or TGF-β1 + FAKi. Isolated mRNA from each experimental condition was examined by qRT-PCR analysis for levels of (A,C) ACTA2 and (E) FAK. Cell lysates were prepared from each experimental condition and average fold change of (B,D) αSMA and (F) FAK with respect to β-Actin and relative to control was measured by densitometry analysis. Representative western blot images of αSMA and FAK via different treatment groups are shown. Data are shown as mean ± SEM; n = 3 per group. ns: non-significant, * p < 0.05, ** p < 0.01, *** p< 0.001, **** p < 0.0001. ACTA2, Alpha smooth muscle actin gene; αSMA, Alpha smooth muscle actin protein; FAK, Focal Adhesion Kinase.
This entry is adapted from the peer-reviewed paper 10.3390/biom11111682