The G-protein coupled receptor 55 (GPR55) was first described in 1999 and is broadly expressed in different areas of the CNS, such as the frontal cortex or the hippocampus. The discovery of the bioactive lipid lysophosphtatidylinositol (LPI) as endogenous GPR55 agonist led to the receptor’s deorphanization . However, besides LPI, several commercially available as well as endogenous ligands show agonistic or antagonistic activity at the GPR55. Endocannabinoids, 2-arachidonoylglycerol, and delta-9-tetrahydrocannabinol (Δ9-THC) for instance, show strong affinities and activation of GPR55, heating up the discussion about GPR55 as potential third cannabinoid-receptor (CB). Commercially available GPR55 agonists, such as O-1602, and GPR55-antagonists like ML-193 are commonly used in GPR55 research, to evaluate GPR55-specific molecular pathways and effects. Besides these widely used GPR55 ligands, coumarin-derivates show antagonistic coupled to inverse agonistic activities on GPR55-dependent neuroinflammatory processes as reported recently.
- oxidative stress
- GPR55
- coumarin-based compounds
- ROS
1. Introduction
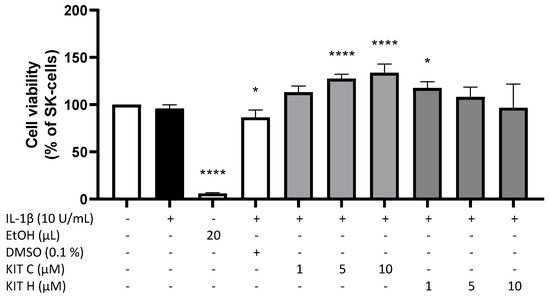
2. Cytotoxic Effects of KIT C and KIT H

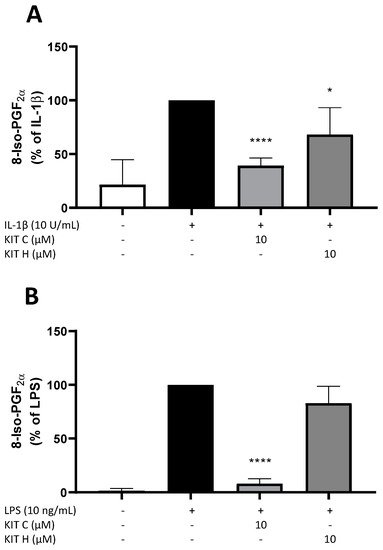
3. Effects of KIT C and KIT H on 8-Iso-PGF2α-Release in SK-N-SH and Primary Microglial Cells

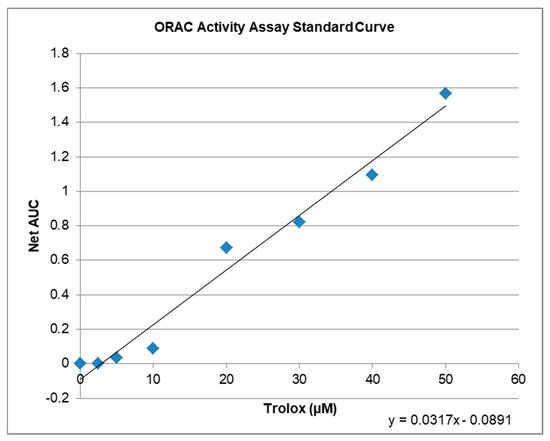
4. Antioxidative Capacity of KIT C and H in the ORAC Assay

| Compound | µM TE 1 | Net AUC 2 | AUC |
|---|---|---|---|
| Blank | 0.0 | 0.0 | 1.3684 |
| 1 µM KIT C | 5.2 | 0.0743 | 1.4427 |
| 10 µM KIT C | 6.5 | 0.1176 | 1.4860 |
| 1 µM KIT H | 3.4 | 0.0201 | 1.3885 |
| 10 µM KIT H | 4.7 | 0.0607 | 1.4291 |
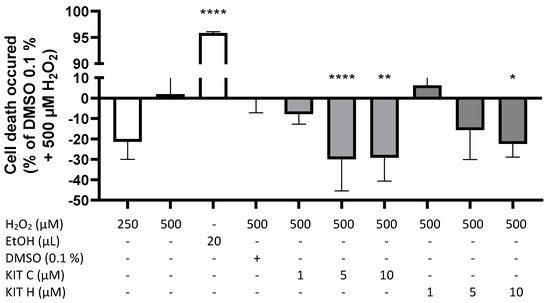
5. GPR55-Dependent Antioxidative Effects

This entry is adapted from the peer-reviewed paper 10.3390/ijms222111665
References
- Dimopoulos, N.; Piperi, C.; Psarra, V.; Lea, R.W.; Kalofoutis, A. Increased plasma levels of 8-iso-PGF2α and IL-6 in an elderly population with depression. Psychiatry Res. 2008, 161, 59–66.
- Singh, A.; Kukreti, R.; Saso, L.; Kukreti, S. Oxidative Stress: A Key Modulator in Neurodegenerative Diseases. Molecules 2019, 24, 1583.
- Angelova, P.R.; Abramov, A.Y. Role of mitochondrial ROS in the brain: From physiology to neurodegeneration. FEBS Lett. 2018, 592, 692–702.
- Cui, L.; Hou, N.-N.; Wu, H.-M.; Zuo, X.; Lian, Y.-Z.; Zhang, C.-N.; Wang, Z.-F.; Zhang, X.; Zhu, J.-H. Prevalence of Alzheimer’s Disease and Parkinson’s Disease in China: An Updated Systematical Analysis. Front. Aging Neurosci. 2020, 12, 603854.
- Savica, R.; Grossardt, B.R.; Bower, J.H.; Ahlskog, J.E.; Rocca, W.A. Time Trends in the Incidence of Parkinson Disease. JAMA Neurol. 2016, 73, 981–989.
- Sawzdargo, M.; Nguyen, T.; Lee, D.K.; Lynch, K.R.; Cheng, R.; Heng, H.H.Q.; George, S.R.; O’Dowd, B.F. Identification and cloning of three novel human G protein-coupled receptor genes GPR52, ΨGPR53 and GPR55: GPR55 is extensively expressed in human brain. Mol. Brain Res. 1999, 64, 193–198.
- Ryberg, E.; Larsson, N.; Sjögren, S.; Hjorth, S.; Hermansson, N.-O.; Leonova, J.; Elebring, T.; Nilsson, K.; Drmota, T.; Greasley, P.J. The orphan receptor GPR55 is a novel cannabinoid receptor: GPR55, a novel cannabinoid receptor. Br. J. Pharmacol. 2007, 152, 1092–1101.
- Oka, S.; Nakajima, K.; Yamashita, A.; Kishimoto, S.; Sugiura, T. Identification of GPR55 as a lysophosphatidylinositol receptor. Biochem. Biophys. Res. Commun. 2007, 362, 928–934.
- Shore, D.M.; Reggio, P.H. The therapeutic potential of orphan GPCRs, GPR35 and GPR55. Front. Pharmacol. 2015, 6, 13–18.
- Saliba, S.W.; Jauch, H.; Gargouri, B.; Keil, A.; Hurrle, T.; Volz, N.; Mohr, F.; van der Stelt, M.; Bräse, S.; Fiebich, B.L. Anti-neuroinflammatory effects of GPR55 antagonists in LPS-activated primary microglial cells. J. Neuroinflamm. 2018, 15, 322.
- Saliba, S.W.; Gläser, F.; Deckers, A.; Keil, A.; Hurrle, T.; Apweiler, M.; Ferver, F.; Volz, N.; Endres, D.; Bräse, S.; et al. Effects of a Novel GPR55 Antagonist on the Arachidonic Acid Cascade in LPS-Activated Primary Microglial Cells. Int. J. Mol. Sci. 2021, 22, 2503.
- Sato, J.; Makita, N.; Iiri, T. Inverse agonism: The classic concept of GPCRs revisited. Endocr. J. 2016, 63, 507–514.
- Wisler, J.W.; Xiao, K.; Thomsen, A.R.; Lefkowitz, R.J. Recent developments in biased agonism. Curr. Opin. Cell Biol. 2014, 27, 18–24.
- Strachan, R.T.; Sun, J.; Rominger, D.H.; Violin, J.D.; Ahn, S.; Thomsen, A.; Zhu, X.; Kleist, A.; Costa, T.; Lefkowitz, R.J. Divergent transducer-specific molecular efficacies generate biased agonism at a G protein-coupled receptor (GPCR). J. Biol. Chem. 2014, 289, 14211–14224.
- DeWire, S.M.; Violin, J.D. Biased ligands for better cardiovascular drugs: Dissecting G-protein-coupled receptor pharmacology. Circ. Res. 2011, 109, 205–216.
- Blättermann, S.; Peters, L.; Ottersbach, P.A.; Bock, A.; Konya, V.; Weaver, C.D.; Gonzalez, A.; Schröder, R.; Tyagi, R.; Luschnig, P.; et al. A biased ligand for OXE-R uncouples Gα and Gβγ signaling within a heterotrimer. Nat. Chem. Biol. 2012, 8, 631–638.
- Falasca, M.; Ferro, R. Role of the lysophosphatidylinositol/GPR55 axis in cancer. Adv. Biol. Regul. 2016, 60, 88–93.
- Wang, L.; Chen, Y.; Sternberg, P.; Cai, J. Essential roles of the PI3 kinase/Akt pathway in regulating Nrf2-dependent antioxidant functions in the RPE. Investig. Opthalmology Vis. Sci. 2008, 49, 1671–1678.
- Akimov, M.G.; Gamisonia, A.M.; Dudina, P.V.; Gretskaya, N.M.; Gaydaryova, A.A.; Kuznetsov, A.S.; Zinchenko, G.N.; Bezuglov, V.V. GPR55 Receptor Activation by the N-Acyl Dopamine Family Lipids Induces Apoptosis in Cancer Cells via the Nitric Oxide Synthase (nNOS) Over-Stimulation. Int. J. Mol. Sci. 2021, 22, 622.
- Wang, Y.; Pan, W.; Wang, Y.; Yin, Y. The GPR55 antagonist CID16020046 protects against ox-LDL-induced inflammation in human aortic endothelial cells (HAECs). Arch. Biochem. Biophys. 2020, 681, 108254.
- Milne, G.L.; Yin, H.; Hardy, K.D.; Davies, S.S.; Roberts, L.J. Isoprostane generation and function. Chem. Rev. 2011, 111, 5973–5996.
- Garrett, A.R.; Murray, B.K.; Robison, R.A.; O’Neill, K.L. Measuring Antioxidant Capacity Using the ORAC and TOSC Assays. In Advanced Protocols in Oxidative Stress II; Methods in Molecular Biology; Armstrong, D., Ed.; Humana Press: Totowa, NJ, USA, 2010; Volume 594, pp. 251–262. ISBN 9781607614104.
- Celorrio, M.; Rojo-Bustamante, E.; Fernández-Suárez, D.; Sáez, E.; de Mendoza, A.E.-H.; Müller, C.E.; Ramírez, M.J.; Oyarzábal, J.; Franco, R.; Aymerich, M.S. GPR55: A therapeutic target for Parkinson’s disease? Neuropharmacology 2017, 125, 319–332.
- García-Gutiérrez, M.S.; Navarrete, F.; Navarro, G.; Reyes-Resina, I.; Franco, R.; Lanciego, J.L.; Giner, S.; Manzanares, J. Alterations in Gene and Protein Expression of Cannabinoid CB2 and GPR55 Receptors in the Dorsolateral Prefrontal Cortex of Suicide Victims. Neurotherapeutics 2018, 15, 796–806.
