Your browser does not fully support modern features. Please upgrade for a smoother experience.
Please note this is an old version of this entry, which may differ significantly from the current revision.
Subjects:
Plant Sciences
Soil salinization caused by the accumulation of sodium can decrease rice yield and quality. Identification of rice salt tolerance genes and their molecular mechanisms could help breeders genetically improve salt tolerance.
- salt tolerance
- quantitative trait locus (QTL)
1. Introduction
Land clearing, excessive irrigation, salt intrusion into coastal zones and sea-level rise has increased soil salinity, and this is now a significant abiotic stress affecting crop production and quality [1]. A total of 6% of the world’s land area and 20% of irrigated agriculture have been affected by soil salinity. Salinity also poses a serious threat to irrigated agriculture [2][3]. The salinity problem in crop production will likely worsen due to the increasing human population [4].
Rice (Oryza sativa L.) is a staple food for much of the global population [4][5]. Rice is a salt-sensitive crop and yield can be greatly reduced (by over 50%) when soil salinity exceeds 6 dS/m [6]. Salt tolerance in rice varies as the growth stage does. Rice is salt-sensitive at the seedling stage, moderately salt-tolerant at the vegetative stage, and highly sensitive at the reproductive stage [7].
Salt tolerance in rice is controlled by multiple physiological and biochemical reactions, including osmotic stress and ionic stress [3]. Therefore, it is difficult to improve the salt tolerance of rice using traditional breeding methods [7]. Marker-assisted selection (MAS) and genetic engineering technology can accelerate the process of selecting for salt-tolerant rice varieties, but it is difficult to obtain salt-tolerant varieties for crop production by the insertion of single genes [8]. Therefore, it is necessary to simultaneously introduce multiple key genes to improve many pathways in the salt-tolerant regulatory network [8]. It is important to understand the molecular mechanisms and to identify the quantitative trait loci (QTL) and key genes of rice salt tolerance [1][9][10].
Genome-wide QTL analysis has been used to identify salt tolerance-related sites, and this has identified many QTLs related to rice salt tolerance. These studies have provided a foundation for the cloning of salt tolerance genes. The location and cloning of salt-tolerant genes, or QTLs, have promoted molecular-assisted selection breeding in rice.
2. QTL Analysis of Salt Tolerance in Rice
2.1. QTL Mapping Population for Salt Tolerance
Mapping QTLs provides insights in the inheritance mechanisms of the quantitative traits in plants and animals [11]. The mapping populations used for QTL analysis could be divided into permanent populations and temporary populations [11]. In the QTL analysis of salt tolerance in rice, the permanent populations included recombinant inbred lines (RILs) and introgression lines (ILs). RIL population–parent combinations included Kolajoha×Ranjit [12], Jiucaiqing× IR26 [13][14], Changbai10×Dongnong425 [15], Tesanai 2×CB, (Nona Bokra×Pokkali)×(IR4630-22-2-5-1-3×IR10167-129-3-4) [16], IR4630×IR15324 [17], Co39×Moroberekan [18], Milyang23×Gihobyeo [19][20], H359×Acc8558 [21], IR29×Pokkali B [22], Yiai1×Lishuinuo [23], CSR11×MI48 [24], CSR27×MI48 [25], and Dongxiang×NJ16 [7]. IL population–parent combinations included IR64×Tarom Molaii [26], Ilpumbyeo×Moroberekan [27], Minghui86×ZDZ057, Minghui86×Teqing Shuhui527×ZDZ057, Shuhui527×Teqing [28], Lemont×Teqing [29], Pokkali×IR29 [30][31], Teqing×Oryza rufipogon [32], Ce258×IR758 62 [33], Tarome-Molaei×Tiqing [34], Xiushui 09×IR2061 [35], IR64×Binam [36], and Nipponbare×Kasalath [37]. In addition, there are doubled haploid (DH) groups that include IR64×Aucena [38] and Zhaiyeqing 8×Jingxi 17 [39][40]. Some studies also used a set of chromosome segment substitution lines (CSSLs) to detect salt tolerance in seedlings [41]. Mapped salt-tolerant QTLs that have permanent populations could analyze phenotypic variation at multiple points over multiple years. In this way, the identified salt-tolerant QTLs are more stable and not affected by the environment, which was of benefit to map-based cloning and molecular breeding applications. However, most of the permanent populations in the studies were not used for salt tolerance analysis. There was a lack of highly salt-tolerant or salt-sensitive parental varieties. The salt tolerance difference between the parents was small, which was not conducive to the identification of major salt-tolerant sites. Only a few populations were constructed that had salt-tolerant varieties as their parents and used for salt tolerance research, such as Kolajoha×Ranjit [12], Jiucaiqing×IR26 [13][14], (Nona Bokra×Pokkali)×(IR4630-22-2-5-1-3×IR10167-129-3-4) [16], IR29×Pokkali [22], CSR11×MI48 [24], and CSR27×MI48 [25].
Most of the salt-tolerant QTL mapping of rice has used temporary populations. Most of these populations were F2 and F3 populations, and a few were F4, BC1F1, BC1F2:3, and BC2F2:3 populations. The parent populations included Gharib×Sepidroud [42][43], Nona Bokra×Koshihikari [44], Tarommahali×Khazar [45][46], Pokkali×Shaheen Basmati [47], BRRI Dhan40×IR61920-3B-22-2-1 [48], Dongnong425×Changbai10 [15][49], Jiucaiqing×IR36 [50], Sadri×FL478 [51], NERICA-L-19×Hasawi, Sahel 108×Hasawi, and BG90-2×Hasawi [52], IR36×Pokkali [53][54], CSR27×MI48 [55], Cheriviruppu×Pusa Basmati1 [56], and Peta×Pokkali [57]. These populations were used for QTL analysis of salt-tolerant materials such as Gharib, Nona Bokra, Tarommahali, Pokkali, Jiucaiqing, FL478, Hasawi, IR61920-3B-22-2-1, Cheriviruppu, Changbai10, and CSR27 [42][43][44][45][46][47][48][49][50][51][52][55][56].
Some studies used two or more populations simultaneously for salt tolerance QTL analysis. Tiwari et al. [24] identified the salt-tolerant QTLs that had two RIL populations CSR11×MI48 and CSR27×MI48; Cheng et al. and Yang et al. [29][35] used the two-way combination of Xiushui09×IR2061 and Lemont×Teqing; Qian et al. [28] selected Shuhui 527×ZDZ057, Minghui 86×ZDZ057, Shuhui 527×teqing, and Minghui 86×teqing for salt tolerance QTL analysis; Sun et al. [49] used F3 and BC1F2:3 populations of Dongnong 425×Changbai 10 to analyze the dynamic QTL that controls the ion content in rice roots; Bimpong et al. [52] used F2 populations of NERICA-L-19×Hasawi, Sahel 108×Hasawi and BG90-2×Hasawi to identify QTLs for salt tolerance in Hasawi. QTL analysis and comparison with multiple mapped populations were conducive to finding salt-tolerant sites that could be stably expressed and less affected by genetic background.
2.2. Period and Method of Salt Tolerance Identification
Rice has different tolerances to salt stress at different growth stages [7]. The seedling stage and the reproductive growth stage are salt-sensitive, while the seed germination stage and the vegetative growth stage are more salt-tolerant [7]. Therefore, most of the studies of salt tolerance QTL analysis in rice have been conducted during the seedling and reproductive growth stages [58].
More than half of the QTL studies on rice salt tolerance have used the seedling stage. The methods used for the identification of salt tolerance at the seedling stage were uniform. Rice seedlings were cultivated by hydroponics, and treated with salt at, or near, the three-leaf stage [13][14][16][17][19][20][21][22][23][26][28][29][30][34][35][36][40][43][44][45][46]. For the reproductive growth stage, most rice studies used plants in artificial salt ponds. A small number of studies used rice planted in soil and treated with salt water [24][25][40][51][52][53][54][55][56]. The initial and final salt treatments were different in different studies. Most of the studies transplanted rice to salt ponds in the seedling or tillering stage, where they were grown to maturity. The plants were then scored for agronomic traits and physiological indicators of salt tolerance [24][25][40][51][52][53][54][57]. A few studies analyzed salt tolerance QTL in the seed germination stage, and conducted the germination in a medium with salt as a treatment [13][38][42].
Some studies simultaneously analyzed salt tolerance QTL in two or more growth and development stages. Gu et al. and Pandit et al. [25][57] identified the salt tolerance QTL in the vegetative and reproductive growth stages of rice; Zang et al. [36] identified tolerance in the seedling stage and vegetative growth stage; Ammar et al. [55] analyzed salt tolerance QTLs in seedling, vegetative growth, and reproductive growth stages. These studies helped to identify the genes that control salt tolerance in multiple growth and development stages of rice.
To analyze the influence of plant developmental differences on salt tolerance, some studies used a control group. They analyzed the salt tolerance of the mapping population under the salt and the control treatments at the same time [13][14][24][27][28][36][37][38][40][49][52][53][54][57]. Most of the studies used permanent populations that are homozygous for each strain. A few studies used different tillers from F2 populations for different treatments.
2.3. Salt Tolerance Evaluation Parameter
The salt tolerance of rice is a complex and comprehensive trait that has various evaluations that differ between development stages. In QTL analysis of rice salt tolerance, the evaluation parameters at the seedling stage can be divided into three categories: morphological, growth and physiological. Morphological parameter analysis evaluates the salt tolerance of the seedlings (score of salt tolerance, SST) by observing the blade tips, leaves, tillers, and the growth inhibition and death of plants after salt stress, and also investigating the survival days of seedling (SDS) after salt stress [14][15][18][19][20][22][23][26][27][28][29][30][33][35][36][43][44][46][47][48][55][59]. Most studies have used the standard evaluation system (SES) proposed by the International Rice Research Institute (IRRI) to evaluate the salt damage level [60]. Some studies modified the evaluation criteria based on experimental materials and experimental design [19][22][26][28][29][30][33][35][36][43][46][47][55][59]. The growth indicators used to evaluate the salt tolerance during the seedling stage include plant height and the fresh and dry weight of shoots and roots [14][17][22][27][43][45][46][47]. There are many physiological parameters for evaluating the salt tolerance of rice, and the indicators for QTL analysis include plant ion content, the concentration of shoot Na+ (SNC) and K+ (SKC), shoot Na+/K+ ratio (SNKR), the concentrations of root Na+ (RNC) and K+ content (RKC), and root Na+/K+ ratio (RNKR) [14][15][16][17][21][22][26][29][33][34][35][43][44][45][46][47][59]. Some studies also analyzed QTL with the chlorophyll content of seedlings after salt stress [22][43][45].
The evaluation parameters for the salt tolerance of rice seeds during germination include germination rate and germination vigor. Some studies further analyzed growth of the embryo and the radicle of seedlings after germination [13][38][42]. The evaluation parameters during the vegetative growth stage included plant growth and physiological indicators. Most studies analyzed the growth and ion content of the shoot rather than the root [18][25][36][49][50][55][57]. The evaluation during reproductive growth included yield-related agronomic traits, such as the heading date, plant height, tiller number panicles per plant, grains per panicle, seed setting rate, 1000-seed weight, and yield per plant [24][25][40][51][52][55][56][57]. Some studies analyzed the content of Na+, K+, Ca2+, and Cl− in rice leaves or straw after salt treatment in the reproductive growth stage [25][51][53][55]. Some studies included control groups, and they used the absolute value of each evaluation parameter for QTL analysis between the control and comparison groups. They also used the relative value of each salt tolerance trait (treatment/control) or decrease rate ((control–treatment)/control) as an indicator, which was beneficial in reducing the influence of individual plant differences [24][27][49][53][54][57].
2.4. Salt Tolerance QTL
Authors found 52 salt tolerance QTL studies in rice, as shown in Table 1. More than half of the salt-tolerant QTLs were in the seedling stage. Salt-tolerant QTLs at each growth stage were distributed on the 12 rice chromosomes.
Table 1. Identified QTL for salt tolerance in rice.
| Stage | Parents for Cross | Population Type | Evaluation Parameter for Salt Tolerance | PVE% | QTL | High-PVE QTL | Reference |
|---|---|---|---|---|---|---|---|
| Germination stage | IR64×Azucena | DH | GR, seedling root length, seedling dry mass, seedling vigor | 13.5–19.5 | 7 | 0 | [38] |
| Jiucaiqing×IR26 | RIL | GR, RL, SH | 6.5–43.7 | 7 | 4 | [13] | |
| Gharib×Sepidroud | F2/F2:4 | GR, germination percentage, radicle length, plumule length, coleoptile length, radicle fresh weight, plumule fresh weigh, radicle dry weight, plumule dry weight, coleoptile fresh weight, coleoptile dry weight | 10.0–21.9 | 17 | 2 | [42] | |
| 9311×japonica | CSSL | Survival rate | 5.1–93.2 | 4 | - | [41] | |
| Seedling stage | Dongnong425×Changbai10 | BC2F2/BC2F2:3 | SST, SNC, SKC, RNC, RKC | 6.45–17.95 | 13 | 0 | [63] |
| O. rufipogon×O. Sative | ILs | SDS, STT | 2–8 | 10 | - | [64] | |
| (Nona Bokra×Pokkali)×(IR4630-22-2-5-1-3×IR10167-129-3-4) | RIL | SNC, SKC, SNKR | - | 4 | - | [16] | |
| IR4630×IR15324 | RIL | SNC, SKC, SNKR, total Na+ and K+, SDW | 6.4–19.6 | 11 | 0 | [17] | |
| Milyang 23×Gihobyeo | RIL | SST | 9.2–27.8 | 2 | 1 | [19] | |
| Milyang 23×Gihobyeo | RIL | SST | 9.1–27.8 | 2 | 1 | [20] | |
| H359×Acc 8558 | RIL | SNC | 1.68–45.39 | 13 | 3 | [21] | |
| IR29×Pokkali | RIL | SNC, SKC, RKC, RNKC, SH, chlorophyll content, seedling survival rate, initial and final SST | 6–67 | 27 | 16 | [22] | |
| Yiai1×Lishuinuo | RIL | Dead rate of leaf and seedling | 8.65–27.20 | 6 | 1 | [23] | |
| IR64×Tarom Molaii | IL | SST, SDS, SKC, SNC, RKC, RNC | - | 23 | - | [26] | |
| Ilpumbyeo×Moroberekan | IL | The reduction rate of fresh and dry weight, leaf area and SH | 10.2–13.9 | 8 | 0 | [27] | |
| Shuhui527×ZDZ057, Minghui86×Teqing, Minghui86×ZDZ057, Shuhui527×Teqing | IL | SST, SDS | 8.17–42.18 | 43 | 12 | [28] | |
| Lemont×Teqing | IL | SST, SDS, SKC, SNC | - | 36 | - | [29] | |
| Pokkali×IR29 | IL | SST | 4.00-18.42 | 6 | 0 | [30] | |
| Ce258×IR75862, ZGX1×IR75862 | IL | SST, SDS, SKC, SNC | 5.13–13.75/3.73–8.26 * | 18/2 * | 0 | [33] | |
| Tarome-Molaei×Tiqing | IL | SNC, SKC, SNKR, RNC, RKC, RNKR | 9.0–30.0 | 14 | 5 | [34] | |
| Xiushui 09×IR2061-520-6-9 | IL | SST, SDS, SKC, SNC, SKNR | 5.14–18.89/2.60–14.30 * | 26/21 * | 0 | [35] | |
| Zaiyeqing8×Jingxi17 | DH | SDS | 10.2–38.4 | 10 | 2 | [39] | |
| Nona Bokra×Koshihikari | F2/F3 | SDS, SNC, SKC, RNC, RKC, Na+ and K+ in root, SDW | 12.4–48.5 | 11 | 3 | [44] | |
| Tarommahalli×Khazar | F2/F3 | Survival rate, chlorophyll content, SH, RL, leaf area, the weight of stem and root, total Na+ and K+ in shoot, SNKR | 9.03–38.22 | 32 | 14 | [45] | |
| Tarommahali×Khazar | F2/F3 | STR, DM, Na+ content, K+ content, Na+/K+ | 9.03–20.90 | 14 | 1 | [46] | |
| Pokkali×Shaheen Basmati | F2/F3 | SST, SH, SDW, SFW, SNC, SKC, SNKR, RNC, RKC, RNKR | 4.89–10.55 | 22 | 0 | [47] | |
| BRRI Dhan40×IR61920-3B-22-2-l | F2 | SST | 12.5–29.0 | 3 | 2 | [48] | |
| Jiucaiqing×IR26 | RIL | RNKR, SH, SDW, RDW | 7.8–23.9/- * | 15/5 * | 2 | [14] | |
| Jiucaiqing×IR26 | RIL | RKC, SNC, SKC, SST | 8.5–18.9/- * | 13/9 * | 0 | [59] | |
| Tesanai 2×CB | RIL | SDS | 1.5–11.6 | 4 | 0 | [61] | |
| Tesanai 2×CB | RIL | SDS, SDW, RDW, SNC, SKC, SKNR | 4.4–15.0 | 31 | 0 | [62] | |
| Teqing×Oryza rufipogon | IL | SST, relative SDW, RDW and total plant dry weight | 8–26 | 15 | 3 | [32] | |
| Vegetative growth stage | Co39×Moroberekan | RIL | Content of Na+ in shoot, SNKR, fresh weight of stem, moisture content of leaf | 11.0–26.3 | 14 | 3 | [18] |
| Nipponbare×Kasalath | IL | SH, SDW, number of tillers | 12–41 | 31 | 11 | [37] | |
| Dongnong425×Changbai10 | BC1F2/BC1F2:3, F2/F3 | RNC, RKC, RNKR, relative RNC, relative RKC, relative RNKR | 3.61–27.9 | 50 | 4 | [49] | |
| CSR10×Taraori Basmati | F3 | Relative growth rate, SNKR, visual salt-injury symptoms | 25.6–31.3 | 14 | - | [65] | |
| Jiucaiqing×IR26 | F2 | SST, SNKR, SDW | 6.7–19.3 | 7 | 0 | [50] | |
| Reproductive growth stage | CSRll×MI48, CSR27×MI48 | RIL | Sensitivity index of grain yield stress | - | 55 | - | [24] |
| Zhaiyeqing 8×Jingxi 17 | DH | Effective tiller number, thousand-grain weight, PH, heading date, number of grains per panicle | 7.9–40.1 | 24 | 3 | [40] | |
| Sadri×FL478 | F2 | Heading date, PH, length and number of panicles, dry weight of straw, number of fertile and sterile spikelets per plant, total number of spikelets per plant, yield per plant, spikelet fertility, thousand grain weight | 4.2–30.0 | 37 | 1 | [51] | |
| NERICA-L-19×Hasawi, Sahel108×Hasawi, BG90-2×Hasawi | F2 | SST, PH, TN, heading date, panicle number per plant, panicle sterility rate, grain number per ear, thousand-grain weight, yield per plant | 6.5–49.5 | 75 | 37 | [52] | |
| IR36×Pokkali | F2 | Content of Na+ and Ca2+, absorption rate of Ca2+, relative content of Na+, K+ and Ca2+, relative ion content, relative absorption rate of Na+, K+, Ca2+ and Na+/K+ | 7.69–26.33 | 14 | 3 | [53] | |
| IR36×Pokkali | F2 | PH, TN, number of effective tillers, panicle weight, panicle length, number of spikelets panicle, number of unfilled grains panicle, number of grains panicle, panicle fertility, days of 50% flowering, days to maturity, grain length, grain width, grain length–width ratio, grain yield, thousand-grain weight, straw yield, harvest index | 11.52–81.56 | 6 | 1 | [54] | |
| Cheriviruppu×Pusa Basmati 1 | F2 | PH, TN, panicle length, yield, biomass, pollen fertility, Na+ content in flag leaf, Na+/K+ | 3.8–48.7 | 24 | 5 | [56] | |
| HHZ×Budda, HHZ×Gang46B | BC2F5 | Grain weight, spikelet number, thousand-grain weight, seed fertility | 4.7–90.6 | 22 | 1 | [66] | |
| Sahel108×Hasawi, NERICA-L-19×Hasawi, BG90-2×Hasawi | F2 | Days to flowering/heading, PH, TN, panicle sterility, grain yield, yield per plant, yield-component data for each plot, salt tolerance score | 7.3–31.9 | 75 | - | [52] | |
| Tarommahalli×Khazar | F2/F3 | PH, TN, number of full grains, number of empty grains, length and number of panicle, biomass | 8.76–26.83 | 12 | 3 | [56] | |
| Multiple growth stages | CSR27×MI48 | RIL | Vegetative growth period: content of Na+ in stem, content of K+ and Cl− content in leaf | 5.86–8.55 | 4 | 0 | [25] |
| Reproductive growth period: content of Na+, K+ in straw, Na+/K+ in straw, spikelet fertility stress sensitivity index | 7.22–14.05 | 5 | 0 | ||||
| IR64×Binam | IL | Seedling stage: SST, SDS, SKC, SNC | - | 13 | - | [36] | |
| Vegetative growth period: PH, panicle number, fresh weight | - | 22 | - | ||||
| CSR27×MI48 | F2/F3 | Seedling stage: SST | 14.38 | 1 | 0 | [55] | |
| F2 | Vegetative growth period: Na+, Cl− content in leaf and stem, K+ content in stem, Na+/K+ in leaf and stem | 11.13–55.72 | 17 | 15 | |||
| F2 | Reproductive growth period: content of Na+, K+ and Cl− in leaf, Na+/K+ in leaf | 26.26–52.63 | 7 | 7 | |||
| Peta×Pokkali | BC1F1 | Vegetative growth stage: SST, SFW, SDW, Na+ content | - | 4 | - | [57] | |
| Reproductive growth stage: weight of stem and leaf, PH, TL, effective panicle, number, panicle weight, main panicle length, grain weight, seed setting rate | - | 11 | - |
The phenotypic contribution rate of a single QTL ranged from 0.02% to 81.56%. A total of 167 QTLs had a contribution greater than 20% and these occupied 22.0% of the total QTLs (Table 1). Salt-tolerant QTLs that have a large contribution to the phenotype were found in the studies that follow. Thomson et al. [22] detected 16 salt-tolerant QTLs which explained more than 20% of the phenotypic variation in the seedling stage. Of these, five QTLs had a contribution exceeding 50%. Qian et al. [28] used four mapping populations and detected 43 QTLs that control SST or SDS in seedlings. The contributions of 12 QTLs were more than 20%. Sabouri et al. [45] identified 32 QTLs that control different growth and physiological indicators of salt tolerance in rice seedlings. Among them, 14 QTLs explained more than 20% of the phenotypic variation. Bimpong et al. [52] detected 75 salt tolerance QTLs in three mapping populations during the reproductive stage, of which about half of the QTLs (37) explained more than 20% of the phenotypic variation. Ammar et al. [55] detected 25 QTLs that had a contribution greater than 10% in the seedling, vegetative growth, or reproductive growth stage, and 22 QTLs among these had a contribution rate over 20%. In these studies, there were 101 salt-tolerant QTLs that had a phenotypic contribution rate exceeding 20%. There were only a few QTLs that had large effects in other studies, and 13 studies had no salt-tolerant QTLs that exceeded a 20% variation. [5][15][17][25][27][30][33][38][47][50][59][61][62].
We constructed a framework genetic map using 70 QTLs with high PVE in the reports [13][14][19][20][21][34][39][40][42][44][45][48][51] (Figure 1). Figure 1 showed that QTLs related to salt tolerance are distributed on 12 chromosomes, but less on chromosomes 11 and 12.
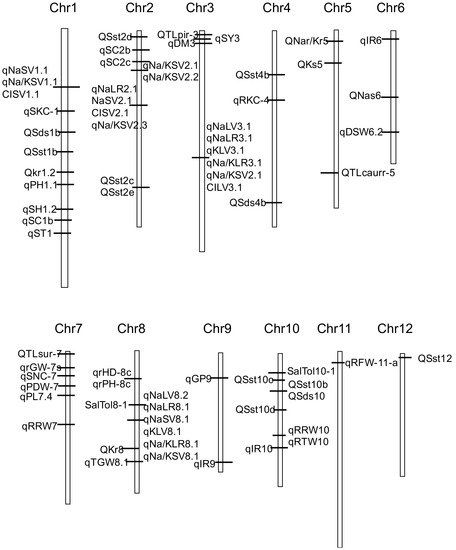
Figure 1. Genetic linkage map showing the location of QTLs for salt tolerance-related traits detected in reports.
2.5. Fine Mapping and Map-Based Cloning of QTLs for Salt Tolerance in Rice
Because many salt-tolerant rice QTLs have a low phenotypic contribution rate and are difficult to fine-map and clone, relevant research has progressed slowly. However, two QTLs located on the first chromosome, qSKC-1 and Saltol, are suitable for fine-mapping or map-based cloning.
qSKC-1 is a major QTL that controls the K+ content in the shoot. It was detected in the F2 population that was constructed by the salt-tolerant variety Nona Bokra and the salt-sensitive variety Koshihikari, and it explained 40.1% of the total phenotypic variation [44]. Ren et al. [63] used the map-based cloning method, followed by fine-mapping of the BC2F2 population and high-precision linkage analysis of the BC3F2 population, and they restricted qSKC-1 within the 7.4 kb chromosome interval and isolated the qSKC-1 gene. This gene encoded an ion transporter (OsHKT1;5) of the HKT (high-affinity K+ transporter) family, which exists in the parenchyma cells of the xylem of rice roots and has the function of specifically transporting Na+. This transporter could transport Na+ out of the xylem, and transport Na+ from the phloem back to the root where it was excreted from the plant through the action of other Na+ transporters. This process reduced the Na+ content in the shoot, regulated the Na+/K+ balance in the shoots, and improved rice salt tolerance [64].
Gregorio [65] used AFLP markers to analyze the salt tolerance QTL of the F8 recombinant inbred line population of the Pokkali/IR29 combination, and detected a major QTL on rice chromosome 1 that simultaneously controls the Na+, K+ content and Na+/K+ ratio in rice. This QTL was named Saltol. In the population, the LOD value of the Saltol site was greater than 14.5, and the phenotypic contribution rate was 64.3–80.2%. Subsequently, Bonilla et al. [66] used the same population to map Saltol to the chromosome between SSR markers RM23 and RM140, and they found that the contribution rates of Saltol sites to the Na+, K+ content and Na+/K+ ratio were 39.2%, 43.9%, and 43.2%, respectively. Niones and Thomson et al. [22][67] used the near-isogenic lines BC3F4 and BC3F5 with IR29 as the background and Pokkali as the donor to confirm the position of the Saltol locus. Since the positions of Saltol and qSKC-1 were nearby on the chromosome, and both were responsible for regulating the Na+/K+ balance of rice under salt stress, Thomson et al. [22] speculated that Saltol and qSKC-1 may encode the same gene (OsHKT1;5).
Some studies conducted fine mapping and cloning on salt-tolerant and salt-sensitive mutants. Lan et al. [68] fine-mapped the seedling salt-tolerant mutant gene SST to the 17 kb interval on chromosome 6, and the only predicted gene in this interval is OsSPL10, which might be a candidate gene for SST. Ogawa et al. [69] and Toda et al. [70] used the salt-sensitive mutants rss1 and rss3 to clone the salt-tolerant-related genes RSS1 and RSS3, respectively. RSS1 participated in the regulation of the cell cycle and was an important factor for maintaining the viability and vigor of meristematic cells under salt stress; RSS3 regulated the expression of the jasmonic acid-responsive gene, and was involved in maintaining root cell elongation at an appropriate rate under salt stress. Deng et al. [71][72] analyzed the salt-tolerant and salt-sensitive mutants rst1, rss2 and rss4. They detected two QTLs (qSNC-1 and qSNC-6) that control the Na+ content of aerial parts on chromosomes 1 and 6, which explained 14.5% and 53.3% of the phenotypic variation, respectively. The synergistic alleles were derived from rss2.
This entry is adapted from the peer-reviewed paper 10.3390/ijms222111674
References
- Ismail, A.M.; Horie, T. Genomics, Physiology, and Molecular Breeding Approaches for Improving Salt Tolerance. Annu. Rev. Plant Biol. 2017, 68, 405–434.
- Chinnusamy, V.; Jagendorf, A.; Zhu, J.K. Understanding and Improving Salt Tolerance in Plants. Crop Sci. 2005, 45, 437–448.
- Munns, R.; Tester, M. Mechanisms of salinity tolerance. Annu. Rev. Plant Biol. 2008, 59, 651–681.
- Zeng, L.; Shannon, M.C.; Grieve, C.M. Evaluation of salt tolerance in rice genotypes by multiple agronomic parameters. Euphytica 2002, 127, 235–245.
- Ponce, K.S.; Meng, L.; Guo, L.; Leng, Y.; Ye, G. Advances in Sensing, Response and Regulation Mechanism of Salt Tolerance in Rice. Int. J. Mol. Sci. 2021, 22, 2254.
- Al-Tamimi, N.; Oakey, H.; Tester, M.; Negrão, S. Assessing Rice Salinity Tolerance: From Phenomics to Association Mapping. In Rice Genome Engineering and Gene Editing: Methods and Protocols; Bandyopadhyay, A., Thilmony, R., Eds.; Springer: New York, NY, USA, 2021; pp. 339–375.
- Quan, R.; Wang, J.; Hui, J.; Bai, H.; Lyu, X.; Zhu, Y.; Zhang, H.; Zhang, Z.; Li, S.; Huang, R. Improvement of Salt Tolerance Using Wild Rice Genes. Front. Plant Sci. 2017, 8, 2269.
- Deinlein, U.; Stephan, A.B.; Horie, T.; Luo, W.; Xu, G.; Schroeder, J.I. Plant salt-tolerance mechanisms. Trends Plant Sci. 2014, 19, 371–379.
- Morton, M.J.L.; Awlia, M.; Al-Tamimi, N.; Saade, S.; Pailles, Y.; Negrão, S.; Tester, M. Salt stress under the scalpel-dissecting the genetics of salt tolerance. Plant J. 2019, 97, 148–163.
- Zelm, E.v.; Zhang, Y.; Testerink, C. Salt Tolerance Mechanisms of Plants. Annu. Rev. Plant Biol. 2020, 71, 403–433.
- Shan, T.; Pang, S.; Wang, X.; Li, J.; Li, Q.; Su, L.; Li, X. A method to establish an “immortalized F-2” sporophyte population in the economic brown alga Undaria pinnatifida (Laminariales: Alariaceae). J. Phycol. 2020, 56, 1748–1753.
- Mazumder, A.; Rohilla, M.; Bisht, D.S.; Krishnamurthy, S.L.; Barman, M.; Sarma, R.N.; Sharma, T.R.; Mondal, T.K. Identification and mapping of quantitative trait loci (QTL) and epistatic QTL for salinity tolerance at seedling stage in traditional aromatic short grain rice landrace Kolajoha (Oryza sativa L.) of Assam, India. Euphytica 2020, 216, 1211–1226.
- Wang, Z.; Wang, J.; Bao, Y.; Wu, Y.; Zhang, H. Quantitative trait loci controlling rice seed germination under salt stress. Euphytica 2010, 178, 297–307.
- Wang, Z.; Cheng, J.; Chen, Z.; Huang, J.; Bao, Y.; Wang, J.; Zhang, H. Identification of QTLs with main, epistatic and QTL x environment interaction effects for salt tolerance in rice seedlings under different salinity conditions. Theor. Appl. Genet. 2012, 125, 807–815.
- Zheng, H.; Zhao, H.; Liu, H.; Wang, J.; Zou, D. QTL analysis of Na+ and K+ concentrations in shoots and roots under NaCl stress based on linkage and association analysis in japonica rice. Euphytica 2014, 201, 109–121.
- Flowers, T.J.; Koyama, M.L.; Flowers, S.A.; Sudhakar, C.; Singh, K.P.; Yeo, A.R. QTL: Their place in engineering tolerance of rice to salinity. J. Exp. Bot. 2000, 51, 99–106.
- Koyama, M.L.; Levesley, A.; Koebner, R.; Flowers, T.; Yeo, A.R. Quantitative Trait Loci for Component Physiological Traits Determining Salt Tolerance in Rice. Plant Physiol. 2001, 125, 406–422.
- Haq, U.T.; Gorham, J.; Akhtar, J.; Akhtar, N.; Steele, K.A. Dynamic quantitative trait loci for salt stress components on chromosome 1 of rice. Funct. Plant Biol. 2010, 37, 634–645.
- Lee, S.; Ahn, J.; Cha, Y.; Yun, D.; Lee, M.; Ko, J.; Lee, K.; Eun, M. Mapping of quantitative trait loci for salt tolerance at the seedling stage in rice. Mol. Cells 2006, 21, 192–196.
- Lee, S.Y.; Ahn, J.H.; Cha, Y.S.; Yun, D.W.; Lee, M.C.; Ko, J.C.; Lee, K.S.; Eun, M.Y. Mapping QTLs related to salinity tolerance of rice at the young seedling stage. Plant Breed. 2007, 126, 43–46.
- Wang, B.; Lan, T.; Wu, W. Mapping of QTLs for Na+ content in rice seedlings under salt stress. Chin. J. Rice Sci. 2007, 21, 585–590.
- Thomson, M.J.; de Ocampo, M.; Egdane, J.; Rahman, M.A.; Sajise, A.G.; Adorada, D.L.; Tumimbang-Raiz, E.; Blumwald, E.; Seraj, Z.I.; Singh, R.K.; et al. Characterizing the Saltol Quantitative Trait Locus for Salinity Tolerance in Rice. Rice 2010, 3, 148–160.
- Liang, J.; Qu, Y.; Yang, C.; Ma, X.; Cao, G.; Zhao, Z.; Zhang, S.; Zhang, T.; Han, L. Identification of QTLs associated with salt or alkaline tolerance at the seedling stage in rice under salt or alkaline stress. Euphytica 2014, 201, 441–452.
- Tiwari, S.; Sl, K.; Kumar, V.; Singh, B.; Rao, A.R.; Mithra SV, A.; Rai, V.; Singh, A.K.; Singh, N.K. Mapping QTLs for Salt Tolerance in Rice (Oryza sativa L.) by Bulked Segregant Analysis of Recombinant Inbred Lines Using 50K SNP Chip. PLoS ONE 2016, 11, e0153610.
- Pandit, A.; Rai, V.; Bal, S.; Sinha, S.; Kumar, V.; Chauhan, M.; Gautam, R.K.; Singh, R.; Sharma, P.C.; Singh, A.K.; et al. Combining QTL mapping and transcriptome profiling of bulked RILs for identification of functional polymorphism for salt tolerance genes in rice (Oryza sativa L.). Mol. Genet. Genom. 2010, 284, 121–136.
- Sun, Y.; Zang, J.; Wang, Y.; Zhu, L.; Mohammadhosein, F.; Xu, J.; Li, Z. Mining Favorable Salt-tolerant QTL from Rice Germplasm Using a Backcrossing Introgression Line Population. Acta Agron. Sin. 2007, 33, 1611–1617.
- Kim, D.M.; Ju, H.G.; Kwon, T.R.; Oh, C.S.; Ahn, S.N. Mapping QTLs for salt tolerance in an introgression line population between Japonica cultivars in rice. J. Crop Sci. Biotech. 2009, 12, 121–128.
- Qian, Y.; Wang, H.; Chen, M.; Zhang, L.; Chen, B.; Cui, J.; Liu, H.; Zhu, L.; Shi, Y.; Gao, Y.; et al. Detection of Salt-tolerant QTL Using BC2F3 Yield Selected Introgression Lines of Rice (Oryza sativa L.). Mol. Plant Breed. 2009, 7, 224–232.
- Yang, J.; Sun, Y.; Cheng, L.R.; Zhou, Z.; Wang, Y.; Zhu, L.H.; Cang, J.; Xu, J.L.; Li, Z.K. Genetic Background Effect on QTL Mapping for Salt Tolerance Revealed by a Set of Reciprocal Introgression Line Populations in Rice. Acta Agron. Sin. 2009, 35, 974–982.
- Alam, R.; Rahman, M.S.; Seraj, Z.I.; Thomson, M.J.; Ismail, A.M.; Tumimbang-Raiz, E.; Gregorio, G.B. Investigation of seedling-stage salinity tolerance QTLs using backcross lines derived from Oryza sativa L. Pokkali. Plant Breed. 2011, 130, 430–437.
- Li, Y.F.; Zheng, Y.; Vemireddy, L.R.; Panda, S.K.; Jose, S.; Ranjan, A.; Panda, P.; Govindan, G.; Cui, J.; Wei, K.; et al. Comparative transcriptome and translatome analysis in contrasting rice genotypes reveals differential mRNA translation in salt-tolerant Pokkali under salt stress. BMC Genom. 2018, 19, 935.
- Tian, L.; Tan, L.; Liu, F.; Cai, H.; Sun, C. Identification of quantitative trait loci associated with salt tolerance at seedling stage from Oryza rufipogon. J. Genet. Genom. 2011, 38, 593–601.
- Qiu, X.; Yuan, Z.; Liu, H.; Xiang, X.; Yang, L.; He, W.; Du, B.; Ye, G.; Xu, J.; Xing, D.; et al. Identification of salt tolerance-improving quantitative trait loci alleles from a salt-susceptible rice breeding line by introgression breeding. Plant Breed. 2015, 134, 653–660.
- Ahmadi, J.; Fotokian, M.H. Identification and mapping of quantitative trait loci associated with salinity tolerance in rice (Oryza Sativa) using SSR markers. Iran. J. Biotechnol. 2011, 9, 21–30.
- Cheng, L.; Wang, Y.; Meng, L.; Hu, X.; Cui, Y.; Sun, Y.; Zhu, L.; Ali, J.; Xu, J.; Li, Z. Identification of salt-tolerant QTLs with strong genetic background effect using two sets of reciprocal introgression lines in rice. Genome 2012, 55, 45–55.
- Zang, J.; Sun, Y.; Wang, Y.; Yang, J.; Li, F.; Zhou, Y.; Zhu, L.; Jessica, R.; Mohammadhosein, F.; Xu, J.; et al. Dissection of genetic overlap of salt tolerance QTLs at the seedling and tillering stages using backcross introgression lines in rice. Sci. China C Life Sci. 2008, 51, 583–591.
- Takehisa, H.; Shimodate, T.; Fukuta, Y.; Ueda, T.; Yano, M.; Yamaya, T.; Kameya, T.; Sato, T. Identification of quantitative trait loci for plant growth of rice in paddy field flooded with salt water. Field Crop. Res. 2004, 89, 85–95.
- Prasad, S.; Bagali, P.; Hittalmani, S.; Shashidhar, H. Molecular mapping of quantitative trait loci associated with seedling tolerance to salt stress in rice (Oryza sativa L). Curr. Sci. 2000, 78, 162–164.
- Gong, J.; He, P.; Qian, Q.; Shen, L.; Zhu, L.; Chen, S. Identification of salt-tolerance QTL in rice (Oryza sativa L.). Chin. Sci. Bull. 1999, 41, 68–71.
- Gong, J.; Zheng, X.; Du, B.; Qian, Q.; Chen, S.; Zhu, L.; He, P. Comparative study of QTLs for agronomic traits of rice (Oryza sativa L.) between salt stress and nonstress environment. Sci. China C Life Sci. 2001, 44, 73–82.
- Zhao, C.; Zhang, S.; Zhao, Q.; Zhou, L.; Zhao, L.; Yao, S.; Zhang, Y.; Wang, C. Mapping of QTLs for bud-stage salinity tolerance based on chromosome segment substitution line in rice. Acta Agric. Boreali-Sin. 2017, 32, 106–111.
- Mardani, Z.; Rabiei, B.; Sabouri, H.; Sabouri, A.; Virk, P. Identification of molecular markers linked to salt-tolerant genes at germination stage of rice. Plant Breed. 2014, 133, 196–202.
- Ghomi, K.; Rabiei, B.; Sabouri, H.; Sabouri, A. Mapping QTLs for traits related to salinity tolerance at seedling stage of rice (Oryza sativa L.): An agrigenomics study of an Iranian rice population. OMICS 2013, 17, 242–251.
- Lin, H.X.; Zhu, M.Z.; Yano, M.; Gao, J.P.; Liang, Z.W.; Su, W.A.; Hu, X.H.; Ren, Z.H.; Chao, D.Y. QTLs for Na+ and K+ uptake of the shoots and roots controlling rice salt tolerance. Theor. Appl. Genet. 2004, 108, 253–260.
- Sabouri, H.; Sabouri, A. New evidence of QTLs attributed to salinity tolerance in rice. Afr. J. Biotechnol. 2008, 7, 4376–4383.
- Sabouri, H.; Rezai, A.; Moumeni, A.; Kavousi, A.; Katouzi, M.; Sabouri, A. QTLs mapping of physiological traits related to salt tolerance in young rice seedlings. Biol. Plant. 2009, 53, 657–662.
- Javed, M.A.; Huyop, F.Z.; Wagiran, A.; Salleh, F.M. Identification of QTLs for Morph-Physiological Traits Related to Salinity Tolerance at Seedling Stage in Indica Rice. Procedia Environ. Sci. 2011, 8, 389–395.
- Islam, M.; Salam, M.; Hassan, L.; Collard, B.Y.; Singh, R.; Gregorio, G. QTL mapping for salinity tolerance at seedling stage in rice. Emir. J. Food Agric. 2011, 23, 137.
- Sun, J.; Zou, D.T.; Luan, F.S.; Zhao, H.W.; Wang, J.G.; Liu, H.L.; Xie, D.W.; Su, D.Q.; Ma, J.; Liu, Z.L. Dynamic QTL analysis of the Na+ content, K+ content, and Na+ /K+ ratio in rice roots during the field growth under salt stress. Biol. Plant. 2014, 58, 689–696.
- Yao, M.; Wang, J.; Chen, H.; Zhai, H.; Zhang, H. Inheritance and QTL mapping of salt tolerance in rice. Rice Sci. 2005, 12, 25–32.
- Mohammadi, R.; Mendioro, M.; Diaz, G.; Gregorio, G.; Singh, R. Mapping quantitative trait loci associated with yield and yield components under reproductive stage salinity stress in rice (Oryza sativa L.). J. Genet. 2013, 93, 433–443.
- Bimpong, I.K.; Manneh, B.; Diop, B.; Ghislain, K.; Sow, A.; Amoah, N.K.A.; Gregorio, G.; Singh, R.K.; Ortiz, R.; Wopereis, M. New quantitative trait loci for enhancing adaptation to salinity in rice from Hasawi, a Saudi landrace into three African cultivars at the reproductive stage. Euphytica 2014, 200, 45–60.
- Khan, M.S.K.; Saeed, M.; Iqbal, J. Identification of quantitative trait loci for Na+, K+ and Ca++ accumulation traits in rice grown under saline conditions using F2 mapping population. Braz. J. Bot. 2015, 38, 555–565.
- Khan, M.S.K.; Saeed, M.; Iqbal, J. Quantitative trait locus mapping for salt tolerance at maturity stage in indica rice using replicated F2 population. Braz. J. Bot. 2016, 39, 641–650.
- Ammar, M.; Pandit, A.; Singh, R.; Sameena, S.; Chauhan, M.; Singh, A.; Sharma, P.; Gaikwad, K.; Sharma, T.; Mohapatra, T.; et al. Mapping of QTLs controlling Na+, K+ and Cl− ion concentrations in salt tolerant indica rice variety. J. Plant Biochem. Biot. 2009, 18, 139–150.
- Hossain, H.; Rahman, M.A.; Alam, M.S.; Singh, R.K. Mapping of Quantitative Trait Loci Associated with Reproductive-Stage Salt Tolerance in Rice. J. Agron. Crop Sci. 2015, 201, 17–31.
- Gu, X.; Mei, M.; Yan, X.; Zheng, S.; Lu, Y. Preliminary detection of quantitative trait loci for salt tolerance in rice. Chin. J. Rice Sci. 2000, 14, 65–70.
- Negrão, S.; Courtois, B.; Ahmadi, N.; Abreu, I.; Saibo, N.; Oliveira, M.M. Recent Updates on Salinity Stress in Rice: From Physiological to Molecular Responses. Crit. Rev. Plant Sci. 2011, 30, 329–377.
- Wang, Z.; Chen, Z.; Cheng, J.; Lai, Y.; Wang, J.; Bao, Y.; Huang, J.; Zhang, H. QTL analysis of Na+ and K+ concentrations in roots and shoots under different levels of NaCl stress in rice (Oryza sativa L.). PLoS ONE 2012, 7, e51202.
- IRRI. Standard Evaluation System for Rice, 4th ed.; International Rice Research Institute: Manila, Philippines, 1996; Volume 52.
- Lin, H.; Yanagihara, S.; Zhuang, J.; Senboku, T.; Yashima, S. Identification of QTL for salt tolerance in rice via molecular markers. Chin. J. Rice Sci. 1998, 12, 72–78.
- Masood, M.; Seiji, Y.; Shinwari, Z.; Anwar, R. Mapping quantitative trait loci (QTLs) for salt tolerance in rice (Oryza sativa) using RFLPs. Pak. J. Bot. 2004, 36, 825–834.
- Ren, Z.H.; Gao, J.P.; Li, L.G.; Cai, X.L.; Huang, W.; Chao, D.Y.; Zhu, M.Z.; Wang, Z.Y.; Luan, S.; Lin, H.X. A rice quantitative trait locus for salt tolerance encodes a sodium transporter. Nat. Genet. 2005, 37, 1141–1146.
- Riedelsberger, J.; Miller, J.K.; Valdebenito-Maturana, B.; Pineros, M.A.; Gonzalez, W.; Dreyer, I. Plant HKT Channels: An Updated View on Structure, Function and Gene Regulation. Int. J. Mol. Sci. 2021, 22, 1892.
- Gregorio, G.B. Tagging salinity tolerance genes in rice using amplified fragment length polymorphism (AFLP). Ph.D. Thesis, University of the Philippines, Los Banos, CA, USA, 1997; 118p.
- Bonilla, P.; Dvorak, J.; Mackill, D.; Deal, K.; Gregorio, G. RFLP and SSLP mapping of salinity tolerance genes in chromosome 1 of rice (Oryza sativa L.) using recombinant inbred lines. Philipp. Agric. Sci. 2002, 65, 68–76.
- Niones, J.; Gregorio, G.; Tumimbang, E. Fine mapping of the salinity tolerance gene on chromosome 1 of rice (Oryza sativa L.) using near isogenic lines. Crop Sci. Soc. Philipp. 2004, 31, 46.
- Lan, T.; Zhang, S.; Liu, T.; Wang, B.; Guan, H.; Zhou, Y.; Duan, Y.; Wu, W. Fine mapping and candidate identification of SST, a gene controlling seedling salt tolerance in rice (Oryza sativa L.). Euphytica 2015, 205, 269–274.
- Ogawa, D.; Abe, K.; Miyao, A.; Kojima, M.; Sakakibara, H.; Mizutani, M.; Morita, H.; Toda, Y.; Hobo, T.; Sato, Y.; et al. RSS1 regulates the cell cycle and maintains meristematic activity under stress conditions in rice. Nat. Commun. 2011, 2, 278.
- Toda, Y.; Tanaka, M.; Ogawa, D.; Kurata, K.; Kurotani, K.; Habu, Y.; Ando, T.; Sugimoto, K.; Mitsuda, N.; Katoh, E.; et al. RICE SALT SENSITIVE3 forms a ternary complex with JAZ and class-C bHLH factors and regulates jasmonate-induced gene expression and root cell elongation. Plant Cell 2013, 25, 1709–1725.
- Deng, P.; Jiang, D.; Dong, Y.; Shi, X.; Jing, W.; Zhang, W. Physiological characterisation and fine mapping of a salt-tolerant mutant in rice (Oryza sativa). Funct. Plant Biol. 2015, 42, 1026–1035.
- Deng, P.; Shi, X.; Zhou, J.; Wang, F.; Dong, Y.; Jing, W.; Zhang, W. Identification and Fine Mapping of a Mutation Conferring Salt-Sensitivity in Rice (Oryza sativa L.). Crop Sci. 2015, 55, 219–228.
This entry is offline, you can click here to edit this entry!