2.1. Association between Income-Level and Obesity
Study population characteristics.Table 1 compares the distribution of the sample’s characteristics. Overall, the sample age was 47.0 ± 14.0 years, with a slightly more aging WNH population (48.6 ± 11.3). The majority of the study sample had more than a high school education (60.0%), with a higher rate for WNHs (64.1%) and the lowest rate for MAs, of 31% with more than a high school diploma. About 20% of the population were current smokers, with the highest rate for BNHs (26%), and 76% were current drinkers with the highest rate (79.5%) for WNHs. In comparison with MNHs and MAs, BNHs were more likely to be physically inactive (49%); 13.4% of the population lived alone, with the highest rate for BNHs (16%), and the average population in a household was 5.8 people, with the largest household size for MAs. See Table 1 for detailed information and race/ethnicity groups.
Table 1. Distribution of selected characteristics of U.S. adults over 20 years of age between 1999–2016, National Health and Nutrition Examination Survey (n = 36,665).
2.2. A Gap in Income and Highest Income Inequality in Communities of Color
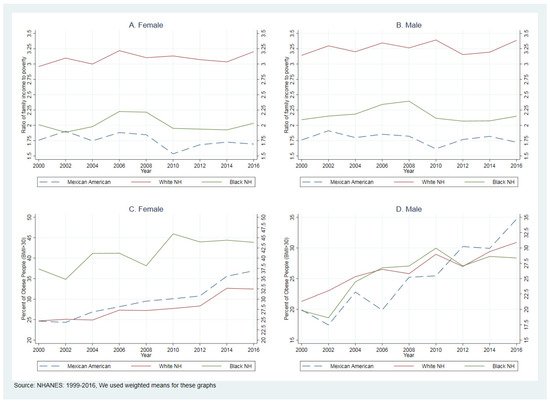
On average, 35% of the population were obese; in comparison, black NHs with 45.5% had higher obesity rates than MA (40%) and white NHs (35%). Interestingly, the distribution on income inequality were different, e.g., WNHs were more likely to be on the fifth quintiles (42%), then BNHs (20%), followed by MAs (12%).
Between 1999–2016, BNH experienced the highest obesity increases: from 18.6% to 45.9%. Mexican Americans had a 19.5%-point increase in obesity from 17.4% to 36.9%, and the lowest increase was for WNH by 11.3 percentage points: from 21.3% to 32.6% in WNH (see Figure 1, panels A and B).
Figure 1. Comparing the ratio of family income to poverty and percent of obese people (BMI > 30).
There is a massive gap between the income-to-poverty ratio between 1999–2016. Figure 1 (panels C and D) compares PIR trends between WNH, BNH, and MA women and men. Between 1999–2016, the average PIR was 3.17, 2.10, and 1.80 in WNH, BNH, and MA. To understand more about these differences, we used Lorenz curves and Gini coefficients.
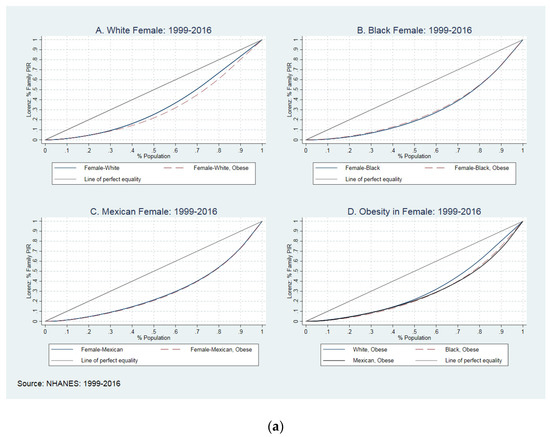
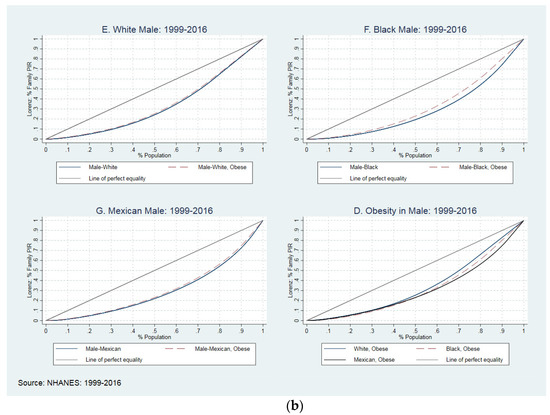
Figure 2—Lorenz curves—shows the Gini coefficient for the income-to-poverty ratio in white NH, black NH, and Mexican American men and women in the US between 1999 and 2016. To plot these curves, we used average GC with jackknife standard errors. This figure compares GC between obese and non-obese women with different skin colors (Figure 2a) and obese and non-obese men with different skin colors (Figure 2b), and obese and non-obese populations by sex.
Figure 2. (a) The Lorenz curves and Gini coefficients in women, 1999–2016. (b) The Lorenz curves and Gini coefficients in men, 1999–2016.
In Figure 2a panel A, the solid blue line plots the distribution of income in non-obese WNH women; the dash-red line shows the distribution in WNH obese women. The blue line stays over the red line for about 30% of the population and closer to the perfect equality line, which means lesser income inequality within non-obese (GC: 0.269) and greater inequality within obese women (GC: 0.301). Interestingly, there was a different pattern in the BNH population. As presented in panel B, obese BNH women suffered less from income inequality than non-obese (GC: 0.380 vs. 0.392). The red-dash-line stays over the solid blue line for about 50% of the population and closer to perfect equality. Panel C does not show many differences between obese and non-obese MA women (GC: 0.410 vs. 0.395). The last panel (Panel D) compares income inequality between obese WNH, BNH, and MA; overall, BNH women suffered more from obesity than WNH and MA obese women. As presented, BNH women and MA women suffered more from income inequality than WNH. In obese women, WNHs’ lower 25% of the population observed 8.1% of income, BNH followed 6.2% of income, and MA observed 6.4% of income.
Figure 2b compares the GC between obese and non-obese WNH, BNH, and MA men. In panels A, B, and C, we reached the GC between obese and non-obese in WNH, BNH, and MA men. The red-dash-line represents that obese men stay above the solid blue line (non-obese men), meaning lower-income inequities for all groups of income. Despite the difference between racial groups, all obese men suffered less from obesity. For example, the GC moved between 0.247 (S.E.: 0.004) in obese WNH to 0.254 (S.E.: 0.003) in non-obese groups, with similar patterns in BNH and MA. In panel I, we compared the income inequality between WNH, BNH, and MA obese men. Overall, BNH obsess men suffered more from income inequality than WNH and MA, e.g., obese WNHs’ lower 25% of the population observed 9.4% of income, BNH followed 6.9% of income, and MA observed 7.8% of income. See Table 2 for more details on the GC across race/ethnicity and sex.
Table 2. Comparing Gini coefficient across racial/ethnical groups and sex in U.S. adults in the 1999–2016.
2.3. The Association between Income and Obesity
The association between PIR and obesity in white NH, black NH, and MA is reported in Table 3. The association between income inequality and obesity is a positive and significant association between obesity and income in the middle and top PIR quintiles in WNH and BNH, but not for the MAs. WNH in the 3rd, 4th, and 5th PIR quintiles suffered 22%, 34%, and 29% times more than the population in the first PIR quintile. It is the same picture for the BNH, with 19.0%, 30.0%, and 38% in the third, fourth, and fifth PIR quintiles.
Table 3. Association between PIR and obesity across racial/ethnic groups in U.S. adults, 1999–2016.
The adjusted models show that in all racial/ethnic groups, the obese population was more women, high school graduates, and former drinkers with poor or fair health. There are some differences between WNH, BNH, and MA. For example, being married has been positively associated with obesity in BNH and MA but not in WNH. Being physically non-active was positively associated with obesity in WNH and MA but not in BNH. Having health insurance coverage also was associated with obesity in MA, but not in WNH and BNH. Finally, obesity was associated positively with the size of a household in WNH.
2.4. How Is the Association between Income and Obesity in Men and Women?
The stratified model by sex showed that the association between income and obesity was consistently significant among top PIR quintiles in WNH and BNH men, but not in MA men. For example, WNH men in the 4th (PR: 1.28, CI: 1.08–1.50) and 5th (PR: 1.20, CI: 1.02–1.42) PIR quintiles suffered more from obesity, with a similar pattern for BNH in the 4th (PR: 1.23, CI: 1.03–1.47) and 5th (PR: 1.28, CI: 1.08–1.52) PIR quintiles. The same association was not found for women. See Table 4 for more details.
Table 4. Association between income differences and obesity across racial/ethnic groups in U.S. adults, 1999–2016.
Sensitivity analysis results. We ran several sets of IV Poisson regression models using family size as an instrumental variable. We then tested the exogeneity of the instrumented variable by using the Wald test [
38], We reported the results of the Wald test in
Appendix A. Our findings have shown that there was no endogeneity between PIR and family size in black NH and Mexican American families, and because there was no endogeneity, we used the standard Poisson regression models. However, for the white NH household, we were not able to reject the null hypothesis of no endogeneity and we ran sets of IV Poisson regression models; because there were no changes in the signs of PIR quintiles, for the original analysis we used the standard Poisson regression models for WNH to make it possible for the audience to compare the results. We reported the results of the IV passion models for WNH in
Appendix B.


