West Nile fever (WNF) is an arthropod-borne viral disease that is transmitted from birds to humans and animals by mosquitoes. Humans may develop a severe disease, which sometimes can be fatal. At the end of the 20th century, the first outbreak of WNF among humans in an urban environment in Eastern Europa and the United States was reported. The epidemics were characterized by the neurological form of the disease with fatal outcomes. WNF spread is driven by location and time, which means nearby locations and periods have similar patterns. Recognition of patterns of spread of disease is crucial for mitigation of disease and prevention. Regression analysis of the predictors of the infection and spatiotemporal analysis enables the detection of risk factors and measurement of their association with West Nile virus infection in humans and animals. We identify the following factors as a crucia for the prediction of possible WNF outbreaks: the presence of viruses in natural reservoirs and sentinels, mosquito abundance, and climate factors, i.e., environmental temperature, precipitation, and river water levels fluctuation.
1. Introduction
West Nile virus (WNV) is a single-stranded RNA arbovirus from the Flaviviridae family, genus Flavivirus. WNV is primarily a zoonotic agent transmitted between birds as the main reservoir hosts and mosquitoes as vectors. Humans and horses can be infected as spillovers host, but the infection in these organisms ends without further transmission of the virus, i.e., these organisms are dead-end hosts [
1,
2]. WNV is today considered the most important cause of viral encephalitis in humans worldwide [
3].
The WNV has been isolated or identified serologically in many vertebrate species [
4]. Since 1998, cases of viral encephalitis caused by WNV in horses have been reported in Italy, France, and North America. Research conducted in parts of Europe and the Middle East has established that as much as one-third of the tested horses were exposed to the WNV, with or without symptoms of the disease [
5,
6].
Since the discovery of the first infection in humans in 1937 [
4], there has been a significant spread of the disease globally. In most cases, the infection was asymptomatic and only a few cases of severe neurological forms of the disease were reported [
2]. At the end of the 20th century, the first West Nile fever WNF outbreaks among humans in urban environments in Eastern Europe and the United States were reported [
2]. Since 2012, human WNF cases have been recorded every year in Serbia. In terms of the number of patients, the years 2013 and 2018 stand out, when the largest numbers of clinical cases of infection were registered [
7]. The epidemics were characterized by a serious neurological form of the disease with a fatal outcome. During these epidemics, several common characteristics were observed at the time of the disease outbreaks: the
Culex pipiens mosquito was identified as a vector of the disease, significantly less precipitation was registered than the usual multi-year average, significantly higher than normal summer temperatures were recorded, and all areas were located near large rivers which provide adequate living conditions for residential and migratory species of wild birds [
2]. Besides, the epidemic in the northeastern United States was accompanied by the epizootic in birds, especially crows [
8]. The sudden appearance of WNF in the United States can also be related to changes in the feeding habits of
Cx. pipiens, the dominant enzootic species. Shifts in feeding habits from competent avian hosts early in the early stage of the epidemic to incompetent humans after mosquito infection, resulted in synergistic effects that greatly amplified the number of human infections [
9].
Given that WNF is an arthropod-borne disease, the spread of the disease is conditioned by climatic variations and landscape changes to the natural habitats of the mosquitoes and available bird habitats [
1,
4], geospatial data can be used for risk prediction and risk mapping [
10]. With the development of geographic information system (GIS) software and other related tools for spatial data analysis, substantial progress has been made in risk analysis [
11]. Numerous studies have used geospatial data and GIS software for detecting, analyzing, and predicting spatial patterns of disease occurrence [
10,
12,
13,
14]. The advantage of the GIS analytical tool is the ability to integrate and analyze risk factors and create WNV risk maps for humans and other susceptible hosts [
15]. In addition to visualizing epidemiological data and presenting the geographical distribution of the disease in a much more predictive manner, the spatiotemporal analysis identifies spatial and temporal clusters and identifies risk geographic areas. Spatial inquiry can also inform vector control policy, including where to prioritize limited control resources [
16,
17,
18]. By identifying locations of the WNF hot spots, the mosquito control treatments can be rationally and more efficiently applied primarily in high-risk areas and, therefore, will more efficiently decrease virus transmission [
17,
19].
The analyses conducted in this paper aimed to discover spatial, temporal, and spatiotemporal clusters of WNV infection in humans and animals in South Banat District, Serbia, also researching for causal relationships, i.e., identifying such clusters of WNV cases and researching possible causal or associative relationships with meteorological factors. Our focus was on understanding spatiotemporal patterns and risk factors associated with WNV infection in humans and domestic animals. An additional aim was to investigate the epidemiological characteristics of WNV outbreaks and provide a scientific basis for the effective control of this disease. Spatial research into the geography of the West Nile disease in Serbia includes WNV surveillance in mosquitos (collected at trap locations), surveillance of WNV infection in horses, wild bird surveillance for WNV presence, and collection of human case residential addresses [
20,
21].
2. Epidemiological Characteristics of WNV Outbreaks in 2017, 2018, and 2019
2.1. Descriptive Statistics
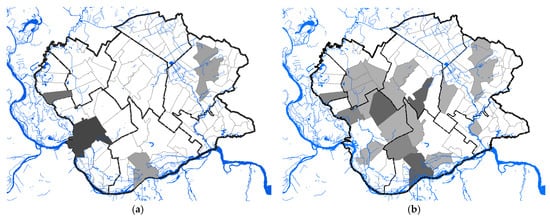
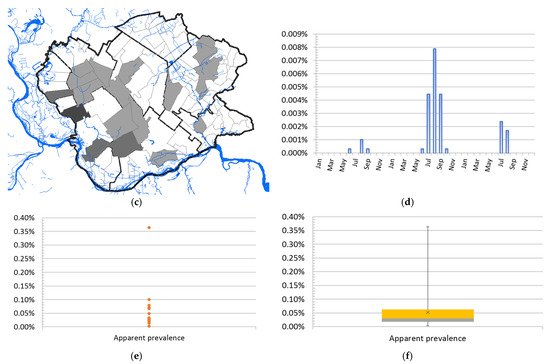
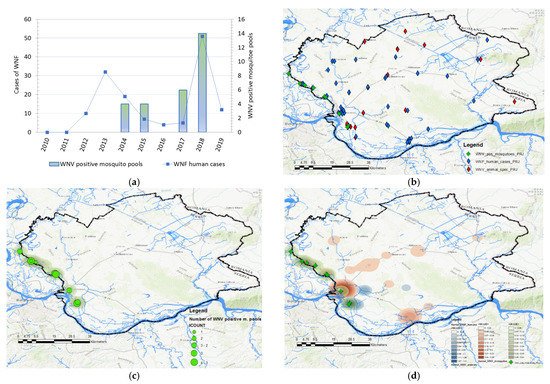
A total of 68 human clinical, laboratory-confirmed cases of WNV infection were included in this study. The case number of WNV in humans maintained a seasonal variation in the study period, ranging from 0.24 to 2.48 cases per 100,000 person-months at risk. We estimated that the average incidence rate of WNV in 2017 was 0.24 per 100,000 person-months at risk, whereas, in 2018, the average incidence rate was 2.48 per 100,000 person-months at risk, and in 2019 it was 0.58 per 100,000 person-months at risk. The period prevalence in 2017 was 0.0017%, while in 2018 it was 0.017%, and in 2019 it was 0.0041%. The period prevalence in 2018 in populated areas ranged from 0.0028% to 0.3636%. The largest number of registered WNV cases was recorded in Pančevo, a total of 18 cases. The highest prevalence of WNV infection was recorded in the villages of Mali Žarm and Dupljaja, 0.36% and 0.10%, respectively. Figure 2 shows the distribution of clinical cases of WNV infection and the epidemiological characteristics of the WNV human outbreaks in 2017, 2018, and 2019 in the South Banat District.
Figure 2. Epidemiological characteristics of West Nile virus outbreaks in 2017, 2018, and 2019: (a) Distribution of WNV human cases in 2017; (b) distribution of WNV human cases in 2018; (c) distribution of WNV human cases in 2019; (d) incidence risk of WNV infection in humans during the study period; (e) dot plot of WNV prevalence in 2018; (f) box plot of WNV prevalence in 2018.
2.2. Seasonality
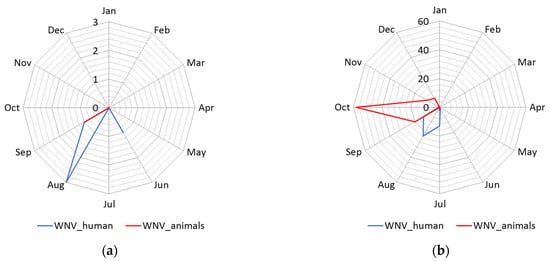
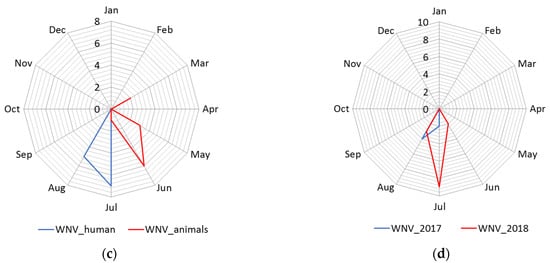
The distribution of human cases of WNV infection displayed a clear seasonal pattern (Figure 3). During the WNV transmission season in 2017, human cases of WNV infection were recorded between June to September, whereas in 2018 they occurred between June to October (Figure 3). The highest number of human cases were recorded in 23 August 2018 in total. In the following transmission season in 2019, although a significantly smaller number of cases of infection were registered, the appearance of the disease was also seasonal. Thus, human cases of WNV infection were recorded between July to August 2019, and the highest number of cases was recorded in July, i.e., seven in total (Figure 2 panel d).
Figure 3. Seasonality of the West Nile virus WNV infection registered in South Banat District in different months: (a) Cases of WNV infection in humans and animals in 2017; (b) cases of WNV infection in humans and animals in 2018; (c) cases of WNV infection in humans and animals in 2019; (d) WNV infected mosquitoes in 2017 and 2018.
The average ambient and average ambient maximum temperature of the two weeks before the first WNV human case was detected in 2017 were 22.5 °C and 28.26 °C, respectively, in 2018 were 20.84 °C and 25.96 °C, respectively, and in 2019 were 23.35 °C and 26.61 °C, respectively. The average ambient and average ambient maximum temperature of the two weeks before human cases terminated ranged between 23.35 °C to 26.05 °C and 26.61 °C to 32.31 °C, respectively. The highest incidence was observed when the two-week average ambient and average ambient maximum temperature were 26.73 °C and 26.73 °C, respectively. Negative binomial regression analysis was used to estimate relationships between registered WNV human cases and monthly average ambient temperatures, i.e., minimum average temperatures, average temperatures, and maximum average temperatures. Regression analysis proved a positive association between environmental temperature, the number of WNV-positive mosquito pools, and the registered number of WNV human cases. The estimated negative binomial regression coefficients for the model predictors variables, i.e., average minimum temperature, and WNV-positive mosquito pools, were positive and significant, indicating that these factors are significant predictors of infection in humans. The negative binomial coefficients for the minimum average temperature and WNV-positive mosquito pools were βmin_t⁰ = 0.251 and βmosq.1 = 0.335, respectively, bound with 95% Wald confidence interval (CI) of 0.072 to 0.431 and 95% CI of 0.029 to 0.641, respectively. The estimated p-values were.006 and.032, respectively. The results showed that for a one-unit change in the predictor variables, the difference in the logs of expected counts of the WNV human cases is expected to change by the respective regression coefficient, provided that the other predictor variables in the model are held constant. Concerning the incidence rate ratio (IRR) the exponential value of the regression coefficient βmin_t⁰ for minimum average temperature indicates that every increase of average minimum temperature for one degree of celsius would increase the incidence rate of WNV infection in humans by a factor of 1.286 or 28.6% and for predictor variable WNV-positive mosquito pools the exponential value of the coefficient βmosq.1 indicates that every increase of registered WNV-positive mosquito pools by one would increase the incidence rate of WNV infection in humans by a factor of 1.398 or 39.8%, provided that the parameter of the minimum average temperature is unchanged. The negative binomial regression coefficients for the average temperature and WNV-positive mosquito pools were βaverge_t⁰ = 0.223 and βmosq.2 = 0.331, respectively, bound with 95% CI of 0.055 to 0.392 and CI of 0.028 to 0.635, respectively, while for the average maximum temperature and WNV-positive mosquito pools were βmax_t⁰ = 0.219 and βmosq.2 = 0.303, respectively, bound with 95% CI of 0.043 to 0.395 and 95% CI of 0.004 to 0.602, respectively.
The results of the regression analysis show that fluctuations, ie changes in the water level of the Danube, affect the number of registered cases of WNV infection, both in humans and mosquitoes. The estimated negative binomial regression coefficients for the minimum, average, and maximum water level, were negative and significant, which practically means that as the river level decreases, the number of registered cases increases. The following values of regression coefficients concerning the variables minimum water level, average level and maximum water level were obtained: βwater_min = −0.021 (95% CI −0.038 to −0.003, p-value 0.02) βwater_average = −0.0019 (95% CI −0.034 to −0.005, p-value 0.009) and βwater_max = −0.013 (95% CI −0.023 to 0.003, p = 0.012).
Regression analysis proved a positive association between environmental temperature and the number of WNV-positive mosquito pools. The estimated negative binomial regression coefficient was positive and significant, indicating that this factor is a significant predictor. However, the precipitation was negative and insignificant, so as such it was excluded from the model. Instead of this predictor, the model includes the water level of the Danube as a predictor. The following values of the coefficients were obtained by regression analysis: βmin_t⁰ = −0.184 (95% CI −0.005 to 0.364, p = 0.04) βwater_max = −0.013 (95% CI −0.026 to −0.001, p = 0.04). The estimated negative binomial regression coefficient for predictor—the water level of the Danube was negative and significant, indicating that this factor is a significant predictor.
The model was validated by the cross-validation method with satisfactory results. For the sample test that included 45% of the data, Spearman’s rank correlation coefficient, ρ was 0.708 (p = 0.033), while Kendall’s compliance coefficient, τ was 0.591 (p = 0.045). For validation purposes, the data on the number of registered WNV human cases of infection in humans, data on WNV-positive mosquito pools, and temperature were used. For the training sample with 55% of the data the correlation coefficient ρ was 0.628 (p = 0.029) and Kendall’s τ was equal to 0.557 (p = 0.018). By comparing the actual values of the WNV human cases and the values predicted by the model were calculated bias, mean average error (MAE), normalised MAE, mean square error (MSE) I root mean square error (RMSE). The following values were obtained: bias = 1.53, MAE = 2.07, NormMAE =0.64, MSE = 16.03, and RMSE = 4.08.
2.3. Geographical Distribution and Abundance of WNV-Positive Mosquitoes
Data in Figure 4 displays the distribution of WNV-positive mosquito pools and the distribution of human cases between 2010 and 2019. Mosquitoes were surveilled for the presence of WNV in 2014, 2015, 2017, and 2018. During the 2017 and 2018 surveillance seasons, significantly higher numbers of WNV-positive mosquito pools were registered, especially in 2018. In 2017, the virus was detected in mosquitoes at a total of 5 out of 10 locations, while in 2018, circulation was proven at 9 out of 10 tested locations. The frequency of WNV-positive mosquito pools was used to create kernel density maps for each year (2017 and 2018) and these were compared with kernel density maps of WNV infection in humans and animals (Figure 4 panels (e) and (f)). By comparing clusters, we noticed a positive match between the clusters of WNV-positive mosquitoes and the clusters of registered human and animal cases of infection, shown in Figure 4 panels (c) and (d). Moreover, the clusters of WNV-positive mosquito pools, which were classified by the KDE technique into the category of very high-density clusters, coincided with the clusters of WNV infection in humans and animals, which were also categorized as high-density clusters or very high-density clusters. Matches were not observed only in those mosquito sampling localities where there were no domestic animals, and that were distant from populated areas. The increased higher numbers of registered human and animal cases correspond to the areas with a higher density of WNV-positive mosquito pools.
Figure 4. Distribution and abundance of the West Nile virus (WNV) human cases and WNV-positive mosquito pools: (a) Frequency distribution of human cases of WNV infection, and WNV-positive mosquito pools in 2014, 2015, 2017, and 2018; (b) distribution of registered cases of WNV infection in humans (blue), domestic animals (red), in 2017, 2018, and 2019 and mosquitoes (green) in 2017 and 2018; (c) geographical distribution and abundance of the WNV-positive mosquito pools in 2017 and 2018; (d) overlay of kernel density clusters of WNV in humans (red), domestic animals (pink), and clusters of WNV-positive mosquitos (blue).
2.4. The Water Level of the Danube and Tamiš Rivers
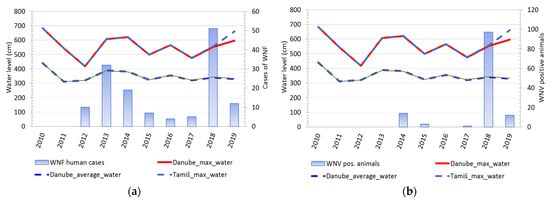
Comparison of changes in water levels in the Danube and Tamis rivers and cases of WNV showed that changes in water levels in rivers were accompanied by a change in the number of registered clinical cases of WNV in humans. Except in 2016, every increase in water levels and a sharp decline in river levels was accompanied by a consequent rise in the number of sick people. An identical pattern was observed for cases of infection in tested animals (Figure 5). It was notable that animal cases of infection appear after the end of the period of decline of previously high water levels. (Figure 6).
Figure 5. Water level fluctuations and registered cases of West Nile virus (WNV) infection in humans and animals over 10 years: (a) Water level fluctuations and registered number of WNV human cases; (b) water level fluctuations and registered cases of WNV seropositive animals.
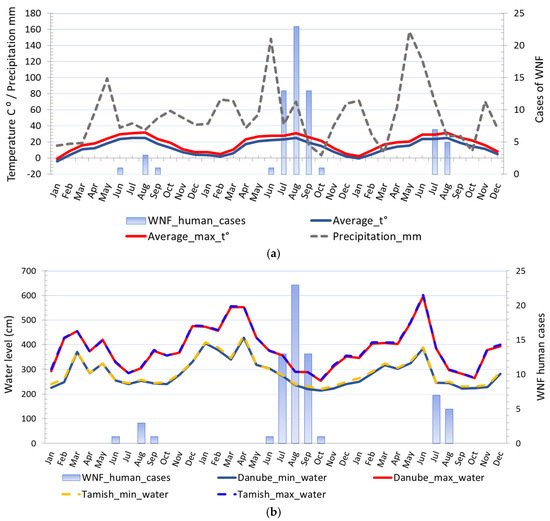
Figure 6. Comparison of different climatic risk factors and distribution of registered WNV human cases in 2017, 2018, and 2019: (a) Seasonal fluctuations in temperature, precipitation, and registered cases of WNV infection in humans; (b) seasonal fluctuations in water levels and registered cases of WNV infection in humans.
2.5. Results of Seroconversion Tests in Domestic and Wild Animals
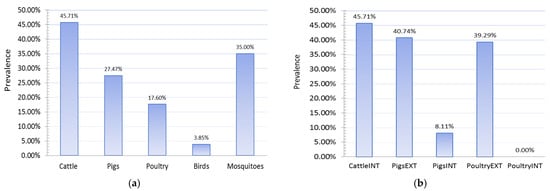
The study of the seroprevalence of WNV in domestic animals showed high prevalences of infection in domestic animals, especially those raised on rural holdings in an extensive manner (Figure 7). The highest level of seroprevalence was recorded in cattle in 2018, followed by pigs raised on rural holdings, 45.71%, and 40.74%, respectively. Pigs reared on rural holdings are 7.79 times more likely to be infected with WNV than pigs on industrial farms. This odds ratio (OR 7.79, 95% CI 2.12 to 28.57) means the type of production was recognized as an exposure risk factor, and this category of animals is more prone to infection. In 2018, chickens kept on rural holdings also had a high prevalence of infection (p = 39.29%), while no case of infection was detected in any chicken kept on industrial farms. Chickens reared on rural holdings are more likely to be infected with WNV than chickens on industrial farms.
Figure 7. Seroprevalences showing (a) PCR detection of West Nile fever (WNV) in wild animals and mosquitoes and (b) WNV infection in domestic animals, 2018. INT—intensive farm production; EXT—extensive production on rural holdings.
This entry is adapted from the peer-reviewed paper 10.3390/ani11102951