This system incorporated artificial intelligence (AI) services using computer vision and combined various deep learning recognition models to achieve scalability and added functionality, in order to perform aquaculture surveillance tasks. The recognition model is embedded in the aquaculture cloud, to analyze images and videos captured by the autonomous drone. The recognition models detect people, cages, and ship vessels at the aquaculture site. The inclusion of AI functions for face recognition, fish counting, fish length estimation and fish feeding intensity provides intelligent decision making. For the fish feeding intensity assessment, the large amount of data in the aquaculture cloud can be an input for analysis using the AI feeding system to optimize farmer production and income. The autonomous drone and aquaculture cloud services are cost-effective and an alternative to expensive surveillance systems and multiple fixed-camera installations. The aquaculture cloud enables the drone to execute its surveillance task more efficiently with an increased navigation time. The mobile drone navigation app is capable of sending surveillance alerts and reports to users. Our multifeatured surveillance system, with the integration of deep-learning models, yielded high-accuracy results.
1. System Components and Functions
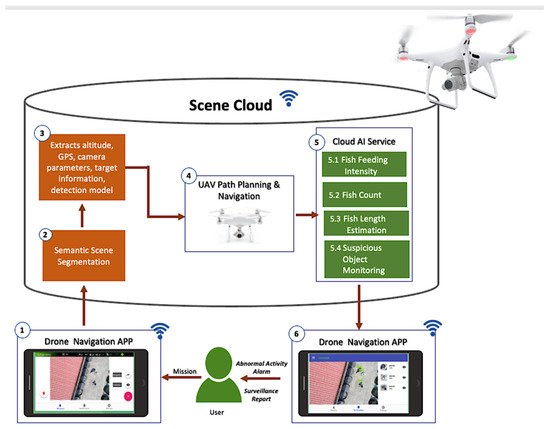
This section provides details and components of our visual surveillance system. The framework in Figure 1 contains three main elements: drone, Drone Navigation App, and scene cloud.
Figure 1. System framework.
The drone navigation app is a personalized mobile application installed on the user’s device. It sends instructions and receives data from the drone, and at the same time sends data and receives alerts or notifications from the scene cloud. Using the Drone Navigation App, the user selects a mission that the drone must execute. This mobile application, developed using the Java language, can be installed on mobile devices with IOS or Android platforms and WIFI capability to connect to the drone and the cloud of the area.
After the user selects the mission, the drone navigation app will command the drone to fly at high altitude above the aquaculture farm to capture the aerial image of the aquaculture site. It will then send these images to the cloud for semantic scene segmentation to locate the target object in the field. Semantic scene segmentation labels or classifies specific regions of captured images for scene understanding. It analyzes the concept and nature of objects and recognizes them and their corresponding shapes in the scene. First, it detects the object, identifies its shape, and then performs object classification [
8].
For semantic scene segmentation, the locations of the objects taken from the aerial images were already known, manually marked, and saved in the scene cloud database. These objects can be aquaculture tanks, box nets, ships, and personnel. Mask R-CNN [
9] is a deep-learning convolutional neural network utilized for image segmentation and distinguishes the different objects in the images. Detection of various objects in the scene is needed to perform physical surveillance of the aquaculture site, which will allow the drone to identify its target object for its mission. Understanding the scene will allow the drone to navigate its target object correctly.
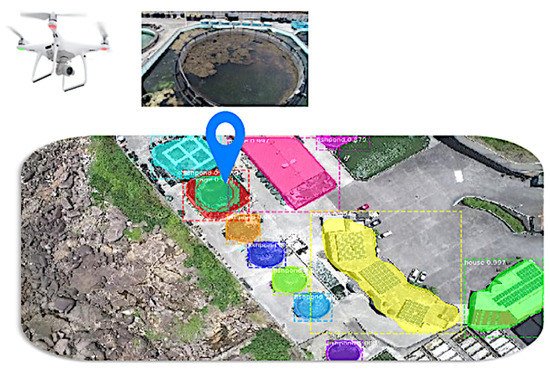
We integrated a two-dimensional (2D) semantic representation of the scene to locate the necessary objects in the aquaculture site. The result of the semantic scene segmentation is the visual and geometrical information of the semantic object that defines the checkpoints for the inspection work. Each checkpoint is associated with the corresponding global positioning system (GPS) signal. The altitude of the drone in Figure 2 locates the 2D objects such as aquaculture tanks and cages.
Figure 2. Semantic scene segmentation.
The scene cloud functions as the brain of the system, equipped with different services capable of decision making and analysis. The altitude, GPS information, camera parameters, target information, and detection model are the information stored in the cloud used for the unmanned aerial vehicle (UAV) path planning and navigation. The scene cloud utilizes the Google Firebase platform as its architecture and the scene dataset keeps the status of the scene updated. A database-management application was designed for its management so that users can easily search for information.
The drone path planning and navigation are the core of this paper. It contains the mechanisms, design, and procedures of its autonomous capability. Planning the path to navigate the target object or facility is relevant in performing surveillance for the drone to arrive at its target or destination safely. This plan will enable the drone to avoid obstacles during the flight which may cause damage, in order to safely navigate to its destination using the navigation path-planning service of the scene cloud. We integrated various algorithms and techniques for the drone’s autonomous navigation capability. The details of the drone path planning and navigation are in
Section 2.2.
Once the target object is established, the autonomous drone uses the calculated path from the path planning to navigate to the target object and perform individual monitoring tasks (e.g., fish feeding intensity and suspicious object monitoring). The drone once again takes the video of the monitoring tasks and sends it to the scene cloud to execute the corresponding AI service. The AI services process the data and sends an alert for abnormal activity, suspicious events, or the level of the fish feeding. Instead of utilizing the drone to include graphics processing, the AI services, as part of the cloud, save a large amount of power consumed by graphics processing, enabling the drone to use its power to perform surveillance. The convolutional neural networks and other technical details for the semantic scene segmentation and cloud AI services are presented in
Section 2.3.
Additionally, the drone can serve as a gateway to connect the underwater cameras (e.g., stereo camera system, sonar camera) to the cloud AI services to perform additional fish surveillance such as fish count and fish-length estimation using the underwater camera.
Suspicious object monitoring can detect suspicious objects, which could be ships or humans, that can cause possible security threats to aquaculture farms. If a human is identified as a suspicious object, the corresponding AI service instructs the drone to continue the navigation. The computed altitude and camera pose parameters will be the basis for capturing the facial image of the suspicious human object. The captured image is sent to the cloud to perform further face recognition using FaceNet [
10] deep-learning model. It will compare the newly captured images with the images of the authorized persons or staff in the scene database. This approach will distinguish workers from nonworkers or authorized from nonauthorized individuals and alerts the user for detected intruders. In executing the AI service for a fish-feeding-intensity mission, the cloud must first detect a fish cage or pond in the aquaculture site. Upon detection of the target object, the cloud will provide the altitude and camera position parameters for the drone to auto-navigate and proceed to the area of the fish cages. When the drone arrives at its target destination, it will then capture the feeding activity at the fish cage facility. The captured video is sent to the cloud for further processing and executes the fish-feeding-intensity evaluation and sends the feeding level to the users using the drone navigation APP.
2. Drone Path Planning and Navigation
For path planning, the scene cloud will use the GPS information of the detected object or the target goal (e.g., fish boxes for fish feeding intensity) to plan the path and sends this information to the user’s device. This user’s device has the drone navigation app installed and controls the drone using its WIFI channel as the communication device. The drone is also equipped with WIFI to communicate with the user’s device and scene cloud. The D* Lite algorithm [
11], works by reversing the A-star (A*) search framework [
12] using an incremental heuristic method for its search functions. Its key feature involves using previous search results to identify the path-planning requirement instead of solving each search from the start. If connections between nodes are created, the data are modified and only affected nodes are recalculated. It also identifies the best path or the shortest path with the lowest navigation cost using the following equation:
where f(n) is the total score from the starting point through node n to the target point. Meanwhile, g(n) is the actual distance from the starting point to node n and h(n) is the estimated distance from node n to the target point. When h(n)=0 no calculation is made. If h(n) is the actual distance from node n to the target point, then node n is the node on the best path.
Since drone navigation is a dynamic planning problem due to its actual changing environments or characteristics, possible obstacles are present during the drone navigation process. The drone should be able to collect information and send it to the scene cloud to plan the path of an unfamiliar map in real-time. The D* Lite [
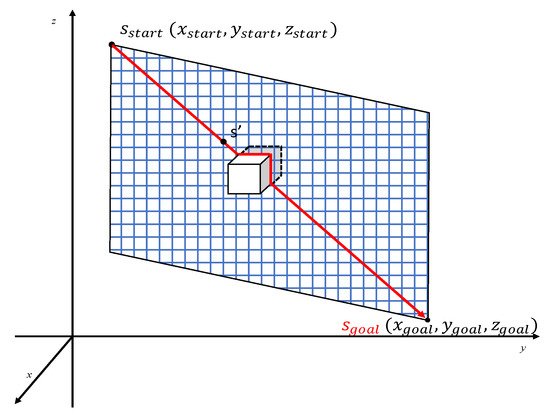
11] algorithm for path planning works for a dynamic environment and is the most suitable for drone navigation. It uses the current position as the starting point for the calculation and searches backward from the target point to the starting point. In drone navigation using the D* Lite algorithm to navigate a three-dimensional space, for the space coordinates of the starting point
Sstart, and target point
Sgoal, the
x axis and
y axis correspond to the GPS coordinates of longitude and latitude positions, respectively; the
z axis represents the drone’s navigational height.
Figure 3 is a schematic diagram of drone navigation, and the blue grid is the drone flight map. This map is a plane composed of four point


. When encountering obstacles, the edge is updated, and the path is re-panned. Hence, if an obstacle (white box) suddenly appears during the navigation at the top, a new plan or path is created from the scene cloud and sends this information for the drone to avoid the obstacle until it reaches its target destination or path.
Figure 3. The navigation schematic diagram.
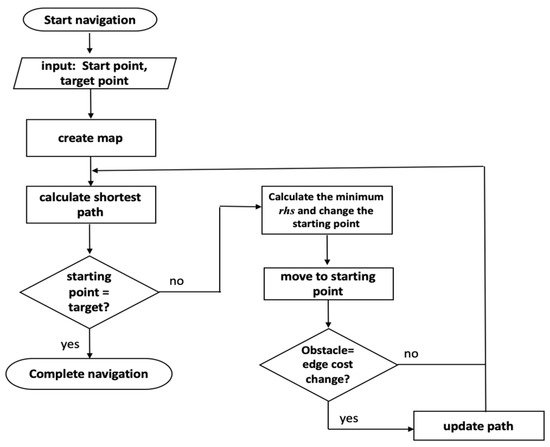
Figure 4 represents the flow chart of our drone navigation. As an initialization and to create the navigation map, the start-point and target point are needed. After building the plan map, the estimation of the shortest path (
Figure 3) follows next. The shortest path ensures that the drone has the minimum navigation cost from its current to target location [
13]. The drone now uses the computed shortest path in its navigation and checks if the starting point is the same as the target point. Once it reaches an equivalent value for the starting point and target point, the navigation task or mission is complete.
Figure 4. Flowchart diagram of the drone navigation.
Otherwise, if the starting point is not the same as the target point, the navigation continues. It will then compute and finds the minimum vertex position to change the current starting point and moves to this new position. During the navigation, it will check for new obstacles in the area. If obstructions are detected, the path is recomputed using the shortest path function. If not, it will first update the current path plan, and then it will continue to calculate the fastest path. The path planning computation iterates until the drone’s starting point is the same as its target point. The drone has reached its destination and completed its task once the start point is equal to the target point.
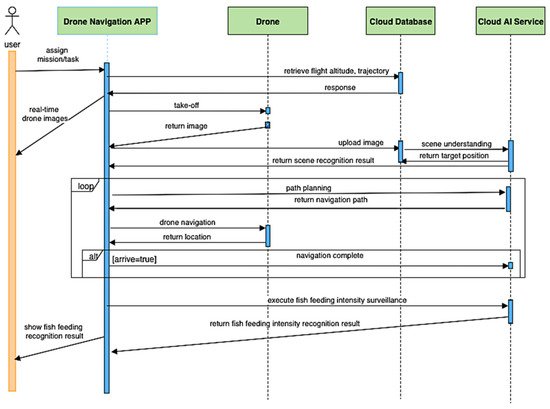
The sequence interaction diagram shows the order of interaction between the app, drone, cloud database, and the cloud services and how they work together to execute and complete visual surveillance. Figure 5 is the sequence diagram for the fish feeding intensity. Initially, the user selects the mission using the Drone Navigation App, which serves as the communication channel for the drone, cloud database, and cloud service for the drone take-off, capturing images and setting the route or path for the drone to navigate. The drone obtains the necessary parameters for navigation from the cloud database, the internal and external camera parameters, field knowledge for field analysis, path planning, and feeding monitoring.
Figure 5. Sequence interaction for fish feeding intensity.
When the drone takes off for the first time, it will perform scene analysis. The drone is first navigated at an altitude of 100 m to capture the image of the scene and sends it to the cloud database. After receiving the captured images, the cloud semantic understanding function searches for the location of the monitored objects from the scene. Once the captured scene is analyzed, it will send this information to the drone navigation app to perform drone navigation. The cloud provides the GPS coordinates of the drone, the location of the target object, the knowledge about the scene, route navigation to guide the drone towards the correct destination for monitoring. The drone continues to navigate until it reaches its target destination. The algorithm previously mentioned recalculates or modifies the navigation path in case there are obstacles along the way to avoid damage to the drone. Once the drone reaches the destination of the assigned mission or task, it will capture the fish feeding activity and sends data to the cloud AI service to evaluate the feeding level. This feeding level is forwarded to the user using the navigation app.
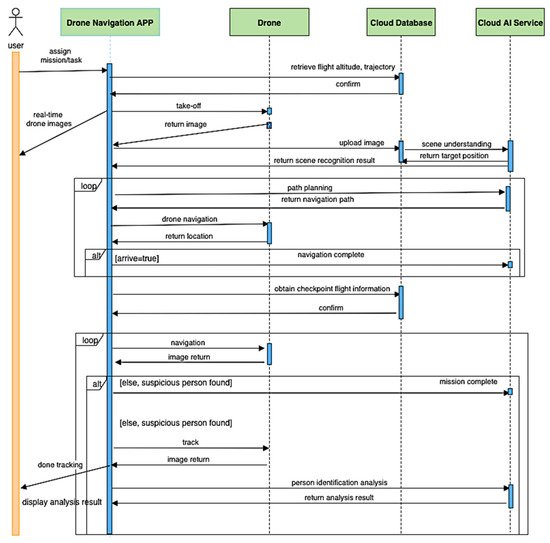
Figure 6 is the sequence diagram for monitoring the personnel in the aquaculture site. The same steps are integrated as for drone navigation in Figure 5. The only difference is that the personnel monitoring task is continuous even after obtaining the checkpoint. The drone monitors all individuals found on the site, one at a time. It captures the facial image of each person and sends it to the cloud AI service to perform face recognition. Once the cloud detects a suspicious person based on the facial images sent by the drone, the cloud alerts the user using the navigation app. If there is no suspicious person from the people present in the aquaculture site, the mission ends.
Figure 6. Sequence interaction for personnel monitoring.
3. Autonomous Drone for Navigation and Surveillance
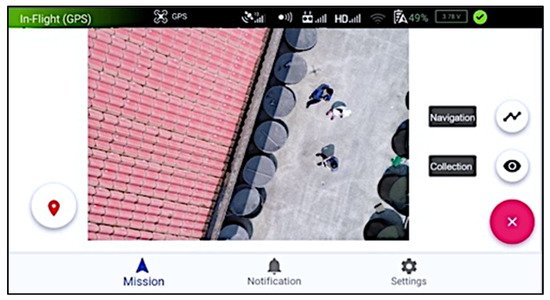
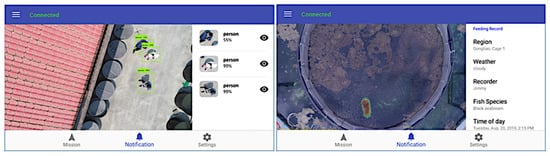
Figure 10 shows the drone’s initialization process with the drone navigation app installed on the mobile device. The user can select a mission such as suspicious person detection or fish feeding evaluation; the user can execute only one mission at a time. The drone navigation app initializes the drone’s take-off. The drone was designed to be mobile and autonomous. Once initialized by the user, the drone can execute its mission and reach the target facility without any user intervention. Drone surveillance or site monitoring is the main function of the drone. This task is achieved by the drone using its installed RGB camera to capture real-time images and videos as a form of surveillance and sends this directly to the cloud for processing through its AI services. The surveillance report generated by the AI services sends this information to the user through its drone navigation app, as shown in Figure 11. Once the drone has completed its task or cannot detect the target facility, it will go back to its original starting position.
Figure 10. Mission selection by the user.
Figure 11. Surveillance report using the navigation application.
4. Semantic Scene Segmentation
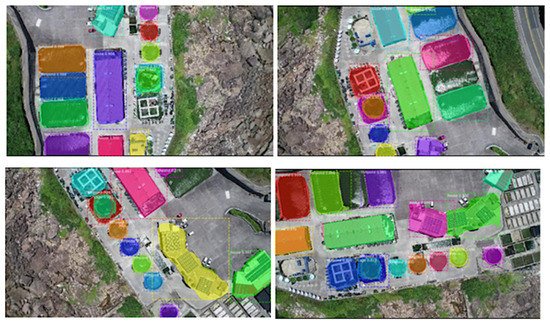
The drone is equipped with a camera and takes RGB images with different views and perspectives. These images captured by the drone are sent to the cloud to perform semantic scene segmentation. This function enables the system to understand the various facilities or objects present in the scene. For surveillance, we integrated a 2D semantic representation of the scene to locate the necessary objects in the aquaculture site. The semantic model represents the visual and geometric information of the semantic object that defines the checkpoints for the inspection work. Each checkpoint is associated with the corresponding GPS signal and altitude of the drone. Figure 12 shows the results for the detection of semantic objects in which objects were highlighted or colored (fish cages, houses, and fishponds) in the surveyed area. This detection capability using Mask R-CNN has 95% accuracy.
Figure 12. The results of semantic object detection.
5. Cloud AI Services
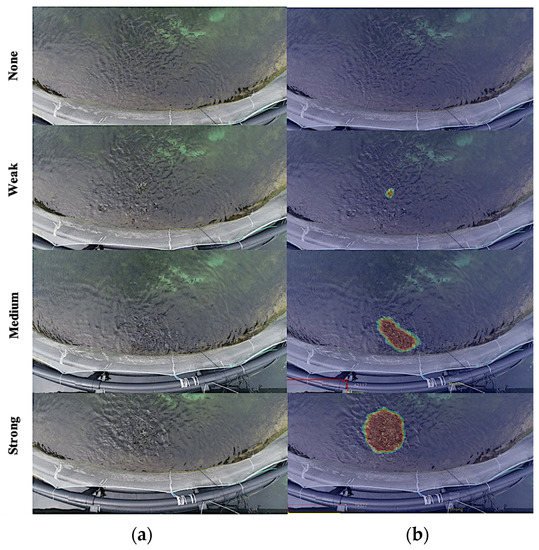
The cloud AI services are where the deep-learning models execute their classification and identification functions. The first AI service is the fish feeding-intensity evaluation, which is responsible for evaluating the satiety level of the fishes in the detected aquaculture cages or tanks. The drone needs to capture the feeding activity and send it to the cloud for evaluation. The feeding intensity has four levels: none, weak, average, and strong. After its evaluation, it sends the result as a form of surveillance report to the user. The information provided by the cloud will help the user decide whether to continue or stop the feeding process. Figure 13 shows the different fish feeding intensities based on videos captured by the drone during its surveillance, where (a) is the raw image and (b) is the processed image, which is the basis for classifying the level of fish feeding intensity. A nonwave image texture shows a “none” feeding intensity and indicates that no significant movement from the fish manifests with zero feeding activity. However, images with larger wave textures show a “strong” feeding intensity that manifests active fish movements during the feeding process.
Figure 13. Fish feeding intensity results using four levels of feeding intensity. (a) original image; (b) processed image.
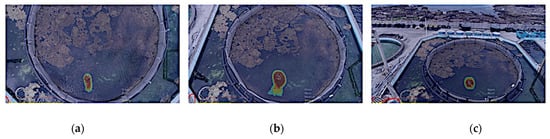
Altitude and camera angle are important considerations when capturing videos during the fish feeding activity. Higher altitude denotes a smaller image size, and a change in camera angle would also make a target object bigger or smaller. To address this, we first collected different images of fish feeding activity using a drone with different heights and viewing angles (Figure 14). Then, we identified the combination in terms of altitude and perspective that yields the highest accuracy rate. The combination of the lowest height (4 m) with the top view (top of the cage) produced the highest accuracy rate for the fish feeding-intensity evaluation.
Figure 14. Different angular perspective of the drone camera capture. (a) View one (top) (b) View two (30 degrees adjustment) (c) View three (50 degrees adjustment).
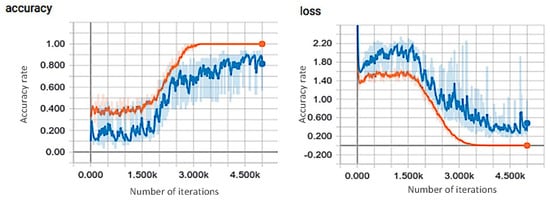
Figure 15 shows the best viewing angle (top view) using 4 m altitude results for the I3D training process for the accuracy evaluation and training loss of the fish feeding-intensity evaluation. The orange line represents the training curve, while the blue line is the validation curve where the training curve converged at 3000 steps. Using the best altitude and camera angle result, we tested the accuracy of our deep-learning model to evaluate fish feeding intensity. In training our deep-learning model, we used the following manually labeled datasets for each fish feeding-intensity level: 90 image sequences for none, 398 image sequences for weak, 373 image sequences for medium, and 401 sequences for strong. Each image sequence contains 80 frames, and 70% of the data set was used for the training data, while the remaining 30% is for the test data.
Figure 15. Training history for top view using 4 m altitude.
Our approach uses I3D [
17], a convolutional neural network for video classification, and our video interpolated optical flow. We also implemented the approach of Zhou et al. [
2] for the fish feeding-intensity evaluation using LeNet [
21]. We used the same dataset and hardware to provide a realistic environment. The CNN architecture using Lenet [
21] has three convolutional layers, two down-sampling layers, and two full-convolutional layers. We compared our accuracy results with that of Zhou et al. [
2], shown in
Table 1. Our proposed approach using I3D and video interpolated optical flow generated the highest accuracy rate of 95%, while the method of Zhou et al. [
2] integrated with our video interpolated optical flow has 80% accuracy. Using I3D and RGB images, our approach has only 80% accuracy, while Zhou et al. [
2] has a lower accuracy of 75%. The results of Zhou et al. [
2] with video interpolated optical flow contributed to a 5% increase in accuracy compared with the RGB results.
Table 1. Comparison of our proposed fish feeding-intensity evaluation with other methods.
Table 2 contains the results for the accuracy, precision, recall and F-score values for each class for the fish feeding intensity, where accuracy has the highest rate at 0.967 and precision the lowest rate at 0.912. The overall performance for the F-score is at 0.923 which is highly acceptable.
Table 2. Accuracy, precision, recall and F-score results for fish feeding-intensity evaluation.
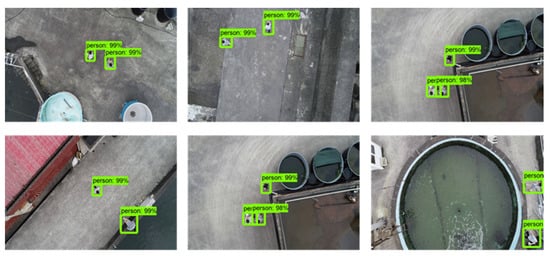
One of the activity recognition features of the aquaculture surveillance system is person detection (
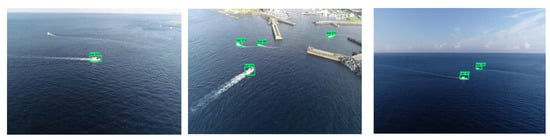
Figure 16), which renders up to 99%. We also provide a label for the detected persons for easier recognition. Detecting ship vessels is also added to the detection of suspicious objects, as shown in
Figure 17. We used our ship vessel dataset to train the MobileNet [
20] deep-learning model for the detection and rendered a 90% accuracy. Person and ship detection is important for aquaculture site monitoring to make sure that only authorized individuals are allowed to enter the site and intruders are monitored for better site safety. It will also keep aquaculture facilities, especially fish cages and ponds, safe from possible sabotage or theft from intruders.
Figure 16. The results of the person detection and recognition.
Figure 17. Fishing boat/ship detection results.
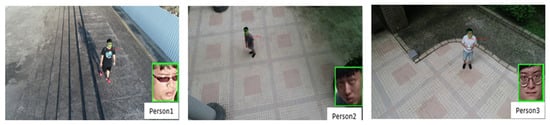
To further confirm whether the identity of a detected person is suspicious or not, the drone will track/follow the person and capture the facial image of that person (
Figure 18). The drone sends the captured image to the scene cloud for face recognition using the FaceNet [
10] deep-learning model; this will determine if the person is authorized or not by comparing the captured image with the information of authorized personnel stored in the cloud database. Once an intruder or unauthorized person is detected, the system sends an alarm to the user through the drone navigation app. We have used three different altitudes (3, 4, and 5 m) to determine the best altitude parameter for drone image capture. Using 4 m as the best altitude, where we have obtained an 87% accuracy detection rate.
Figure 18. Face recognition detection results.
6. Drone as a WIFI Gateway Channel
Communication through wireless technology seems to be very popular for Internet of Things (IoT) devices due to increases in connectivity and coverage. The drone can be optimized for this capability serving as a WIFI gateway for underwater cameras installed in aquaculture ponds and cages, especially in the offshore open-sea area where one needs to take a boat/vessel to reach the site. In the study by Guillen-Perez et al. [
22], they explored the capability of drones to provide WIFI networks. They presented a comprehensive characterization in deploying an aerial WIFI network by integrating a WIFI node that serves as an access point for the connection. We used the same concept of the drone as a WIFI gateway. This method provides better and more reliable communication and increases network connectivity [
22] to monitor aquaculture fish cages and nets.
The drone is equipped with a camera to capture images of the water surfaces to evaluate the intensity of fish feeding. However, it is limited in conducting underwater monitoring due to its distance from the water. A typical monitoring setup for aquaculture farms uses underwater cameras, such as stereo cameras and sonar cameras. Cables connect cameras to a land-based computer system for control. For physical or wired connections, the hubs send the communication signals to the control system. With this setup, there is a problem when collecting underwater video and images for the fish count and fish-length estimation, for example. Since the size of underwater data is large, it will be difficult to send them to the cloud due to the distance of the cage and the on-site land-based control system.
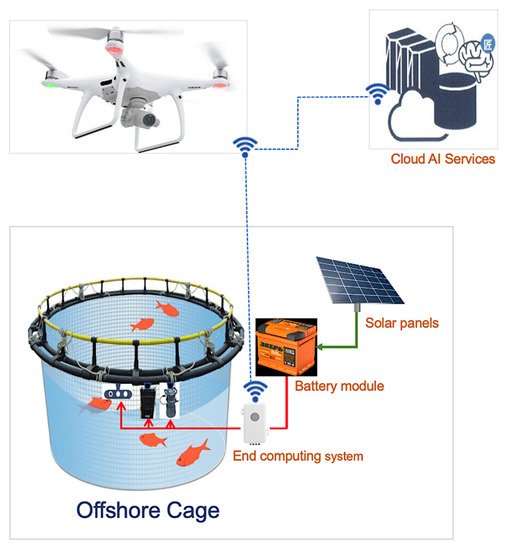
Using the drone as a WIFI gateway eliminates the use of long cables and hubs for connection. Instead, it acts as a communication channel for the underwater cameras and the control system in order to have a reliable connection and improved communication. The architecture for the drone as a WIFI gateway can be seen in Figure 19, which shows the setup of how communication takes place. Equipping underwater cameras with an end-computing system enables wireless communication, which can help eliminate hubs and cables. The drone equipped with a WIFI app serves as an alternative way to communicate outside of the land-based control system, since the drone can directly send the data to the cloud AI service for processing. It is also possible to add sensors such as water-quality monitoring in which the drone can provide a connection to the cloud as a WIFI gateway.
Figure 19. Drone as WIFI communication channel from offshore cages to cloud AI services.
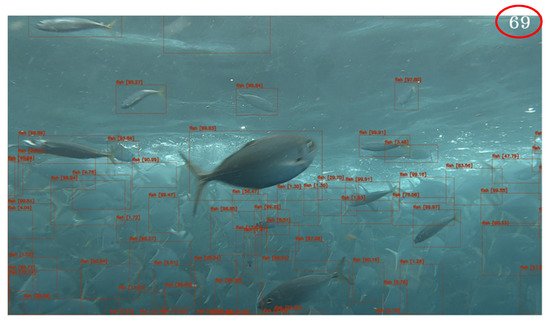
Figure 20 and Figure 21 are the added AI services for aquaculture monitoring using the drone for the WIFI gateway channel. As an illustration of the data transmission using the drones as the WIFI gateway from underwater cameras, the images or videos captured are sent to the cloud using the end-computing system’s WIFI capability. Cloud AI services will perform fish detection using the YOLO4 deep-learning model. The fish detection model can process 20 frames per second. The detected fish with bounding boxes are counted and generate the fish count results.
Figure 20. Fish detection and counting results.
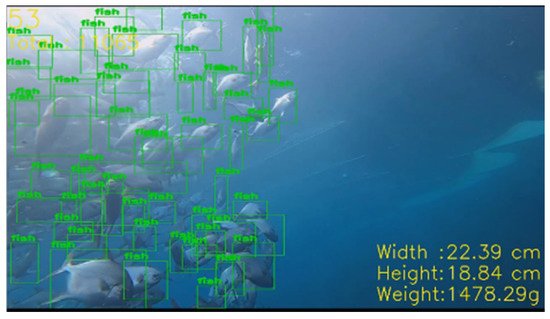
Figure 21. Fish-length and density estimation.
In addition, the estimation of the length of the fish as part of the cloud AI services in Figure 21 shows the estimated size and weight of the fish. The average size in terms of width and height is used to estimate the final fish weight. Body-length estimation has an error rate of less than 5%.
This entry is adapted from the peer-reviewed paper 10.3390/drones5040109