Your browser does not fully support modern features. Please upgrade for a smoother experience.
Please note this is an old version of this entry, which may differ significantly from the current revision.
Subjects:
Neurosciences
The retina is abundant with highly specialized neurons that receive, process, and transduce light signals. It is composed of the monolayered retinal pigment epithelium (RPE) and the multi-layered neural retina, which contains five major types of neurons and is regarded as part of the central nervous system.
- Retinal Diseases
- Metabolomics
1. Background
As can be seen in Figure 1, the neurosensory retina is organized into three layers of cells: the outer nuclear layer (ONL), inner nuclear layer (INL), and ganglion cell layer (GCL); and two layers of nerve fiber or synapse: the outer plexiform layer (OPL) and inner plexiform layer (IPL). Dysfunction in rod, cone, RPE cell, retinal vascular endothelial cell, or other cells (e.g., Müller glia cell) can result in various retinal diseases, with consequential vision loss. Blindness and vision impairment affect a large proportion of the population, having a detrimental impact on quality of life, and constituting a major public health problem. Alongside cataract and uncorrected refractive error, glaucoma and age-related macular degeneration (AMD) have become the leading causes of blindness worldwide for those aged 50 years or over [1]. Although much effort has been devoted to preventing and eliminating avoidable blindness, the population with blindness is expected to reach 61.0 million by 2050 [2]. The prevention and therapy of blindness and vision impairment require a more comprehensive understanding of the pathogenesis underlying retinal diseases. Currently, many new and advanced technologies are being applied to the study of retinal disorders, especially some “omics” technologies. In this article we focus on metabolomics.
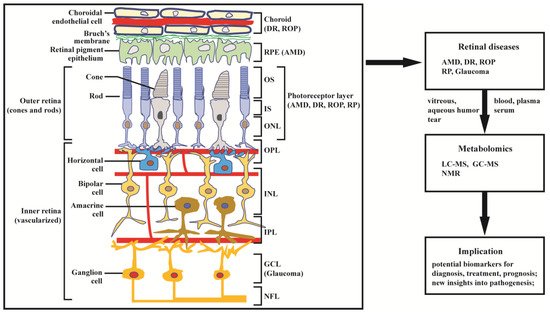
Figure 1. Structure of retina and application of metabolomics to retinal diseases. The retina can be divided into inner retina and outer retina. The inner retina consists of the nerve fiber layer (NFL) ganglion cell layer (GCL), inner plexiform layer (IPL), inner nuclear layer (INL, where amacrine, bipolar, and horizontal cells are localized), and outer plexiform layer (OPL); the outer retina consists of the outer nuclear layer (ONL) of rod and cone photoreceptors, which are compartmentalized as outer segments (OS) and inner segments (IS). The retinal pigment epithelium (RPE) cells and choroid endothelial cells provide nutrition across Bruch’s membrane to support photoreceptor cells. Age-related macular degeneration (AMD) primarily affects the RPE and photoreceptor cells; diabetic retinopathy (DR) and retinopathy of prematurity (ROP) mainly affects choroidal vasculature and the photoreceptors; retinitis pigmentosa (RP) and glaucoma predominantly affect, respectively, the photoreceptors and ganglion cells. Damage in retinal structure can lead to retinal diseases, including AMD, DR, ROP, glaucoma, and RP. The diseases have been extensively studied by metabolomics based on LC-MS, GC-MS, and NMR.
Metabolomics is the most recently developed “omics” in the area of system biology, following genomics, transcriptomics, and proteomics. It uses nuclear magnetic resonance (NMR) or mass spectroscopy for qualitative and quantitative analysis of all small molecules in given samples, with the purpose of discovering and identifying biomarkers. The outcomes of metabolomics studies can be helpful for disease diagnosis, identification of therapeutic targets, and monitoring of disease state, rendering it a powerful tool in medicine and clinical translation. Moreover, metabolomics can provide unique insight into physiological and pathophysiological processes [3]. With expanding applications of metabolomics, research into the metabolic bases of ocular diseases has been increasing [4,5]. This article provides a review of recent findings in metabolomics studies of retinal disease, with a focus on metabolome of clinical samples, and using AMD, diabetic retinopathy (DR), retinitis pigmentosa (RP), retinopathy of prematurity (ROP), and glaucoma as illustrative examples (Figure 1).
Relevant literature was obtained by searching PubMed/MEDLINE database from 1999 to July 2021. The search terms included “retinal disease”, “age-related macular degeneration”, “diabetic retinopathy”, “retinitis pigmentosa”, “retinopathy of prematurity”, “glaucoma”, “metabolomics”, “metabonomics”, and “metabolic profiling”. The above keywords were combined with “OR”/“AND” operators for searching titles and abstracts. The search results were imported into Endnote for management and removal of duplicated literature. A total of 280 abstracts were reviewed and, among these, 110 relevant articles were retrieved for comprehensive evaluation.
2. Metabolomics in Retinal Diseases
It is well known that the retina is one of the most metabolically activity tissues in the body. Metabolic dysfunction can cause a number of retinal diseases, compromising vision to the extent that blindness can occur. Some retinal diseases, like AMD, are asymptomatic at the early stage, which means that diagnosis occurs only when the features of relatively late-stage AMD are present, with associated impairment of vision. Moreover, the pathogeneses underlying retinal diseases are yet to be comprehensively elucidated. Metabolomics is a powerful tool that has great potential for enhancing the understanding of pathological mechanisms and molecular processes, discovering new pathways, and identifying biomarkers for diagnosis and prognosis, thus offering support in personalized ophthalmology. In this section, we review and discuss recent progress in metabolomics investigations of several common retinal disorders, including AMD, DR, RP, ROP, and glaucoma.
2.1. Age-Related Macular Degeneration (AMD)
In developed countries, AMD is the main cause of blindness in people aged 50 years, or above; worldwide, it is the third most common cause [30]. AMD is a class of cone-based degenerative diseases. Initially, dysfunction and progressive degeneration of retinal pigment epithelial (RPE) cells occur; subsequently, gradual cone degeneration in the central retina occurs [31]. At the early stage, AMD has no obvious clinical symptoms. When progression into a more advanced stage occurs, AMD can take two forms, including the dry form (also known as geographic atrophy), characterized by slow and progressive photoreceptor cell degeneration and/or retinal pigment epithelium death, and the wet form, with the distinct feature of aggressive, exudative choroidal neovascularization. Currently, the treatment strategies for advanced AMD are very limited. For the wet form of AMD, antibodies against vascular endothelial growth factor (VEGF) have proven to be an effective therapeutic agent [32,33]. However, there is no treatment for the dry form of AMD [34]. In order to fully understand the pathological mechanisms of AMD and to identify biomarkers or new therapeutic regimens for AMD, the utilization of advanced technologies such as metabolomics is required.
Recently, studies of AMD based on metabolomics have significantly increased and have been summarized by both Kersten et al. [35] and Hou et al. [36]. Here, we expand and summarize metabolomics-based research regarding the association between metabolites and AMD, pathological mechanisms underlying AMD, diagnosis, therapeutic monitoring, and new treatment targets of AMD. Significant changes in metabolite levels have been observed between control subjects and patients at all stages of AMD. These differential metabolites or potential biomarkers and the associated pathways are summarized in Table 1, which mainly include amino acids (alanine, glutamine, histidine, tyrosine, phenylalanine, methionine, arginine, proline), organic acids (formate, acetate, β-hydroxybutyrate), and lipids (glycerophosphocholine, LysoPC (18:2) and PS (18:0/20:4)), as well as related pathways (glycerophospholipids pathway, carnitine shuttle pathway, and glutamine pathway). Laíns et al. [37] compared the urinary metabolic profiles of patients at different stages of AMD and controls, as acquired by 1H NMR technology. The results revealed important metabolite differences between controls and early AMD patients, with more significant differences in metabolic profile found between controls and late AMD subjects. This work highlighted citrate and selected specific amino acids as potential biomarkers for identifying the severity of AMD and also identified geographic differences between Coimbra and Boston cohorts; suggesting that AMD effects might be masked if researchers perform joint analysis of the metabolic profiles of cohorts from different regions. More recently, in order to identify metabolites associated with AMD, Acar et al. [38] performed the largest metabolome association analysis in AMD to date. They identified 60 differential metabolites, including amino acids, citrate, tyrosine, HDL subclasses, and VLDL. Some of the significantly changed metabolites such as citrate are consistent with the results of Lains et al. [37].
To clarify the pathogenesis of AMD, metabolomics has been employed to investigate metabolic alterations in response to risk factors of AMD. RPE cells play an important role in maintaining normal functioning of the neurosensory retina. Chao et al. [39] employed LC-MS/MS combined with 13C tracers to systematically study nutrient consumption and metabolite transport in cultured human fetal RPE. The study reveals that RPE cells prefer proline as a nutrient and that they transport metabolic intermediates to the retinal side. Similarly, Zhang et al. [40] performed a study on RPE cells via LC-MS, GC-MS, and 13C tracer technologies, and established that inhibition of mitochondrial respiration impairs the consumption of nutrients and transportation of metabolites by RPE cells. It has been reported that multiple abnormalities, including oxidative stress damage, cytoplasmic glycogen accumulation, mitochondrial dysfunction and disintegration, and enlarged and annular LAMP-1-positive organelles, can be observed in AMD RPE. Shu’s group [41] have studied the effects of translocator protein (TSPO) deletion on RPE metabolism from an oxidative stress perspective through LC-MS-based metabolomics. The result has shown that TSPO deletion affects glucose, amino acid, and nucleotide metabolism, and elevates fatty acids, glycerophospholipids, and glutathione disulphide (GSSG). To elucidate the mechanisms underlying aforementioned abnormalities, Zhang et al. [42] compared metabolite and lipid profiles of AMD RPE and normal RPE. The study identified significant changes in glycerophospholipid metabolism, lipid and protein metabolisms, glutathione, guanosine, and L-glutamic acid, linked with increased PAPR2 expression, deceased NAD+ and SIRT1, increased PGC-1α acetylation (inactive form), lower AMPK activity, and overactive mTOR pathway. A recent study has shown that RPE cells with constitutively high mTORC1 activity were reprogramed to be hyperactive in glucose and lipid metabolism [43]. This provides evidence that the metabolic changes occur prior to structural changes of RPE and retinal degeneration. For decreasing oxidative stress, bis-allylic deuterated docosahexaenoic acid (DHA, C22:6, n-3) has been developed for alleviating oxidative stress in RPE cells [44]. In addition to dysfunction of RPE cells, degeneration of photoreceptor cells is an important cause of AMD. Recently, several studies have utilized metabolomics technology to reveal the mechanism of AMD induced by degeneration of photoreceptor cells [45,46].
As a result of these mechanistic studies, new and effective diagnostic, intervention, or therapeutic strategies can be proposed. A recent study examining the association of human plasma metabolomics with delayed dark adaptation in AMD has been performed [47]. The results revealed that fatty-acid-related lipids and amino acids related to glutamate and leucine, isoleucine, and valine metabolism were linked with dark adaptation. This association might be beneficial in the early diagnosis of AMD since dark adaptation can be considered as a functional outcome measure for AMD diagnosis. Based on the knowledge of metabolic pathways inferred from the analysis of different metabolites, therapeutic targets can be identified. For example, pyruvate dehydrogenase kinase/lactate axis was identified by metabolomics for treatment of neovascular AMD (nAMD) [48]. It is well-known that some endogenous metabolites have pharmacological activity. Homma et al. [49] found that taurine could rescue mitochondria-related metabolic impairments in a cell model. This effect was demonstrated by metabolomics analysis. Therefore, intervention with taurine may be a new potential therapeutic strategy for mitochondria-related retinal diseases. During the treatment course of disease, metabolomics can also be employed for evaluating therapeutic effects or to predict the response of the given regimen. Gao et al. [50] conducted a serum metabolomics study of patients with nAMD in response to anti-VEGF therapy. They identified reductions in glycerophosphocholine, LysoPC (18:2), and PS (18:0/20:4) as predictors for responsiveness to anti-VEGF therapy for nAMD patients. Additionally, personalized metabolic patterns can be obtained by metabolomics studies. In order to take advantage of this type of information, patients with certain diseases, such as macular neovascular disease [51], can be stratified. As a result, this allows for improvements in the therapeutic effects. Overall, metabolomics has greatly enhanced the understanding of pathogenesis of AMD and has contributed to the development of new therapeutic approaches for AMD.
Table 1. Summary of metabolomics-based clinical studies of AMD.
| AMD Stage | Samples | Metabolic Biomarkers/Pathway | Analytical Platform | Untargeted/TARGETED | Study Design | References |
|---|---|---|---|---|---|---|
| late AMD (wet) | plasma (−) | Phe, Tyr, Gln, Asp, His-Arg, Trp-Phe, GCA, GDCA, GUDCA; tyrosine metabolism, sulfur amino acid metabolism, and amino acids related to urea metabolism pathway | LC-MS | Untargeted | case-control | [52] |
| early, intermediate, and late AMD | plasma (fasting) | acetate, acetoacetate, creatine, dimethyl sulfone, β-hydroxybutyrate, pyruvate, Ala, Gln, His | NMR | Untargeted | cross-sectional | [53] |
| late AMD (wet) | plasma (fasting) | N-acetyl-L-alanine, N1-methyl-2-pyridone-5-carboxamide, Tyr, Phe, Arg, Met, palmitoylcarnitine, isomaltose, hydrocortisone, biliverdin | GC-MS, LC-MS | Untargeted | case-control | [54] |
| early, intermediate, and late AMD | plasma (fasting) | linoleoyl-arachidonoyl-glycerol (18:2/20:4), stearoyl-arachidonoyl-glycerol (18:0/20:4), oleoyl-arachidonoyl-glycerol (18:1/20:4), 1-palmitoyl-2-arachidonoyl-GPC (16:0/20:4n6), 1-stearoyl-2-arachidonoyl-GPC (18:0/20:4), adenosine; diacylglycerol, glycerophospholipids pathway, purine metabolism | LC-MS | Untargeted | cross-sectional | [55] |
| late AMD (wet) | plasma (−) | L-oxalylalbizziine, isopentyl β-D-glucoside, LysoPC(P-18:0), LysoPC(P-18:1(9Z)), LysoPC(16:1(9Z)), 1-Lyso-2-arachidonoyl-phosphatidate, 9-hexadecenoylcarnitine, heptadecanoylcarnitine, 11Z-octadecenylcarnitine, L-palmitoylcarnitine, stearoylcarnitine, N-ornithyl-L-taurine; carnitine shuttle pathway, bile acid biosynthesis pathway | LC-MS | Untargeted | − | [56] |
| early, intermediate, and late AMD | plasma (fasting) | taurine, β-citrylglutamate, serotonin, N-acetylmethionine, Asp, hypotaurine, N-acetylasparagine, S-adenosylhomocysteine, maltotriose, maltose, nicotinamide, adenosine, cytidine, guanine, inosine, hypoxanthine, adenine, isoleucylglycine, 1-stearoyl-2-oleoyl-GPS(18:0/18:1), PE, PC, sphingosine, 1-(1-enyl-palmitoyl)-GPE (P-16:0), 14-HDoHE/17-HDoHE, 12-HETE, sphinganine, 1-(1-enyl-oleoyl)-GPE (P-18:1), 1-(1-enyl-stearoyl)-GPE (P-18:0); glycerophospholipid, purine, taurine and hypotaurine, and nitrogen metabolism | LC-MS | Untargeted | cross-sectional | [57] |
| late AMD (wet) | plasma (fasting) | Val, Lys, Pro, carnitine, valerylcarnitine, carnosine (Ala-His) | LC-MS | Targeted (IDQ p180 kit) | case-control | [58] |
| early, intermediate, and late AMD | plasma, serum (+) | HDL and VLDL lipoprotein particles, fatty acids, citrate, Ala, Ile, Leu, Phe, Tyr | NMR | Untargeted | − | [38] |
| early, intermediate AMD) | serum (non-fasting) | Gln, Glu:Gln ratio, glutaminolysis, phosphatidylcholine diacyl C28:1; glutamine pathway | LC-MS | Targeted (IDQ p180 kit) | case-control | [59] |
| late AMD (wet) | serum (fasting) | lactate, lipoproteins | NMR | Untargeted | − | [48] |
| late AMD (wet) | serum (−) | GPC, LysoPC (18:2), PS (18:0/20:4) | LC-MS | Untargeted | case-control | [50] |
| AMD subtype (PCV) | serum (fasting) | LPA (18:2), LysoPC (20:4), PC (20:1p/19:1), SM (d16:0/22:2), PAF (35:4), PC (16:0/22:5), PC (18:1/20:4); glycerophospholipid metabolism, ether lipid metabolism, glycerolipid metabolism pathway | LC-MS | Untargeted(lipidomic) | − | [60] |
| early, intermediate, and late AMD | urine (fasting) | 4-hydroxyphenylacetate, formate, s-inositol, sucrose, citrate, Val | NMR | Untargeted | cross-sectional | [37] |
| late AMD (wet) | aqueous humor | carnitine, deoxycarnitine, N6-trimethyl-L-lysine, cis-aconitic acid, itaconatic acid, mesaconic acid, Gly, betaine, creatine; carnitine-associated mitochondrial oxidation pathway, carbohydrate metabolism pathway, osmoprotection pathway | LC-MS/MS | Untargeted | case-control | [61] |
Amino acids [Ala: alanine; Arg: arginine; Asp: aspartate; Gln: glutamine; Gly: glycine; His: histidine; Ile: isoleucine; Leu: leucine; Lys: lysine; Met: methionine; Phe: phenylalanine; Pro: proline; Tyr: Tyrosine; Val: valine]. Lipids [GPC: glycerophosphocholine; GPS: glycerophophatidyl-serine; GPE: glycerophosphoryl-ethanolamine; HDL: high-density lipoprotein; HDoHE: hydroxydocosahexaenoic acid; HETE: hydroxyeicosatetraenoic acid; LPA: lysophosphatidic acid; LysoPC: lysophosphatidylcholine; PAF: platelet-activating factor; PC: phosphatidylcholine; PE: phosphatidylethanolamine; PS: phosphatidylserine; SM: sphingomyelin; VLDL: very-low-density lipoprotein]. Cholic acids [GCA: glycocholic acid; GDCA: glycodeoxycholic acid; GUDCA: glycoursodeoxycholic acid]. PCV: polypoidal choroidal vasculopathy. −: not state in the article. +: the study consists of multiple cohorts, samples of several cohorts are collected under fasting, and samples of other cohorts are collected under non-fasting.
2.2. Diabetic Retinopathy (DR)
Diabetes mellitus (DM) and its complications have become a global public health concern. Diabetic retinopathy (DR) is one of the common complications of DM and is characterized by microvascular damage in the retina. DR is one of the main contributory factors of preventable blindness and vision impairment worldwide [1]. With the rising prevalence of DM and increasing life expectancy, the population with DR has also been rising. According to a recent survey [62], the annual incidence of DR and progression could be as high as 12.7% and 12.3%, respectively. It has been reported that dysfunction in multiple cell signaling pathways, inflammation and oxidative stress resulting from hyperglycemia, and dyslipidemia contribute to the pathogenesis of DR [63,64]. DR is classified into two stages: non-proliferative DR (NPDR) and proliferative DR (PDR). From a disease severity perspective, NPDR is further sub-divided into three types: mild, moderate, and severe NPDR [65]. The common clinical manifestations of NPDR include microaneurysms, venous beading, and intraretinal microvascular abnormalities. As the disease evolves, NPDR can develop to PDR. Within 1 year without treatment, the rate of progression to PDR is related to the severity of NPDR, corresponding to 5% (mild), 27% (moderate), and >50% (severe) [66]. Further progression of intraretinal microvascular abnormalities can cause intravascular coagulation, leading to retinal ischemia, and the consequent formation of new, fragile blood vessels within the retina, known as retinal neovascularization. This can trigger some neovascular complications, such as vitreous hemorrhaging as a result of rupture and bleeding of new vessels, or retinal detachment due to blood vessels infiltrating the vitreous [66]. Currently, although the molecular and cellular pathology of DR is understood [64] and some new therapeutic methods—such as anti-VEGF therapy—have been developed, the exact pathological mechanism is still not clear and the treatment options for DR remain far from satisfactory. To date, a number of new technologies have been employed to study DR, including metabolomics. For instance, metabolic signatures (biomarkers) of DR discovered by metabolomics have been described in several reviews [67,68,69,70]. In this subsection, we summarize and discuss the application of metabolomics to DR.
Since 2010, publications involving studies of the metabolome of DR have been rising, particularly so in the most recent two years. The differential metabolites or biomarkers identified over the past 10 years and sample sources in metabolomics research on DR are summarized in Table 2. As shown in Table 2, DR stages are mainly associated with changes in amino acids, lipids, and carbohydrate metabolism. The most frequently used samples for evaluating relevant biomarkers of DR are plasma, serum, and vitreous humor. Rhee et al. [71] performed metabolic profiling of plasma from T2DM patients with and without DR. Their results suggest that plasma glutamine and glutamic acid can be used as potential biomarkers for predicting DR. With a similar design of experimental groups, Zuo et al. [72] conducted a targeted metabolomics study of serum samples from T2DM patients with and without DR. The researchers developed multidimensional network biomarkers containing linoleic acid, nicotinuric acid, ornithine, and phenylacetyl-glutamine (PAG), efficiently allowing for the distinguishing of DR from T2DM. PAG is a product of amino acid fermentation that results from glutamine conjugation of phenylacetic acid, implying an association with glutamate metabolism. However, in this study, glutamine and glutamic acid were not identified as differential metabolites. With respect to vitreous humor, Midena et al. [67] performed a detailed review of aqueous and/or vitreous humor sampling in human eyes from DR patients for proteomic and/or metabolomic analysis. The exact quantification of aqueous and vitreous humor biomarkers can provide valuable insights to retinal diseases and can contribute to precision medicine in ophthalmology. Nevertheless, the availability of vitreous or aqueous humor can be problematic, given the invasive nature of sampling.
In order to investigate the mechanism of DR, Marchetti et al. [73] utilized molecular biotechnology and a metabolomics approach to study ischemic retinopathy. The results demonstrated that differential macrophage polarization could stabilize the ischemia-injured retinal vasculature by modulating the inflammatory response, reducing oxidative stress and apoptosis, and promoting tissue repair. From a lipid–lipid interactions viewpoint, lipids analysis of plasma, renal, neural, and retinal tissues from a diabetic mouse model with microvascular complications was performed [74]. Among the different tissues, shared alterations in diacylglycerol and in lipids containing arachidonic acid were observed, while the highly saturated cholesterol esters were similarly coregulated between plasma and each tissue type. From a protein–metabolite interactions viewpoint, Patrick et al. [75] employed the protein–metabolite interactome to dissect the mechanism of DR. Their results found that diverse phosphorylations (ATP/ADP/AMP ratio vs. Ser/Thr Kinase and Tyr kinase) were positively correlated with DR progression. Recently, a pdx1-/-zebrafish mutant [76] was established as a novel model for studying mechanisms of hyperglycemia-induced retinopathy, with the help of genetic editing and metabolomics technologies. In addition to the mechanistic aspect, metabolomics can also be used to evaluate the efficacy of interventions, such as protective effects of the neuropeptides PACAP, substance P and the somatostatin analogue octreotide in retinal ischemia [77], and the effects of Keluoxin capsules [78] and Bushen Huoxue prescriptions [79] on DR. Through review of relevant publications, we have observed that there is a new trend of acquiring two datasets (discovery set and validation set) in order to identify more reliable biomarkers. A cooperative study of Xu’s group, Jia’s group, and Wu’s group [80] was performed to develop biomarkers related to DR. They identified a panel of biomarkers, including 12-hydroxyeicosatetraenoic acid (12-HETE) and 2-piperidone, which offers better diagnostic performance in differentiating DR from diabetes, compared to hemoglobin A1c (HbA1c). The biomarker panel was also validated in a separate cohort with 444 samples, which is promising for detecting DR and early-stage DR. Validation of biomarker and large-scale samples were the clear advantages of this study. A similar validation strategy has also been implemented in a number of other studies [71,72,81,82,83]. Nevertheless, the identified metabolic signatures in these studies were not consistent, and the evaluation of sample size was not performed, with the exception of Zuo et al.’s study [72]. The discrepancy of biomarkers between these studies might be attributed to different analytical approaches, samples, and metabolome coverage.
Table 2. Summary of metabolomics-based clinical studies of DR.
| DR Stage | Samples | Metabolic Biomarkers/Pathway | Analytical Platform | Untargeted/Targeted | Study Design | References |
|---|---|---|---|---|---|---|
| pre-DR, NPDR, PDR | plasma (−) | pyruvate, Asp, glycerol, cholesterol | GC-MS | Untargeted | − | [84] |
| NPDR | plasma (−) | 2-deoxyribonic acid, 3,4-dihydroxybutyric acid, erythritol, gluconic acid, ribose; pentose phosphate pathway | GC-MS | Untargeted | case-control | [81] |
| NPDR | plasma (−) | 15-oxo-ETE, 4-HDoHE, 11-HEPE, LTB4, PGD2, RvD2, PGD3, PGF2α, 5,6-DiHETE, 8-HDoHE, 5-oxo-ETE, RvD1, 7-HDoHE, 6R-LXA4, 15d-PGJ2, PGJ2, 10-HDoHE, PGE3 | LC-MS/MS | Targeted (eicosanoids) | − | [85] |
| NPDR, PDR | plasma (−) | Glu, Gln, Gln/Glu | GC-MS, LC-MS | Untargeted | − | [71] |
| PDR | plasma (fasting) | fumaric acid, uridine, acetate, cytidine | LC-MS | Untargeted | case-control | [86] |
| NPDR, PDR | plasma (−) | Arg, citrulline, glutamic γ-semialdehyde, dehydroxycarnitine, carnitine | LC-MS | Untargeted | case-control | [87] |
| NPDR, PDR | plasma, serum (−) | 2,4-DHBA, 3,4-DHBA, ribonic acid, ribitol, the triglycerides 50:1 and 50:2 | GC-MS, LC-MS | Untargeted | cross-sectional | [88] |
| NPDR | serum (−) | ribitol, GPC, UDP-Glc-NAc, fructose-6-phosphate | NMR | Untargeted | − | [89] |
| NPDR, PDR | serum (−) | dimethylarginine, Trp, Pro, PC, kynurenine, propionylcarnitine, butyrylcarnitine, hexose | LC-MS | Targeted (IDQ p180 kit) | cross-sectional | [90] |
| NPDR, PDR | serum (fasting) | 12-HETE, 2-piperidone | GC-MS, LC-MS | Untargeted | − | [80] |
| mild DR | Serum (−) | Cer(d18:1/24:0), ChE 20:3, ChE 20:4, ChE 22:6, DG(16:0_18:2), DG(16:1_18:2), DG(18:2_20:4), DG(18:2_22:6), FA(14:0), FA(16:0) | LC-MS | Untargeted (lipidomic) | − | [91] * |
| NPDR, PDR | serum (fasting) | linoleic acid, nicotinamide, ornithine, phenylacetylglutamine | LC-MS | Targeted | case-control | [72] |
| NPDR, PDR | vitreous humor | 5-HETE, CYP-derived epoxyeicosatrienoic acids | LC-MS/MS | Targeted (lipidomic) | − | [92] |
| PDR | vitreous humor | galactitol, ascorbic acid, lactate | NMR | Untargeted | − | [93] |
| PDR | vitreous humor | Arg, Pro, Met, allantoin, citrulline, ornithine, octanoylcarnitine, decanoylcarnitine; arginine, proline, acylcarnitine metabolism pathway | LC-MS/MS | Untargeted | − | [82] |
| PDR | vitreous humor | pyruvate, inosine, hypoxanthine, urate, allantoate, pentose phosphates, xanthine; glucose metabolism, purine metabolism, pentose phosphate pathway | LC-MS | Untargeted | − | [83] |
| PDR | vitreous humor | 5-HETE, 12-HETE, 20-HETE, 20-COOH-AA | LC-MS/MS | Targeted (eicosanoid) | − | [94] |
| PDR | vitreous humour | Pro, pyruvate, lactate, allantoin, creatine, dimethyl glycine, N-acetyl serine, succinate, α-ketoglutarate | LC-MS/MS | Untargeted | cross-sectional | [95] |
| PDR | vitreous, aqueous humor | CysSSH, Cys, GSSSG, cystine | LC-MS/MS | Targeted (polysulfides) | − | [96] |
| PDR | vitreous, aqueous humor | d-2,3-dihydroxypropanoic acid, isocitric acid, fructose 6-phosphate, lactate; pyroglutamic acid, pyruvate; gluconeogenesis, ascorbate-aldarate metabolism, valine–leucine–isoleucine biosynthesis, and arginine–proline metabolism pathway |
GC-MS | Untargeted | − | [97] |
| DR | aqueous humor | His, Thr, Gln, Asn, dimethylamine, lactate, succinate, 2-hydroxybutyrate; alanine, aspartate, and glutamate metabolic pathway | NMR | Untargeted | − | [98] |
Amino acids [Arg: arginine; Asn: asparagine; Asp: aspartic acid; Cys: cysteine; Glu: glutamic acid; Gln: glutamine; His: histidine; Met: methionine; Pro: proline; Thr: threonine; Trp: tryptophan]. Lipids [AA: arachidonic acid; Cer: ceramides; ChE: cholesterol esters; DG: diacylglycerols; ETE: eicosatetraenoic acid; FA: fatty acids; GPC: glycerophosphocholine; HDoHE: hydroxydocosahexaenoic acid; HEPE: hydroxyeicosapentaenoic acid; HETE: hydroxyeicosatetraenoic acid; LTB4: leukotriene B4; LXA4: Lipoxin A4; PC: phosphatidylcholine; PGD: prostaglandin D; PGE: prostaglandin E; PGF: prostaglandin F; PGJ: prostaglandin J]. UDP-Glc-NAc: uridine diphosphate N-acetyl glucosamine; RvD: Resolvin D; DHBA: dihydroxybutyric acid; CysSSH: cysteine persulfides; GSSSG: oxidized glutathione trisulfide. pre-DR: pre-clinical stage of DR; * indicates partial list of differential metabolites. −: not stated in the article.
This entry is adapted from the peer-reviewed paper 10.3390/biology10100944
This entry is offline, you can click here to edit this entry!