AFM imaging of extracellular vesicles: History
Please note this is an old version of this entry, which may differ significantly from the current revision.
Contributor:

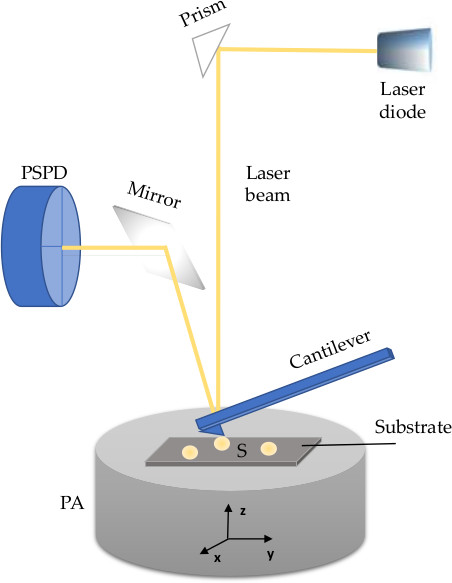
Advanced and optimised microscopy methods, including atomic force microscopy (AFM), are required to visualise and characterise morphology of extracellular vesicles (EVs), a heterogenous groups of nanoparticles regarded as highly promising source of diagnostic, prognostic, and therapeutic tools. EVs are nanosized phospholipid membranous structures ubiquitously found in human biofluids, secreted from almost every cell, and thus reflect both physiological and pathophysiological changes of their parental cells. The lipid membrane of an EV contains proteins (e.g., tetraspanins, receptors and other molecules) and diverse luminal content with bioactive cargo that includes nucleic acids (DNA, mRNA, miRNA and lncRNA), proteins, organelles, or infectious particles.  AFM is a nanoscale tool for the determination of morphology, structure and composition, but also biomechanics and biophysical characteristics of nanometric structures. Briefly, AFM uses a micrometric cantilever with a nanometre-sized tip actuated by piezoelectric crystals. Upon receiving signals of a tip-sample interaction, a position-sensitive photodiode (PSPD) converts it to a voltage and sends it to a piezoelectric actuator (PA). The latter expands and contracts proportionally to the applied voltage to manipulate the sample and the probe position across three dimensions with high precision. The PA can be coupled to a cantilever or positioned under a sample holder. The whole system is controlled by suitable control electronics.

  • extracellular vesicles
  • human biofluids
  • nanotechnology
  • atomic force microscopy
  • electron microscopy
  • morphology

1. AFM modes

A crucial parameter for successful imaging is the selection of the appropriate mode of operation. AFM operates in several modes: contact, tapping (or intermittent contact), non-contact and PeakForce TappingTM (Bruker, Billerica, MA, USA). The results obtained from the different modes are images or force curves [1]. When the surface of the sample is scanned, its topology is recorded from the generated signals on the PSPD (Figure 1). These images can be collected in the contact mode when the tip is in continuous contact with the surface while moving in raster scan lines over a predefined scan size. The force value remains constant since the distance of the cantilever from the surface of the sample is modified for each variation of the surface height via feedback control of the PA. It provides the fastest measurements in comparison with other modes. Yet, the continuously imposed friction can damage the sample due to high lateral forces. For this reason, it is important to optimise the interaction between the tip and the sample to minimise the damage and deformation of soft, biological samples. Therefore, tapping and PeakForce Tapping modes are usually applied where more precise force control with respect to contact mode and non-contact mode is achieved.
Figure 1. Schematic representations of atomic force microscopy (AFM).
In the tapping mode (TM) the tip oscillates across the sample surface modulated according to the sample’s height. At the lowest position of oscillation, it briefly touches the sample, thus protecting the sample from damage. The feedback loop keeps the vibration amplitude constant, and the applied force (2–10 nN) is controlled by the ratio between the amplitude setpoint and the amplitude of free oscillation. Tapping mode AFM can detect the biochemical and mechanical characteristics of the sample, its density and viscosity. The changes in the amplitude and phase of the cantilever oscillations with respect to the excitation signal can be recorded simultaneously with the topographic height.
In the PeakForce Tapping (PFT) mode the tip is used as a few pN force probe controlled by a low driving frequency and amplitude. In addition to lateral movement, the tip is forced to oscillate in the vertical direction. Unlike in TM, the piezo oscillates far below (1–2 kHz) the resonance frequency in z-axis direction. The maximum loading force (called peak force) perpendicular to the surface (indentation) is controlled and the computer tracking is optimised according to the peak force setpoint and the gains. The applied force is below the usually achievable values in TM [2][3][4]. It should be controlled very well for imaging of EVs, as it was observed that the shape of EV changes with the increase of the applied force [2]. While detecting the deflection of the cantilever, indentation curves or unfolding curves of a protein are collected [5]. The detected changes in the oscillation (amplitude, phase, or frequency) are used in feedback to maintain a constant interaction of the probe with the sample. The image is generated by capturing the force/distance curve on each image pixel [4][6]. The PFT mode, besides the topography, gives information about the biomechanical, biomolecular and biophysical characteristics of nanoparticles based on the force curves. The adhesion force, elastic modulus, deformation and dissipation are used for the calculation of quantitative nanomechanical information: adhesion forces, elasticity, stiffness, and deformation. EVs are exposed to different forces when attached to surfaces, during intercellular and extracellular transport, or internalisation and externalisation by cells. The measurements of biomechanical properties, the so-called mechanical fingerprint, can help elucidate these processes without the use of biochemical markers, and also give insight into adhesion-related diseases. Rigidity is one of the important properties that can distinguish different classes of EVs [7][2][8]. The central part of some EVs is softer compared to the rigid membrane and consequently a collapsed cup is formed. This can be avoided by working in very soft amplitude modulation conditions or PFT mode [9]. The membrane rigidity of EVs is generally determined by their size, lipid and protein composition, and the attractive forces on the substrate [3]. Mechanically, most EVs behave like empty liposomes with a fluid bilayer containing significant amounts of membrane-associated proteins [4].
PeakForce QNMTM (Bruker) is an additional mode that visualises the height and the Quantitative Nano Mechanical (QNM) properties of the sample simultaneously. The first part is the PFT mode used as the feedback mode to track and image the sample surface. The QNM part uses PeakForce Tapping mode to produce force curves, from which the quantitative data on the material properties are extracted.
In non-contact mode, the cantilever oscillates at the constant distance in the close proximity above the sample, without touching its surface. As the distance is kept constant, the interaction forces between the tip and sample are in the piconewton (10–12 pN) order of magnitude (very low). By measuring either the changes in the resonant frequency or the changes in the amplitude the final image is obtained. Even though the contact forces are minimized, and the tip and the sample are preserved from the damage, the downsides of this mode are its slower scanning speed and the requirement for an ultra-high vacuum to achieve the best performance (to prevent any liquid adsorption to the tip).
There are several programs available for the postprocessing of AFM images. In particular, Skliar and Chernyshev [10] presented steps in Gwiddyion (Czech Metrology Institute, Brno, Czech Republic) for data analysis of the images of EVs. Besides the height, different parameters and characteristics, e.g., topography, morphology or root-mean-square roughness, can also be extracted.

2. Operating environments of AFM

Unlike EM that operates only in a vacuum and thus affects the surface morphology, AFM can operate at normal conditions and in two environments: air or liquid  [11][3][6][9]. The air environment implies drying a sample in a gentle nitrogen stream, and it has been shown that the EVs analysed in air shrink and develop a characteristic cup shape during this evaporation process due to the central softer area collapsing with respect to the surrounding parts [12]. Conversely, the liquid environment could better reflect the physiological environments in which EVs reside, under physiological conditions (i.e., in a buffer solution) and without the need for coating or any other modifications of the sample [6][13]. This better preserves the spherical shape of the EVs, but it is more complicated for the optimisation of the laser’s position and noise reduction. Hence, the imaging in the air is useful when checking the presence of vesicles and the quality of the sample. However, imaging in liquid is the optimal choice since it preserves EVs properties and reflects their natural state [5][6]. It is challenging to determine the exclusive influence of the environments on the shape of the nanoparticles, it is rather a complex mixture of factors like different forces, the substrate applied for attaching the sample and the sample preparation protocols.

3. Cantilevers and Drives

Generally, each imaging mode will require different cantilevers depending on the measurement mode and whether the imaging is performed in liquid or in air. Usually, the laser power can be tuned to accommodate various drive requirements for operation in air or liquid. The cantilevers are normally mechanically driven by feeding an AC signal to a piezo transducer, but there exists a possibility for a photothermal excitation. This setting enables, in addition to the usual deflection laser beam that focuses onto the cantilever, a second blue laser used for the excitation of the cantilever to trigger its vibration. This is particularly useful for AFM imaging in a liquid. The response of the cantilever using the PA is mechanically driven by the resonances of the AFM. Thus, in the liquid environment, problems arise due to noise formation. However, with photothermal excitation, only the cantilever is excited without influencing other mechanical components in the AFM, and thus a clean response is produced, even in liquids. This method was implemented on the CypherTM family of Asylum Research AFMs (Oxford Instruments, Santa Barbara, CA, USA) and named blueDriveTM photothermal excitation [14].
The resolution of the AFM depends on the size of the probe that is used to scan the surface of interest. To follow nanometric features, tips with an apex with a nanometre-sized radius of curvature are essential [5]. Also, due to the tip convolution, the particles (and other nanometric features) appear wider than they are in reality, which occurs especially when particles are of similar or smaller radii than the tip. To account for this deformation from the AFM tip in TM, deconvolution methods must be applied to calculate the actual size of the EVs, even at low forces [7]. Sebaihi et al. [15] found that for the erythrocyte-derived EVs the convolution tip effect was about 19% on the lateral measurement. The recommendation is to select tip probes of around 1 nm size for the measurements of EVs.
EVs are extremely soft, so cantilevers from silicon or silicon nitride are mainly used [4]. Low forces should be applied (the force depends on the spring constant of the cantilever), such that the EVs are minimally perturbed. Also, short interaction between the sample and the tip should be used to reduce the drift of the sample or the cup shape formation. It has been shown that an EV flattens as the force increases above 2 nN and ruptures after 5 nN [7][2]. In the case of most commonly used TM, softer cantilevers with a spring constant value lower than 0.5 Nm−1 are employed. For PFT cantilevers with resonant frequencies ranging between 66 and 89 kHz, spring constants ranging between 1.4 and 3.5 Nm−1 at a rate of 0.1–1 Hz have been used for EVs imaging [16][17][18][9][15].
AFM tip is applied also for single protein [19] and single EV investigations [2]. The single EV resolution is obtained by an antibody-coated tip and the forces perpendicular to the surface of the sample are measured as a result of the protein-antibody interactions [20][21].

4. Sample Preparation for AFM Imaging

Generally for imaging, the sample is applied onto a different flat substrate with surface roughness under 0.5 nm, which enables distinguishing the EVs from the imperfections of the surface or impurities [9]. Before attachment onto the substrate, EVs should be fixed with aldehydes (2–4% of PFA–paraformaldehyde or GA-glutaraldehyde) that stabilise the nucleic acid-protein interactions and free amino groups by a cross-linking effect, which preserves the EV structure. The materials frequently used as substrates for AFM applications are mica, glass coverslip, Si-wafer and stainless steel, or other metals. EVs are deposited on: (i) free surface, (ii) functionalised surface with a coating that binds unspecifically and (iii) antibody-coated surface for specific binding. Consequently, the EVs are adhered because of physical adsorption, electrostatic interactions, chemical bonds or hydrophobic interactions [7][3].
The mica that is freshly exfoliated to obtain a new flat layer has a residual negative charge, which makes the electrostatic interaction between the surface and the EVs sufficient to keep them attached to the surface. This applies to the imaging in the air when a washing procedure and drying under a nitrogen stream are performed. For imaging in a liquid environment, the attachment time should be prolonged, though [9].
For application on a glass coverslip, Si-wafer, stainless steel or other metals it is necessary to clean the surface of the substrate (e.g., by applying the so-called RCA standard clean, developed by Werner Kern in 1965 while working for Radio Corporation of America) [22] and create a residual charge on it, and also to enhance the binding of EVs for the substrate, e.g., by applying oxygen plasma treatment. There are also several non-specific coating solutions used for the same purpose: NiCl2, poly-L-lysine, GA, amine groups, peptides or aptamers [1][10][6][23][24].
EVs are negatively charged, so they bind strongly to the positively charged surfaces, such as poly-L-lysine, but not well to the negatively charged surfaces, such as unmodified mica. However, the strong adhesion of an EV to a positively charged substrate causes its structural deformation in height leading to a flattened/flat and oblate shape, so that the height/diameter ratio is much less than 1. By contrast, EVs adsorbed to mica exhibit more or less roundly shaped morphology, even though, depending on the force applied with AFM tip, it is possible that some EVs, based on their intrinsic properties (stiffness, internal structure), also exhibit some irregular morphologies, including convex, planar or concave (cup-shaped). Nevertheless, the stiffer EVs remain almost completely spherical [25].
The glass is generally selected if good optical properties are required, such as for the combined study of AFM imaging and light microscopy [9], microchip platform investigations [26], or the platform for single EV measurements combining fluorescence microscopy and AFM [24]. Gajos et al. [27] used silicon wafers with native oxidized silicon layers (SiOx) for attaching EVs generated from activated platelets and human platelet-poor plasma while Beekman et al. [16] used oxygen-treated stainless steel for multimodal analysis. There are some other examples like utilisation of 3-aminopropyltrietoxysilane (APTES), for obtaining smooth surface (named as AP-mica), also aminopropyl silatrane (APS) to yield an APS-mica surface [28] or 3-aminopropyltrimethoxysilane (APTMS) [4]. Ito et al. [3] used as-cleaned SiO2/Si, (APTES)-modified SiO2/Si, and as-cleaned TiO2 (as-cleaned refers to ultrasonically cleaned, placed consecutively in acetone, methanol, de-ionized water and dried in nitrogen) for attaching EVs from different cancer cell lines.
There are also different antibodies specifically used for functionalisation/coating of the surface, namely targeting membrane proteins that will capture EVs with specific epitope. The application of the antibody-coating to the surface is challenging and should include controls of the surface roughness and the presence of impurities. Hardij et al. [6] applied ethanolamine and glutaraldehyde to attach the antibody onto the substrate. Functionalisation of the surface is necessary in cases when EVs need to withstand the imaging forces (e.g., PFT), but has its pros and cons. A strong affinity of a soft vesicle for the surface can cause irreversible deformation while a weak affinity of a stiff vesicle may not be enough to retain EVs on the surface. As a result, only the specific subpopulation is imaged.
There are several antibodies applied for EVs capture. Gandham et al. [29] coated mica surface with anti-CD41 for attaching platelet-derived EVs and Sebaihi et al. [15] used anti-CD235a-modified mica for erythrocyte-derived EVs. Anti-CD142 coated mica was used to capture EVs derived from MDA-MB-231 cell line [6], anti-CD41 coated mica for EVs from platelet-poor plasma [30], anti-PAC-1-coated silicon for platelet-derived microvesicles [27]. Beekman et al. [16] used anti-EpCAM (epithelial cell adhesion molecules) to target tumour-derived EVs on stainless steel substrates previously functionalised with a monolayer of carboxydecyl phosphonic acid (CDPA) and investigated them by different methods, including SEM, AFM and Raman.

5. Aplication of AFM in Characterization of EVs from Human Biofluids
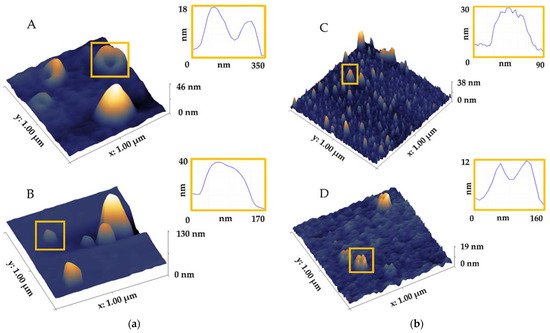
The application of AFM to investigate EVs from biofluids is still scarce. Most research has been performed on cell lines in vitro with ultracentrifugation (UC) as the method for isolation of EVs due to the high volume of supernatant. However, discrimination of EVs from all nanoparticles in highly complex samples like blood or plasma is challenging. EVs are outnumbered by non-EV particles (liposomes and globular proteins) that are in the same size range, which obscures and impedes the analysis of EVs. In recent years, the application of microscopy for characterisation of structure, morphology, size distribution, density, mechanical and biophysical properties of EVs, as well as their structural organisation in biofluids has advanced considerably. AFM is used for investigations of EVs in various biofluids, such as saliva, blood, plasma and serum, cerebrospinal fluid and others summarised in Table 1. Different terminology is used for describing different shapes or some morphology aspects, e.g., spherical, hemispherical, cup, ellipsoidal and flat, which creates ambiguity. It is difficult to perform a downstream analysis when these factors are not thoroughly evaluated on a single EV level [4].
Table 1. Morphological and structural characteristics of the EVs from the human biofluids as obtained by atomic force microscopy.
Method Biofluid Shape Structure/Morphology/Topography Size (nm) References
AFM
air
saliva ring-like
irregular vs. round
circular
with central indentation
trilobed membrane
individual vs. aggregated
heterogeneous vs. homogeneous
aggregated vs. single
bulging
agglomerates
less dense periphery/more dense core
larger vesicles without dense core
clusters
50–70
around 100
>100
40–80
20–400
[2][18][31]
urine round individual vesicles, no aggregation / [32]
blood spheroidal
near-spherical
cup-shape
increased stiffness
irreversible deformation
~30 high/~90 wide
23.7 high/71.3 lateral
3.16 high/31.2 lateral
60–100
[6][15][25]
AFM
liquid
saliva ring-like with central indentation
trilobed membrane
50–70around 100 [2]
  blood spheroidal
spherical
cup-shape
disc-like
various structures
soft inner cavity
stiffer membrane
softer vs. stiffer
~30 high/~90 wide
~25 high
50–140
6.26 high/70.55 lateral
4.16 high/16.3 lateral
[4][15][25][33][34]
The most investigated is saliva because of its availability. AFM was applied for the investigation of 2D and 3D topographic images and molecular features of EVs [18]. Pooled samples of saliva from healthy individuals were isolated by two methods: ExoQuick and UC. TM AFM imaging in air conditions revealed larger (>100 nm), heterogeneous, irregularly shaped, aggregated EVs after isolation by ExoQuick, in contrast to the homogeneous, single, round-shaped EVs that were isolated by UC. The structure and biomechanical properties were investigated for UC isolated saliva exosomes from healthy individuals at the single vesicle level [2]. TM height images in air conditions with forces below 1 nN revealed round 50–70 nm EVs. The amplitude images with applied forces around 2 nN showed EVs with similar morphology, an average diameter around 100 nm and an indent in the centre pointing to mechanical deformation by the tip. The phase images with 2 nN forces also revealed a 3D trilobed structure and substructures in the centre of the EVs with different contrast (possible from different constituents, namely lipids, proteins, nucleic acids). If high forces were applied, structural deformation and disintegration followed. The importance of the implementation of immuno-based detection methods lies in distinguishing EVs from other structures like globular proteins. It involves functionalisation of the flat surface that EVs are attached to or tip functionalisation. Sharma et al. [2] detected a single-molecule of transmembrane protein CD63 on the surface of saliva EVs imaged under phosphate buffer (PBS) in TM via targeted force spectroscopy with an antibody-coated tip and antibody-labelled gold beads. This principle enables the detection of specific membrane markers for specific diseases (e.g., oral cancer) on the membrane of EVs from biofluids after mass spectrometry detection of the target protein in subpopulations of EVs. Topographic images have been applied to compare the UC-isolated exosomes from the saliva of healthy individuals with the saliva of oral cancer patients [31]. Using TM AFM in the air, the normal exosomes exhibited circular, homogeneous, bulging structure and diameter of 40–80 nm, with a distinct phase contrast between the less dense vesicle periphery and the more dense core region. On the other hand, cancer exosomes were bigger with broader distribution of 20–400 nm and manifested irregular morphologies, aggregation and clustering. Also, the larger EVs appeared hollow without the dense core region seen in the normal EVs. Furthermore, cancer exosomes indicated a possible increased surface CD63 density [31].
Urinary EVs have been found to own great potential applications in disease diagnosis, therapy and disease molecular mechanism. The urine is rich in Tamm-Horsfall protein (around 92 kDa) and other biological components. Yang et al. [32] isolated EVs by dialysing urine in 300 kDa dialysis tubes in PBS solution, and then the dialysis suspension was concentrated by using 100 kDa ultracentrifuge tubes. Samples were analysed by AFM in TM on freshly cleaved mica in air conditions and showed a round structure with no aggregation or disruption.
The erythrocyte-derived EVs, isolated by UC were imaged by TM AFM on anti-CD235a-modified mica [15]. Glycophorin A (CD235a), uniquely expressed on the erythrocyte membrane was chemically attached to mica. EVs examined under buffer in liquid and in air conditions showed similar morphology in both media, spheroidal shape, around 30 nm high and 90 nm wide. Rikkert et al. [33] investigated blood-derived EVs on a poly-L-lysine coverslip by AFM in PBS environment with PFT mode using minimal imaging force. Their topography and mechanical properties were obtained from the force-indentation curves. The particles were 25 nm high with a spherical shape. The authors pointed out that AFM imaging alone is not enough for distinguishing between EVs and lipoproteins. Therefore, an isolation protocol combining gradient- and size-based approaches is necessary to ensure the presence of only EVs [33]. Blood samples of 96 patients were investigated for the monitoring of fingerprint for CNS tumours (glioblastoma multiforme, benign meningioma and single brain metastasis originating from non-small-cell lung cancer) carried by small EVs [34]. EVs were isolated by UC and the presence of small EVs was confirmed by AFM in TM, in PBS solution. Their size range spanned from 50 to 140 nm and they appeared as various structures. The force spectroscopy measurements of EVs are still scarcely studied. Bairamukov et al. [25] found a correlation between the biomechanical properties of the EVs, their size, structure, and function. They used PeakForce QNM in air and liquid for measurements of exosomes and exomeres isolated by UC from blood plasma. This AFM mode, as mentioned earlier, acquires high-resolution (HR) AFM images with force spectroscopy measurements at the same time. The measurements of the biomechanical properties revealed a soft internal cavity that was referred to as a disk-like shape, a stiffer membrane for exosome in the liquid and near-spherical shape in the air. By contrast, exomeres had similar heights in the air and the liquid environments [25]. EVs are considered promising biomarkers for thrombotic risk. AFM imaging of EVs from platelet-free plasma on tissue factor (TF) coated mica revealed only a few vesicles, with a size range of 60–100 nm [6]. Biomechanical investigations are important for the detection of a difference between normal and cancerous EVs. Vorselen et al. [4] compared EVs from healthy individuals with the ones from the patients with hereditary spherocytosis (HS) by measuring their biomechanical properties in PFT mode, in PBS. Blood-derived EVs, which were isolated by UC and adhered to poly-L-lysine on APTMS coated glass slides, appeared as spherical structures with a mean radius of 71 nm. Furthermore, HS patient-derived EVs were significantly softened in comparison with the healthy donor-derived EVs, and their protein composition was altered.
The first-ever 3D images of nanoparticles in native cerebrospinal fluid (CSF) are presented in Figure 2, on mica in the air (A) and in the liquid (C), showing two distinct structures: round and cup shape. These structures can also be visible in Figure 1(B), representing EVs isolated by size-exclusion chromatography (SEC) on mica in the air with possible convolution artefacts or PBS crystals (used as mobile phase during EV separation by SEC) and on a glass coverslip in the liquid, RCA cleaned and activated with oxygen plasma (D). For exploring the impact of different parameters on the shape and morphology of EVs, additional effort should be invested in assessing the influence of the single factors, e.g., isolation method, or settings in the AFM imaging, prior to downstream analysis.
Figure 2. Tapping mode of AFM in the air (a) and liquid (b) environments for imaging of native cerebrospinal fluid (A,C) and EVs isolated by size-exclusion chromatography (B,D) with selected profiles of EV-like structures. (A,B): sample fixed with PFA, on mica, analysed using MFP-3D (Asylium Research) with OMCL/TR400PSA-HW (Olympus) probe; (C): sample on mica, analysed using Dimension Icon (Bruker) with ScanAsyst (Bruker) probe; (D): sample on a glass coverslip, RCA cleaned and activated with oxygen plasma, analysed using Nanowizard II (JPK Instruments) with MLCT (Bruker Nano) probe, with photothermal excitation.
 

This entry is adapted from the peer-reviewed paper 10.3390/biomedicines9060603

References

  1. Sharma, S.; LeClaire, M.; Gimzewski, J.K. Ascent of Atomic Force Microscopy as a Nanoanalytical Tool for Exosomes and Other Extracellular Vesicles. Nanotechnology 2018, 29, 132001.
  2. Sharma, S.; Rasool, H.I.; Palanisamy, V.; Mathisen, C.; Schmidt, M.; Wong, D.T.; Gimzewski, J.K. Structural-Mechanical Characterization of Nanoparticle Exosomes in Human Saliva, Using Correlative AFM, FESEM, and Force Spectroscopy. ACS Nano 2010, 4, 1921–1926.
  3. Ito, K.; Ogawa, Y.; Yokota, K.; Matsumura, S.; Minamisawa, T.; Suga, K.; Shiba, K.; Kimura, Y.; Hirano-Iwata, A.; Takamura, Y.; et al. Host Cell Prediction of Exosomes Using Morphological Features on Solid Surfaces Analyzed by Machine Learning. J. Phys. Chem. B 2018, 122, 6224–6235.
  4. Vorselen, D.; van Dommelen, S.M.; Sorkin, R.; Piontek, M.C.; Schiller, J.; Döpp, S.T.; Kooijmans, S.A.A.; van Oirschot, B.A.; Versluijs, B.A.; Bierings, M.B.; et al. The Fluid Membrane Determines Mechanics of Erythrocyte Extracellular Vesicles and Is Softened in Hereditary Spherocytosis. Nat. Commun. 2018, 9, 4960.
  5. Galvanetto, N. Practical Applications of Atomic Force Microscopy in Biomedicine. STE Med. 2020, 1, e15.
  6. Hardij, J.; Cecchet, F.; Berquand, A.; Gheldof, D.; Chatelain, C.; Mullier, F.; Chatelain, B.; Dogné, J.-M. Characterisation of Tissue Factor-Bearing Extracellular Vesicles with AFM: Comparison of Air-Tapping-Mode AFM and Liquid Peak Force AFM. J. Extracell. Vesicles 2013, 2, 21045.
  7. LeClaire, M.; Gimzewski, J.; Sharma, S. A Review of the Biomechanical Properties of Single Extracellular Vesicles. Nano Select 2021, 2, 1–15.
  8. Nguyen, T.D.; Gu, Y. Investigation of Cell-Substrate Adhesion Properties of Living Chondrocyte by Measuring Adhesive Shear Force and Detachment Using AFM and Inverse FEA. Sci. Rep. 2016, 6, 38059.
  9. Parisse, P.; Rago, I.; Ulloa Severino, L.; Perissinotto, F.; Ambrosetti, E.; Paoletti, P.; Ricci, M.; Beltrami, A.P.; Cesselli, D.; Casalis, L. Atomic Force Microscopy Analysis of Extracellular Vesicles. Eur. Biophys. J. 2017, 46, 813–820.
  10. Skliar, M.; Chernyshev, V.S. Imaging of Extracellular Vesicles by Atomic Force Microscopy. J. Vis. Exp. 2019, e59254.
  11. Aliofkhazraei, M.; Ali, N. 7.09—AFM Applications in Micro/Nanostructured Coatings. In Comprehensive Materials Processing; Hashmi, S., Batalha, G.F., Van Tyne, C.J., Yilbas, B., Eds.; Elsevier: Oxford, UK, 2014; pp. 191–241. ISBN 978-0-08-096533-8.
  12. Chernyshev, V.S.; Rachamadugu, R.; Tseng, Y.H.; Belnap, D.M.; Jia, Y.; Branch, K.J.; Butterfield, A.E.; Pease, L.F.; Bernard, P.S.; Skliar, M. Size and Shape Characterization of Hydrated and Desiccated Exosomes. Anal. Bioanal. Chem. 2015, 407, 3285–3301.
  13. Dufrêne, Y.F.; Ando, T.; Garcia, R.; Alsteens, D.; Martinez-Martin, D.; Engel, A.; Gerber, C.; Müller, D.J. Imaging Modes of Atomic Force Microscopy for Application in Molecular and Cell Biology. Nat. Nanotechnol. 2017, 12, 295–307.
  14. Labuda, A.; Hohlbauch, S.; Kocun, M.; Limpoco, F.T.; Kirchhofer, N.; Ohler, B.; Hurley, D. Tapping Mode AFM Imaging in Liquids with BlueDrive Photothermal Excitation. Micros. Today 2018, 26, 12–17.
  15. Sebaihi, N.; De Boeck, B.; Yuana, Y.; Nieuwland, R.; Pétry, J. Dimensional Characterization of Extracellular Vesicles Using Atomic Force Microscopy. Meas. Sci. Technol. 2017, 28, 034006.
  16. Beekman, P.; Enciso-Martinez, A.; Rho, H.S.; Pujari, S.P.; Lenferink, A.; Zuilhof, H.; Terstappen, L.W.M.M.; Otto, C.; Le Gac, S. Immuno-Capture of Extracellular Vesicles for Individual Multi-Modal Characterization Using AFM, SEM and Raman Spectroscopy. Lab Chip 2019, 19, 2526–2536.
  17. Sharma, S.; LeClaire, M.; Wohlschlegel, J.; Gimzewski, J. Impact of Isolation Methods on the Biophysical Heterogeneity of Single Extracellular Vesicles. Sci. Rep. 2020, 10, 13327.
  18. Zlotogorski-Hurvitz, A.; Dayan, D.; Chaushu, G.; Korvala, J.; Salo, T.; Sormunen, R.; Vered, M. Human Saliva-Derived Exosomes: Comparing Methods of Isolation. J. Histochem. Cytochem. 2015, 63, 181–189.
  19. Garcia, P.S.; Brum, D.G.; Oliveira, O.N.; Higa, A.M.; Ierich, J.C.M.; de Moraes, A.S.; Shimizu, F.M.; Okuda-Shinagawa, N.M.; Peroni, L.A.; da Gama, P.D.; et al. Nanoimmunosensor Based on Atomic Force Spectroscopy to Detect Anti-Myelin Basic Protein Related to Early-Stage Multiple Sclerosis. Ultramicroscopy 2020, 211, 112946.
  20. Chuo, S.T.-Y.; Chien, J.C.-Y.; Lai, C.P.-K. Imaging Extracellular Vesicles: Current and Emerging Methods. J. Biomed. Sci. 2018, 25, 91.
  21. Müller, D.J.; Dufrêne, Y.F. Atomic Force Microscopy: A Nanoscopic Window on the Cell Surface. Trends. Cell Biol. 2011, 21, 461–469.
  22. Brachmann, E.; Seifert, M.; Oswald, S.; Menzel, S.B.; Gemming, T. Evaluation of Surface Cleaning Procedures for CTGS Substrates for SAW Technology with XPS. Materials 2017, 10, 1373.
  23. Royo, F.; Gil-Carton, D.; Gonzalez, E.; Mleczko, J.; Palomo, L.; Perez-Cormenzana, M.; Mayo, R.; Alonso, C.; Falcon-Perez, J.M. Differences in the Metabolite Composition and Mechanical Properties of Extracellular Vesicles Secreted by Hepatic Cellular Models. J. Extracell. Vesicles 2019, 8, 1575678.
  24. Cavallaro, S.; Pevere, F.; Stridfeldt, F.; Görgens, A.; Paba, C.; Sahu, S.S.; Mamand, D.R.; Gupta, D.; Andaloussi, S.E.; Linnros, J.; et al. Multiparametric Profiling of Single Nanoscale Extracellular Vesicles by Combined Atomic Force and Fluorescence Microscopy: Correlation and Heterogeneity in Their Molecular and Biophysical Features. Small 2021, 17, 2008155.
  25. Bairamukov, V.; Bukatin, A.; Landa, S.; Burdakov, V.; Shtam, T.; Chelnokova, I.; Fedorova, N.; Filatov, M.; Starodubtseva, M. Biomechanical Properties of Blood Plasma Extracellular Vesicles Revealed by Atomic Force Microscopy. Biology 2020, 10, 4.
  26. Ji, Y.; Qi, D.; Li, L.; Su, H.; Li, X.; Luo, Y.; Sun, B.; Zhang, F.; Lin, B.; Liu, T.; et al. Multiplexed Profiling of Single-Cell Extracellular Vesicles Secretion. Proc. Natl. Acad. Sci. USA 2019, 116, 5979–5984.
  27. Gajos, K.; Kamińska, A.; Awsiuk, K.; Bajor, A.; Gruszczyński, K.; Pawlak, A.; Żądło, A.; Kowalik, A.; Budkowski, A.; Stępień, E. Immobilization and Detection of Platelet-Derived Extracellular Vesicles on Functionalized Silicon Substrate: Cytometric and Spectrometric Approach. Anal. Bioanal. Chem. 2017, 409, 1109–1119.
  28. Dagur, R.S.; Liao, K.; Sil, S.; Niu, F.; Sun, Z.; Lyubchenko, Y.L.; Peeples, E.S.; Hu, G.; Buch, S. Neuronal-Derived Extracellular Vesicles Are Enriched in the Brain and Serum of HIV-1 Transgenic Rats. J. Extracell. Vesicles 2020, 9, 1703249.
  29. Gandham, S.; Su, X.; Wood, J.; Nocera, A.L.; Alli, S.C.; Milane, L.; Zimmerman, A.; Amiji, M.; Ivanov, A.R. Technologies and Standardization in Research on Extracellular Vesicles. Trends Biotechnol. 2020, 38, 1066–1098.
  30. Ashcroft, B.A.; de Sonneville, J.; Yuana, Y.; Osanto, S.; Bertina, R.; Kuil, M.E.; Oosterkamp, T.H. Determination of the Size Distribution of Blood Microparticles Directly in Plasma Using Atomic Force Microscopy and Microfluidics. Biomed. Microdevices. 2012, 14, 641–649.
  31. Sharma, S.; Gillespie, B.M.; Palanisamy, V.; Gimzewski, J.K. Quantitative Nanostructural and Single-Molecule Force Spectroscopy Biomolecular Analysis of Human-Saliva-Derived Exosomes. Langmuir 2011, 27, 14394–14400.
  32. Yang, M.; Zhi, X.; Liu, Y.; Li, T.; Alfranca, G.; Xia, F.; Li, C.; Song, J.; Cui, D. High-Purified Isolation and Proteomic Analysis of Urinary Exosomes from Healthy Persons. Nano Biomed. Eng. 2017, 9, 221–227.
  33. Rikkert, L.G.; Beekman, P.; Caro, J.; Coumans, F.A.W.; Enciso-Martinez, A.; Jenster, G.; Le Gac, S.; Lee, W.; van Leeuwen, T.G.; Loozen, G.B.; et al. Cancer-ID: Toward Identification of Cancer by Tumor-Derived Extracellular Vesicles in Blood. Front. Oncol. 2020, 10, 608.
  34. Dobra, G.; Bukva, M.; Szabo, Z.; Bruszel, B.; Harmati, M.; Gyukity-Sebestyen, E.; Jenei, A.; Szucs, M.; Horvath, P.; Biro, T.; et al. Small Extracellular Vesicles Isolated from Serum May Serve as Signal-Enhancers for the Monitoring of CNS Tumors. Int. J. Mol. Sci. 2020, 21, 5359.
More
This entry is offline, you can click here to edit this entry!