Fluoroquinolones are medically broad-spectrum antimicrobials that interfere in bacterial replications by targeting DNA gyrase (topoisomerase II) and topoisomerase IV. Some of the fluoroquinolone drugs, such as danofloxacin and enrofloxacin are mainly used as prophylaxis and metaphylaxis on beef farms in the US. Danofloxacin is a synthetic fluoroquinolone used to treat and control bovine respiratory disease associated with Mannhemia haemolytica and Pasteurella multocida in beef cattle. It is injected subcutaneously at dose of 8 mg/kg body weight once or 6 mg/kg body weight repeated in 48 hours. Danofloxacin is secreted from the blood into the intestinal lumen using different mechanisms, the phenomenon that exposes gut microbiota to its detrimental effects. Similar to orally administered antibiotics, danofloxacin infiltration into the intestine can disrupt gut microbial integrity and select resistance strains. In general, danofloxacin can potentially cause the emergence of antibiotic resistance, transfer of resistance genes between the members of the gut microbial community, contamination of the environment through the shedding of resistance strains and genes with manure, and eventually reaching human pathogens through the food-chain. This study aimed at investigating the collateral effects of danofloxacin administered subcutaneously to young calves on their fecal microbial diversity, resistome (total resistance genes in a sample) profiles and the relative abundance of Campylobacter.
1. Introduction
The rise in the incidence of antimicrobial resistance has become the intractable challenge of public health in the 21st century [
1]. Use of antimicrobials in the agricultural sector, especially in the livestock industries, has been identified as a contributor toward the acceleration of the selection and spread of antimicrobial-resistant bacterial strains. This makes livestock farms a potential source of resistant strains and antimicrobial resistance genes (ARGs) [
2,
3,
4]. Gut microbiota is considered an additional “organ” for animals because of its beneficial effects on the physiology, metabolism, immunology, digestion, and nutrient uptake of the host [
5,
6]. However, it can also harbor ARGs, which may spread to humans through the food chain or environmental contamination [
1,
4,
7,
8]. This situation demands a clear understanding of the variables involved in the emergence and maintenance of antimicrobial-resistant bacterial strains and genes in livestock farms and a “One Health” approach to curb their spread to environments and humans.
Fluoroquinolone drugs, such as danofloxacin and enrofloxacin, are frequently used to prevent and control the Bovine Respiratory Disease (BRD) complex in U.S. cattle populations [
9,
10,
11]. BRD is the most significant disease of young cattle in North America. Furthermore, it accounts for 70% to 80% of all feedlot morbidity and 40% to 50% of all mortality in the U.S. feedlots [
11]. In 2011, a feedlot survey conducted by the National Animal Health Monitoring System (NAHMS) estimated 16.2% of cattle placed in feedlots showed signs of respiratory disease at some point during their stay on feedlots. Most of these animals (87.5%) were treated with antibiotics, of which 99.0% of the treated calves were injected with antibiotics [
12]. Metaphylaxis, mass medication to reduce the incidence of a disease in a group of animals, has also been a well-documented, widely practiced strategy to decrease morbidity and mortality associated with BRD in high-risk cattle [
11]. A survey conducted on feedlots by NAHMS in 2011 estimated that 21.3% of all animals entering the feedlot underwent metaphylaxis [
12]. BRD is a significant health problem for dairy cattle as well. In 2007, NAHMS surveyed dairies in 17 states and estimated that 12.4% of pre-weaned heifer calves had been diagnosed with respiratory disease, and 5.5% were administered antibiotics [
13,
14]. BRD incidence has demonstrated seasonal variations and is typically increased in the fall season, which often coincides with the shipping of calves from their farm/ranch origin to the feedlot as well as inclement weather [
15]. The Food and Drug Administration (FDA) reports that sales and distribution of fluoroquinolones as well as other medically important drugs have increased in recent years [
16]. Fluoroquinolones, used for the control of BRD and individual animal treatment, accounted for 1.8% of the total regimens of antimicrobial drugs used in 22 U.S. beef feedyards in the years 2016 and 2017, which was moderately high compared to some other antimicrobials used for the same purposes (ranging from 0.11% (sulfonamide) to 9.9% (macrolide)) [
17].
Ciprofloxacin, a fluoroquinolone antibiotic with the same principal agent as that of animal formulations, is commonly used to treat various human infections, including gastroenteritis caused by
Campylobacter infection [
18,
19]. The increased incidence of ciprofloxacin resistance among foodborne pathogens has become a serious threat to public health, which has led to the first removal of fluoroquinolones from use on poultry farms in the U.S. in 2005 [
20]. Despite the withdrawal, the trend of fluoroquinolone resistance in
Campylobacter species has continued to increase in the last two decades (
https://www.cdc.gov/DrugResistance/Biggest-Threats.html#cam, accessed on 14 August 2020). It has been suggested that the rise in ciprofloxacin resistance in
Campylobacter in humans may, at least in part, be associated with use of danofloxacin and enrofloxacin in other livestock [
21,
22]. Beyond inducing antibiotic resistance in specific bacterial pathogens, these antibiotics exert selection pressure on gut microbiota that may lead to its alteration and enhance the spread of ARGs within bacterial communities [
23,
24,
25].
Perturbation of gut microbiota following exposure to antibiotics has been a well-recorded phenomenon in monogastric animals, including humans [
26,
27,
28,
29,
30,
31]. However, only limited information is available in cattle, and the available data demonstrate inconsistent results and conclusions among studies. In one study, intramuscularly administered penicillin modified the structure of fecal microbiota in calves [
32]. Conversely, another group of researchers reported only minor alterations in community structure and the absence of changes in fecal microbial diversity in steers that received single and multiple doses of enrofloxacin subcutaneously [
33]. In agreement with the 2018 study, comparisons of the fecal microbiota of calves with and without a history of antimicrobial exposure on beef farms were not different [
34]. However,
E. coli, used as an indicator organism for the impacts of antibiotics on gut bacteria, showed transient resistance (i.e., a temporary increase in minimum inhibitory concentration) [
33], and increased resistance to multiple unrelated antimicrobial agents [
32]. In general, the inconsistency among the studies could partly be attributed to differences in their study designs and methods as well as the inherent complexity within the gut microbiota [
35].
2. Results of 16S rRNA Gene Analysis
The total number of reads in our samples was 10,999,180, with an average of 52,377 reads per sample (SD 12,721, range 5179–124,738, and median 51,698 reads per sample). A total of 6628 bacterial Operational Taxonomic Units (OTUs) were identified in 210 samples, which were classified into 298 genera (mean = 91 genera, SD = 7, and range = 68–116 per sample), 35 classes (mean = 23 classes, SD = 2, and range = 16–28 per sample), and 19 phyla (mean = 13 phyla, SD = 1, and range = 9–17). A random subsample of 11,500 reads per sample was used to normalize sequence numbers for the computation of alpha and beta diversity metrics; one sample with 5179 reads was excluded from the analyses due to insufficient depth.
2.1. Bacterial Phyla by Sampling Days
The relative abundances of phyla detected in this study were compared by the sampling days (
Supplementary Materials Table S1). Phyla with the highest relative abundance in the first sampling day, two days after the calves arrived at the animal study facility, included
Firmicutes (relative abundance = 51.93%),
Bacteroidetes (36.13%),
Proteobacteria (3.00%),
Tenericutes (2.18%),
Spirochaetes (1.94%),
Actinobacteria (1.33%), and
Verrucomicrobia (1.03%). The relative abundances of the phyla varied over the subsequent sampling days during the four weeks of the study period; however,
Firmicutes and
Bacteroidetes remained dominant phyla throughout that time.
2.2. Alpha Diversities
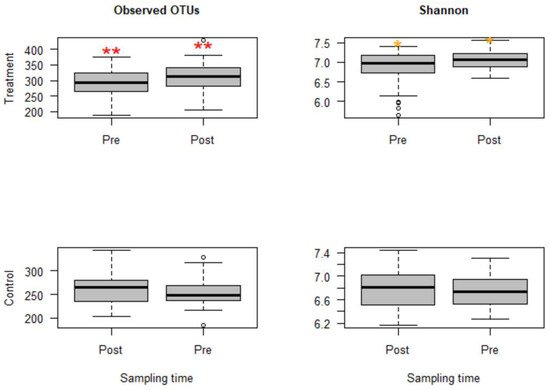
The sequencing depth was evaluated using alpha rarefaction curves (figures not shown); for all considered alpha diversity metrics, the sequencing depth was sufficient to reveal rare microbes in the samples. Calves in group C that were challenged with Mannheimia haemolytica exhibited mild to moderate signs of BRD. However, microbial compositions and diversities were not significantly different from group B, the group that was not challenged with M. haemolytica but injected with danofloxacin subcutaneously. Thus, these two groups that received danofloxacin were collapsed together into one group, named the treatment group, for the comparison of microbial evenness and richness before and after the treatment. Based on the analyses, observed OTUs measuring the microbiota richness showed a significant change between pre- and post-treatment samples (p < 0.05). Similarly, microbiota evenness measured by the Shannon index was different between pre- and post-treatment samples (p < 0.05, Figure 1). Strikingly, both microbial richness and evenness significantly increased following danofloxacin administration, as shown in Figure 1.
Figure 1. Boxplots for alpha diversity metrics comparing pre- and post-treatment samples in the treatment group (top) and control group (bottom). The treatment group received a single subcutaneous injection of danofloxacin. Asterisks show significant differences (* p < 0.05, ** p < 0.01) between pre- and post-treatment microbial communities for the respective group. Note: the control group was divided into pre- and post-treatment to compare with the treatment group in a temporal manner; otherwise, the calves in the control group did not receive any antibiotic. The observed OTUs and Shannon index do not have units, but they measure microbial richness and evenness based on OTU counts and abundance.
Since the fecal samples were collected from the study calves over 28 days, there was an anticipation that the fecal microbiota would change over time because the calves were around two months old at the beginning of the study, the age at which microbial diversity and structure alter fast. Thus, linear mixed-effects models were run using QIIME2 to discriminate between microbial changes attributed to age from those due to danofloxacin exposure. Accordingly, the effect of time was not significant for either measure in the control group. In contrast, the time had a marginally significant influence (observed OTUs, p = 0.064 and Shannon, p = 0.091) in the treatment group, indicating the influence of danofloxacin on the microbial compositions and diversities was more prominent than the impact of the time in this study.
2.3. Beta Diversities
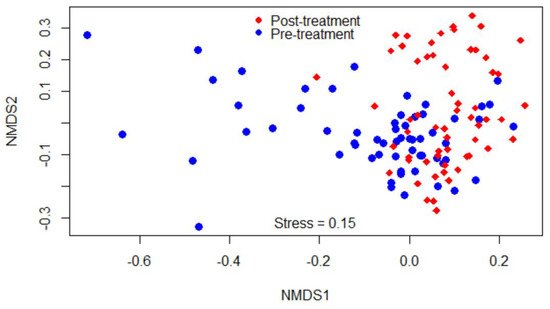
Beta-diversity was measured by the Bray–Curtis dissimilarity index, which can be visualized in the NMDS plot displayed in Figure 2. Gut microbiota shifted after the treatment, as shown in the figure by a clustering difference between pre- and post-treatment microbial communities, and the community structures were significantly different (p < 0.05).
Figure 2. Non-metric multidimensional scaling (NMDS) of the Bray-Curtis dissimilarity index showing clustering difference between pre- and post-treatment microbial communities, blue and red dots, respectively.
2.4. Comparisons of Compositions of Bacterial Classes among Study Calf Groups
The relative abundances of bacterial taxa were compared among the calf groups using the Kruskal–Wallis and pairwise Dunn tests (
Table S2). For many of the bacterial classes, a significant difference (
p < 0.05) was observed between the control group (Group A) and the treatment groups (Group B or C, or both). For instance,
Methanobacteria, Thermoplasmata, Betaproteobacteria, Epsilonproteobacteria, and
Mollicutes significantly increased in the treatment groups, whereas
Bacilli, Planctomycetia, and
Synergistia decreased. Some bacterial classes, such as
Bacteroidia, Cyanobacteria-4C0d-2, and
Clostridia did not show significant changes. Comparisons between the treatment groups, which were BRD-induced Group C against non-BRD-induced Group B, had shown significant differences for certain bacterial classes such as
Actinobacteria, Planctomycetia, Betaproteobacteria, and
Tenericutes- RF3.
2.5. Comparisons of Relative Abundance of Bacterial Genera between Pre- and Post-Treatment Communities
After the classification of the reads at a minimum of 97% similarity into OTUs using QIIME 1.9, a total of 4770 OTUs were obtained. Two hundred and sixty-five of the OTUs in the treatment group increased, and 211 of them decreased after danofloxacin injection at FDR p ≤ 0.01 (379 and 319 at FDR p ≤ 0.05, respectively). Furthermore, the relative abundance of genera in pre- and post-treatment samples were compared using the Wilcoxon signed-rank test and Boruta algorithm/random forest models. Out of 228 genera with relative abundance ≥ 0.01%, 66 of them had significantly shifted after the treatment as indicated by the Wilcoxon signed-rank test (p < 0.05, Table 1) and 57 genera after the p-value was adjusted by FDR (p < 0.05). These genera fell into 12 phyla, with 31 of them in Firmicutes, 13 in Proteobacteria, 8 in Bacteroidetes, 3 in Actinobacteria, 3 in Spirochaetes, 2 in Elusimicrobia, and the rest in the other six phyla.
Table 1. Comparisons of the relative abundance of bacterial genera between fecal samples collected before and after danofloxacin injection in the treatment group by the Wilcoxon signed-rank test. Only significantly altered genera were shown in the table.
| Genus |
Relative Abundance (%) |
p |
Genus |
Relative Abundance (%) |
p |
| Pre |
Post |
Pre |
Post |
| Succinivibrio |
0.38 |
0.05 |
0.000 |
Erysipelotrichales_RFN20 |
0.04 |
0.03 |
0.000 |
| Streptophyta_5-7N15 |
4.12 |
8.31 |
0.000 |
Desulfovibrio |
0.51 |
0.27 |
0.000 |
| Enterobacteriaceae_unclassified |
0.08 |
0.01 |
0.000 |
Elusimicrobiaceae_unclassified |
0.12 |
0.04 |
0.000 |
| Peptococcaceae_unclassified |
0.13 |
0.25 |
0.000 |
Bacteroidaceae_unclassified |
1.53 |
2.54 |
0.000 |
| Alphaproteobacteria_unclassified |
0.38 |
0.14 |
0.000 |
Synergistes |
0.03 |
0.01 |
0.000 |
| Eubacterium |
0.13 |
0.03 |
0.000 |
Methanosphaera |
0.35 |
0.22 |
0.001 |
| Coprobacillus |
0.01 |
0.00 |
0.000 |
Sutterella |
0.61 |
0.24 |
0.001 |
| Erysipelotrichales_p-75-a5 |
0.10 |
0.00 |
0.000 |
Pseudoramibacter |
0.05 |
0.02 |
0.001 |
| Prevotella |
2.29 |
0.93 |
0.000 |
Rikenellaceae_unclassified |
5.57 |
3.44 |
0.003 |
| Blautia |
0.27 |
0.05 |
0.000 |
Epulopiscium |
0.04 |
0.08 |
0.004 |
| [Paraprevotellaceae]_unclassified |
0.04 |
0.00 |
0.000 |
Treponema |
1.98 |
1.45 |
0.005 |
| Faecalibacterium |
0.15 |
0.00 |
0.000 |
Clostridiales_unclassified |
9.72 |
8.65 |
0.005 |
| Phascolarctobacterium |
0.51 |
0.36 |
0.000 |
[Barnesiellaceae]_unclassified |
0.19 |
0.32 |
0.008 |
| Anaerovibrio |
0.10 |
0.03 |
0.000 |
Bifidobacterium |
0.37 |
0.12 |
0.013 |
| Mogibacteriaceae_unclassified |
0.69 |
0.50 |
0.000 |
Desulfovibrionaceae_unclassified |
0.20 |
0.28 |
0.014 |
| Butyrivibrio |
0.09 |
0.16 |
0.000 |
Akkermansia |
2.94 |
4.72 |
0.018 |
| Cyanobacteria_unclassified |
1.16 |
0.75 |
0.000 |
Elusimicrobium |
0.22 |
0.29 |
0.022 |
| Veillonellaceae_unclassified |
0.18 |
0.13 |
0.000 |
Peptostreptococcaceae_unclassified |
1.61 |
2.33 |
0.023 |
| Ruminococcaceae_unclassified |
27.17 |
31.87 |
0.000 |
Bacteroides |
1.83 |
0.23 |
0.042 |
| Pirellulaceae_unclassified |
0.05 |
0.14 |
0.000 |
Ruminobacter |
0.01 |
0.02 |
0.046 |
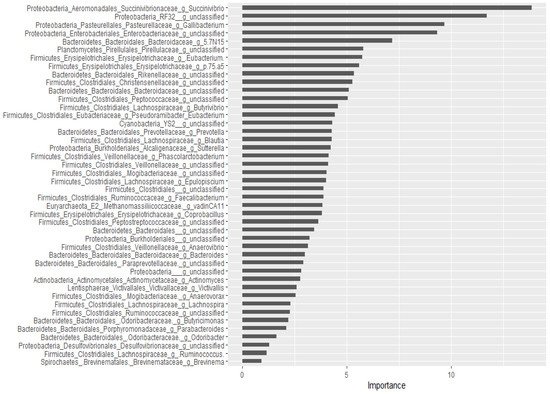
For the classification of the microbial communities into pre- and post-treatment, out of 298 genera, 44 of them were confirmed as important attributes by the Boruta algorithm, meaning the treatment affected the proportions of these genera significantly. The feeding of these important genera to the random forest model resulted in an out of bag error of 2.06%, accuracy for the training sub-data of 100% (95% CI: 96.27–100 %), and an accuracy rate for the test sub-data of 100% (95% CI: 91.59–100 %). These 44 genera, classifying the microbial communities into pre- and post-treatment communities, were ranked by the random forest model based on their importance, as depicted in Figure 3. Four Proteobacteria genera (Succinivibrio, RF32_g_unclassified, Gallibacterium, Enterobacteriaceae_g_unclassified) and Bacteriaodetes_g_5.7N15 were the most important. Interestingly, 37 genera were identified as having a significant association with or predictors of pre/post-treatment status by both the Wilcoxon signed-rank test and the Boruta/random forest method.
Figure 3. Bacterial genera that classify pre- and post-treatment communities based on the Boruta important variable selection algorithm and ranking by the random forest model. The length of the horizontal bars corresponds to its predictive importance.
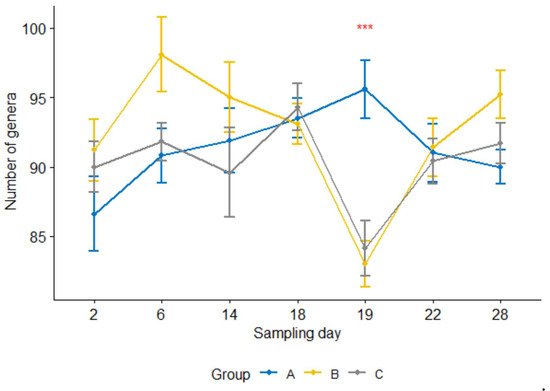
Furthermore, the number of genera per sample 24 h after the treatment was significantly lower (p < 0.05) in the treatment group than in the control group (Figure 4). For groups B and C, the counts were significantly reduced at 24 h after the treatment compared with one day earlier sampling or four or seven days after the treatment (i.e., sampling days 19 vs. 18, 19 vs. 22, 19 vs. 28, p < 0.05; day 18 was the treatment day). In contrast, none of them were significant in the control group.
Figure 4. Number of genera per sample for three calf groups by sampling time point. Genus count at sampling Day 19 were significantly lower in both treatment groups B and C than in the control group A. C. jejuni cocktail, M. haemolytica, and danofloxacin were administered on Days 4, 10 and 18, respectively. *** p = 0.001.
3. The Compositions of Campylobacter
3.1. Comparison by Sampling Days
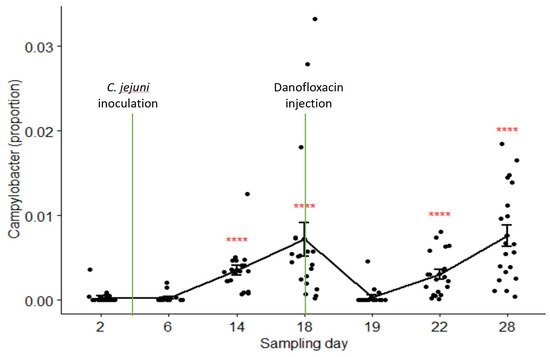
The relative abundances of Campylobacter in samples collected on Day 2 through Day 28 were 0.03%, 0.03%, 0.35%, 0.72%, 0.04%, 0.31%, and 0.76% in the pooled data of the combined treatment groups (groups C and B), respectively. Its composition on Day 19 (24 h after danofloxacin administration) was significantly lower than the composition on Day 18, as well as than those on the last two sampling days. Figure 5 depicts the proportions of Campylobacter in the samples collected at seven sampling times compared by the Kruskal–Wallis non-parametric and its post hoc tests. Campylobacter level dropped sharply and significantly 24 h after the treatment; however, it returned to the pre-treatment baseline after three days (i.e., no significant difference between the proportions on Day 18 and Day 22, p > 0.05). In contrast, the proportions of Campylobacter did not show significant variations among sampling days except for a slight rise in the last sampling day in the control group (results not shown).
Figure 5. Comparisons of the relative abundance of Campylobacter in samples collected from the calves in the combined treatment groups (B and C) by sampling days. Danofloxacin was injected on Day 18 right after fecal sample collection. **** relative abundance of Campylobacter on Day 19 was significantly different from those on the sampling Day 14, Day 18, Day 22, and Day 28. The abundance rates were significantly different from each other on sampling Day 22 and Day 28 (p = 0.000).
3.2. Correlation with Other Genera
The relative abundance of
Campylobacter was compared with other genera using the Spearman rank correlation test (
Tables S3 and S4). Twenty-one genera had a significant correlation with
Campylobacter in the pooled data (all groups combined), of which ten of them had a negative correlation. Seven of the eight
Bacteroidetes genera that significantly correlated with
Campylobacter had negative correlation coefficients. In contrast, most of the genera in
Firmicutes and
Proteobacteria had a positive association with the relative abundance of
Campylobacter.
On the other hand, pre- and post-treatment data were separately analyzed to assess if the treatment had an effect on the pattern of correlation between Campylobacter and other genera. Seven and eleven genera in pre- and post-treatment samples had a significant correlation with Campylobacter, respectively. Interestingly, pre- and post-treatment samples shared only one genus in common that had a significant association with Campylobacter, which was an unclassified genus in the family of Desulfovibrionaceae. This result suggests that danofloxacin exposure altered the correlation pattern between bacterial taxa.
3.3. Prediction of Important Genera by Random Forests
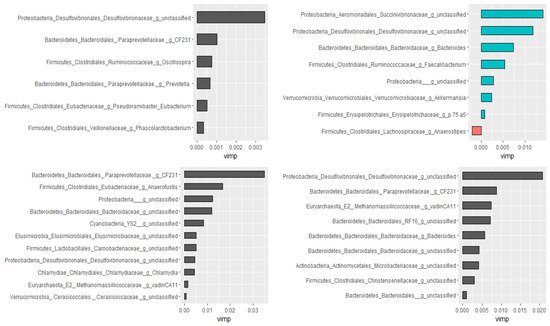
Using the Boruta algorithm, out of 298 genera, nine of them were confirmed as important attributes in the combined data of all groups. Based on the random forest model, these nine genera explained 46.01% of the variability in the relative abundance of Campylobacter with a very low mean squared error (i.e., 0.059), indicating the best model fitness. Except for two, these genera had significant Spearman rank correlation coefficients as well. Furthermore, genera ranked as very important by the random forest model had the highest Spearman correlation coefficients. Additional analyses were performed by dividing data as pre-treatment, post-treatment, and control to check if the treatment would have changed the association patterns between genera. In agreement with the Spearman rank correlation test, there was a difference between pre- and post-treatment samples in both the types and numbers of genera correlated with the compositions of Campylobacter in the fecal samples. Figure 6 presents genera that predict the relative abundance of Campylobacter in the total, the pre- and post-treatment, and the control samples separately.
Figure 6. Genera associated with the relative abundance of Campylobacter selected by the Boruta algorithm and ranked by the random forest models. Control (top left), pre-treatment (top right), post-treatment (bottom left), and all data (bottom right). The length of the bar is proportional to the predictive importance of the genera; vimp—variable importance.
This entry is adapted from the peer-reviewed paper 10.3390/microorganisms9102023