Your browser does not fully support modern features. Please upgrade for a smoother experience.
Please note this is an old version of this entry, which may differ significantly from the current revision.
Subjects:
Plant Sciences
Metallothionein (MT) proteins are low molecular mass, cysteine-rich, and metal-binding proteins that play an important role in maintaining metal homeostasis and stress response. However, the evolutionary relationships and functional differentiation of MT in the Oryza genus remain unclear.
- Oryza sativa
- metallothionein (MT)
- phylogenetic analysis
- promoter activity
- expression analysis
1. Introduction
Metallothioneins (MTs) are a family of low molecular mass (4–8 kD), cysteine (Cys)-rich proteins that bind metals via thiol groups of cysteine (Cys) residues [1]. MT genes are widespread in prokaryotes, plants, and animals [2]. MTs have a strong affinity for both essential (zinc, copper, selenium) and xenobiotic (cadmium, lead, mercury) metals, binding them through specific Cys-Cys and Cys-Xxx-Cys motifs [3,4,5]. As a result, MTs have various biological functions, including protective effects, resisting metal toxicity, controlling oxidative stress, and regulating physiological homeostasis [6,7,8].
So far, there is increasing evidence that various abiotic stresses can regulate MT gene expression; for example, drought, abscisic acid, salt, environment temperature, and reactive oxygen species [9,10,11,12]. This shows the importance of plant MTs genes in response to abiotic stress. For example, an MT-2 gene (MT2) was upregulated in boron-stressed tomato plants, implying that it may protect against boron stress [13]. In Chloris virgata Swartz (C. virgata), ChlMT1 expression was induced by several abiotic stresses, such as salts (NaCl and NaHCO3), ROS inducer (paraquat), and metals (CuSO4, Z nSO4, and CdCl2). Interestingly, alien ChlMT1 overexpression could significantly improve the tolerance of yeasts to reactive oxygen species and salinity [14]. Similarly, the ectopic expression of OsMT1e-P can increase tolerance toward multiple abiotic stresses in transgenic tobacco; also, transgenic plants could survive and produce viable seeds under salt stress [15].
In many higher plant species, MT genes have been reported to be expressed specifically in different tissues. For example, the expression level of OsMT genes in mature rice plants is extremely high in stems relative to leaf blades, leaf sheaths, endosperm, and roots [16]. METALLOTHIONEIN2b (OsMT2b) is preferentially expressed in immature rice panicles, the scutellum of germinating embryos, and the primordium of lateral roots [2]. In cucumbers, CsMT genes exhibit different tissue expression patterns [17].
Although some MT genes have been characterized in rice [18], Arabidopsis [19], cucumbers [17], tomatoes [20], and soybeans [21], systematic and thorough studies are lacking in plants, especially in the Gramineae species. Most of the MT family remains unclear to date, limiting the depth of understanding of the evolutionary patterns of MTs in Gramineae. Therefore, it would be of important to study their evolution systematically and the possible physiological role of the MT gene family in Gramineae.
2. Identification and Structural Characterization of the MT Genes in the Oryza Genus
The hidden Markov model searching for proteins containing a metallothionein domain (Pfam accession no. PF01439) was downloaded from Pfam (http://pfam.xfam.org/) [22]. There were 9, 9, 12, 7, 7, and 9 MT members identified in O. sativa ssp.japonica, O. rufipogon, O. sativa ssp. indica, O. nivara, O. glumaepatula, and O. barthii, respectively. These genes are mainly dispersed across nine chromosomes, with a bias to Chr 12, where more than half of the genes are located on this chromosome (Supplementary Table S1). The 53 MT genes can be classified into four subfamilies according to the sequence identity. In detail, Chr1, Chr3, and Chr11 had six, six, and five genes, respectively, whereas two genes were found on Chr2, Chr5, and Chr8, and three genes on Chr10 (Supplementary Figure S1). Interestingly, the genes on Chr2, Chr8, and Chr12 were grouped into group 1; the Chr1, Chr5, and Chr10 MT genes belonged to group 2; the MT genes on Chr11 belonged to group 3; and the MT genes on Chr3 belonged to group 4 (Figure 1 and Supplementary Table S1). This characteristic is consistent with the classification of MT genes, reflecting the strict conservation of MT genes among the six Oryza species/subspecies.
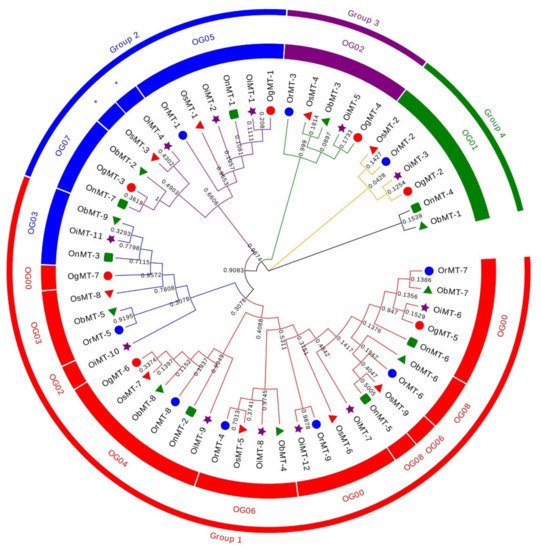
Figure 1. Phylogenetic tree of MT genes based on protein sequences from six Oryza species/subspecies. ClustalW is used for multiple sequence alignment. MEGA v.7.0 is adopted for phylogenetic reconstruction using the neighbor-joining (NJ) clustering method. Bootstrap numbers (1000 replicates) are shown. Different color of circles represents different subfamilies. Different-shaped markers indicate the different species. The numbers inside the red circles represent the different orthogroups (OGs). * means unassigned proteins.
The phylogenetic tree of MT genes based on protein sequences from six Oryza species/subspecies is shown in Figure 2A. Furthermore, the MT gene’s structure was characterized in order to acquire more viewpoints into the structural diversity of MT genes in the Oryza species (Figure 2C). Results indicated that the intron number of MT genes in six Oryza species/subspecies ranged from 1 to 8, and the exon number ranged from 2 to 6. A total of 31 MT genes (58.5%) had three exons, followed by the 16 (30.2%), 4 (7.5%), 1 (1.9%), and 1 (1.9%) gene, possessing two, four, five, and six exons, respectively. Further, 20 conserved motifs were identified from the 53 MT proteins using the MEME [23] (Supplementary Table S2), and all 53 MT proteins showed a similar motif arrangement (Figure 2B). Notably, we found that MTs from the same group showed variations in the number and length of exons/introns, suggesting the functional diversification of the MT genes in the same group.
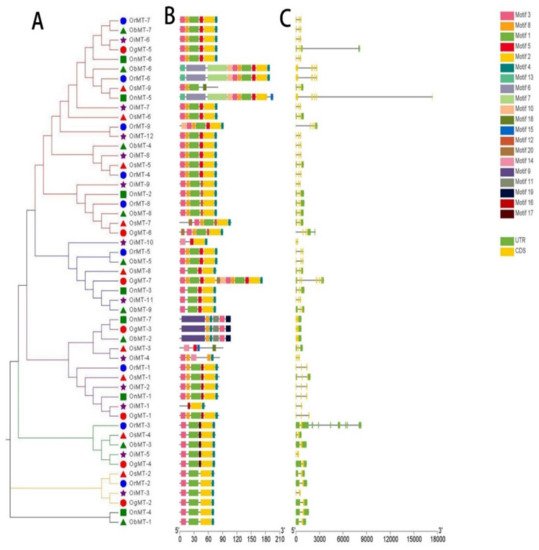
Figure 2. The phylogenetic tree (A), motif composition (B), and exon/intron structure (C) of the MT genes in six Oryza species/subspecies. (A) Sequence alignments and the NJ-phylogenetic trees were made using ClustalW and MEGA v.7.0, respectively. A bootstrap number (1000 replicates) is adopted; (B,C) the widths of the gray bars represent the relative lengths of genes and proteins. The green boxes and gray lines display exons and introns, respectively.
3. Chromosomal Distribution, and Evolutionary Characters
The chromosome location results showed that MT genes show an unbalanced distribution pattern, where no MT genes were mapped on Chr4, Chr6, Chr7, and Chr9 (Figure 3 and Supplementary Figure S1). Furthermore, we discovered five pairs of segmental duplication events and ten pairs of tandem duplication events in the six Oryza species/subspecies (Table 1 and Figure 3). Interestingly, segmental duplication events were detected in all species/subspecies except Oryza nivara (Figure 3); moreover, nine pairs of tandem duplication clusters were observed on chromosome 12, reflecting that gene duplication may be the major cause for the expansion of the MT family in the Oryza species. The segmental duplication events of these six gene pairs were estimated to occur between 7.65 and 10.32 Mya (Table 1).
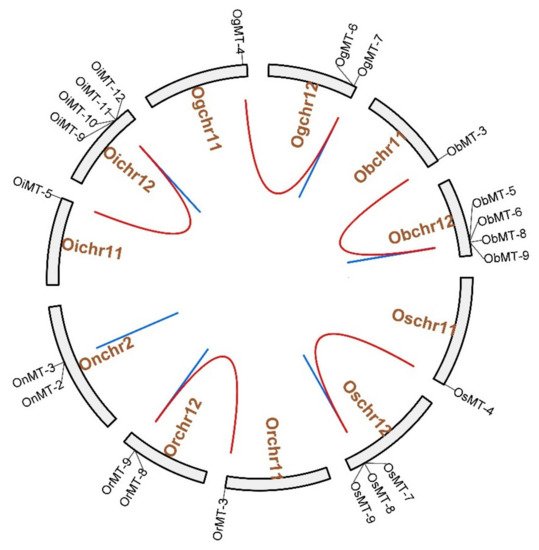
Figure 3. The chromosome location and duplication events of MT genes in six species/subspecies. Os represents Oryza sativa ssp. japonica. Or represents Oryza rufipogon. On represents Oryza nivara. Oi represents Oryza sativa ssp. indica. Og represents Oryza glumaepatula. Ob represents Oryza barthii. The location of each MT gene is marked with a gray line using Circos software. The whole-genome duplication (WGD) or segmental duplication/tandem duplication gene pairs are linked by red/blue lines.
Table 1. Ka, Ks, and Ka/Ks values for duplicated gene pairs in rice.
| Seq1 | Seq2 | Ks | Ka | Ka/Ks Ratio | Date (MY) | Duplication Type |
|---|---|---|---|---|---|---|
| OsMT-4 | OsMT-7 | 0.1392 | 0.9012 | 0.1544 | 7.65 | WGD or segmental duplications |
| OsMT-7 | OsMT-8 | 0.1217 | 0.7707 | 0.1579 | 6.69 | tandem duplication |
| OsMT-8 | OsMT-9 | 0.2080 | 0.6090 | 0.3416 | 11.43 | tandem duplication |
| OrMT-3 | OrMT-8 | 0.1392 | 0.9745 | 0.1428 | 7.65 | WGD or segmental duplications |
| OrMT-8 | OrMT-9 | 0.0882 | 0.4947 | 0.1784 | 4.85 | tandem duplication |
| OnMT-2 | OnMT-3 | 0.1117 | 0.7852 | 0.1422 | 6.14 | tandem duplication |
| OiMT-5 | OiMT-9 | 0.1392 | 0.9745 | 0.1428 | 7.65 | WGD or segmental duplications |
| OiMT-9 | OiMT-10 | 0.2444 | 0.6186 | 0.3951 | 13.43 | tandem duplication |
| OiMT-10 | OiMT-11 | 0.2195 | 0.2856 | 0.7686 | 12.06 | tandem duplication |
| OiMT-11 | OiMT-12 | 0.1101 | 0.4226 | 0.2606 | 6.05 | tandem duplication |
| OgMT-4 | OgMT-6 | 0.1878 | 0.9203 | 0.2041 | 10.32 | WGD or segmental duplications |
| OgMT-6 | OgMT-7 | 0.1861 | 0.5980 | 0.3112 | 10.22 | tandem duplication |
| ObMT-3 | ObMT-8 | 0.1392 | 1.0556 | 0.1318 | 7.65 | WGD or segmental duplications |
| ObMT-5 | ObMT-6 | 0.1212 | 0.4932 | 0.2458 | 6.66 | tandem duplication |
| ObMT-8 | ObMT-9 | 0.1117 | 0.7852 | 0.1422 | 6.14 | tandem duplication |
Synonymous (Ks) and nonsynonymous (Ka) substitution rates of duplicate gene pairs (Ka/Ks ratios).
Next, Ka/Ks values of MT duplicate gene pairs were calculated to evaluate the driving force underlying MT gene evolution. The results showed that Ka/Ks values of the 15 duplicated MT genes ranged from 0.1318 to 0.7686, and all Ka/Ks values were less than 1 (Table 1), indicating that the duplicated MT genes were under a strong negative selection during evolution [24].
To better understand the evolutionary relationship of the MT genes in the Oryza genus, the orthogroup clustering was analyzed and a phylogenetic tree was constructed, and showed nine orthogroups in six Oryza genera; namely, eight in O. sativa ssp. japonica, eight in O. rufipogon, seven in O. sativa ssp. indica, eleven in O. nivara, eight in O. glumaepatula, and nine in O. barthii. However, OsMT-3 and OiMT-4 were assigned to the MT family (Supplementary Table S3 and Supplementary Table S4). Furthermore, the gene numbers in each orthogroup were different, ranging from 3 to 10. Orthogroup 0 was the largest, and single-copy orthogroups were found in orthogroups 1 and 4. Besides, we found that the number of orthologs was also different among these species (Table 1). These results showed that the unequal loss and expansion of most orthogroups might have occurred during the domestication process.
4. Collinearity Relations of O. sativa ssp. japonica with Other Tested Species
To evaluate the evolutionary relationship of the MT genes within Gramineae, the molecular phylogeny of the MT family was analyzed using the MCScanX toolkit. Referenced to the genome of japonica rice Nipponbare, we found seven, five, nine, six, and seven collinear gene pairs between O. sativa ssp. japonica and O. rufipogon, Oryza nivara, Oryza sativa ssp. indica, Oryza glumaepatula, and Oryza barthii, respectively (Supplementary Figure S2). The MT genes showed a strongly conserved collinearity among the six Oryza species and subspecies, and the collinearity of MT genes between japonica and indica was closer than the other species, supporting their close evolutionary distance.
5. Promoter Activity and Cis-Elements Identification of OsMT Genes in O. sativa ssp. japonica
Cis-elements in the promoter usually play a vital role in responding to different environments and determining the tissue-specificity of genes [25,26]. Thus, potential cis-regulatory elements in the promoter regions of japonica rice OsMT genes were identified by searching the PlantCARE database [27]. In total, 31 types of cis-regulatory elements were identified (Supplementary Figure S3); they can be primarily classified into three categories based on their functionality: phytohormone response, growth and development, and stress response [28]. The cis-regulatory elements in the growth and development category had a higher percentage than the other two categories (Supplementary Figure S3A,B). In the growth and development category, the light-responsive/responsiveness subcategory had a total of 74 motifs that belonged to 15 types of cis-elements (Supplementary Figure S3A), which indicated that light-responsive/responsiveness is widely present in the promoter region of MT genes. In the phytohormone response category, the MeJA-responsiveness element was the largest subcategory (40), which includes the TGACG- and CGTCA motif, followed by the abscisic acid responsiveness subcategory, including the ABRE cis-element (Supplementary Figure S3A). The top three subcategories in the stress response category were the anaerobic induction, drought-inducibility, and low-temperature responsiveness elements (Supplementary Figure S3A). The marked cis-element related to biological and abiotic stress in the promoters means that OsMT genes are widely involved in the environmental stress response.
Further analysis showed that cis-regulatory elements are unevenly distributed in the OsMT genes, and that some cis-regulatory elements were preferentially present on individual OsMT genes. For example, OsMT-5 and OsMT-8 had many MeJA-responsive cis-regulatory elements, and OsMT-7 had the most auxin regulatory elements (Supplementary Figure S3C), which is the functional specificity for a few of the MT genes.
The functional specificities of plant genes are often reflected by the promoter activities [29]; thus, the promoter activity of the nine OsMT genes in rice was investigated in planta using pGreen-0800 as a control, where the vector constructs are used in the dual-luciferase assay (Figure 4A). Results showed that the OsMT-9 promoter showed the highest LUC/RUC ratio in the protoplast of rice (Figure 4B), the promoter of OsMT-5, OsMT-7, and OsMT-8 showed the weakest activity, and the promoter of OsMT-1, OsMT-3, OsMT-4, OsMT-6, and OsMT-7 showed a higher fluorescence intensity than the control in Nicotiana benthamiana leaves (Figure 4C), reflecting a tissues-specific functional differentiation of the OsMT genes in rice.
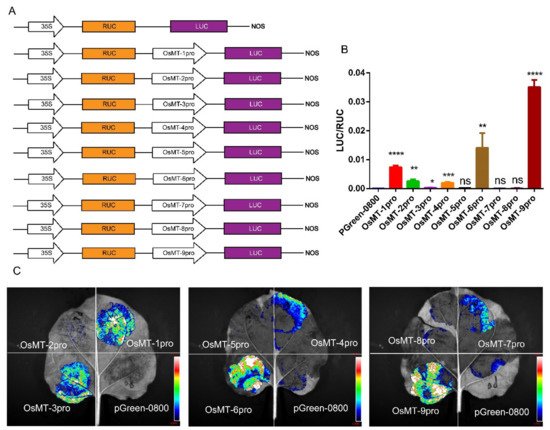
Figure 4. Analysis of the promoter function of OsMT genes in vivo: (A) the vector constructs are used in the dual-luciferase assay; (B) dual-luciferase assay in the protoplast of rice; (C) dual-luciferase assay in Nicotiana benthamiana leaves. The error bars show the standard deviations of the three independent biological replicates. Significance analysis was performed using t-test; *: p < 0.05, **: p < 0.01, ***: p < 0.001, ****: p < 0.0001.
This entry is adapted from the peer-reviewed paper 10.3390/ijms22179651
This entry is offline, you can click here to edit this entry!