Anti-Inflammatory Fibronectin-AgNP: History
Please note this is an old version of this entry, which may differ significantly from the current revision.
Subjects: Cell Biology
Contributor:

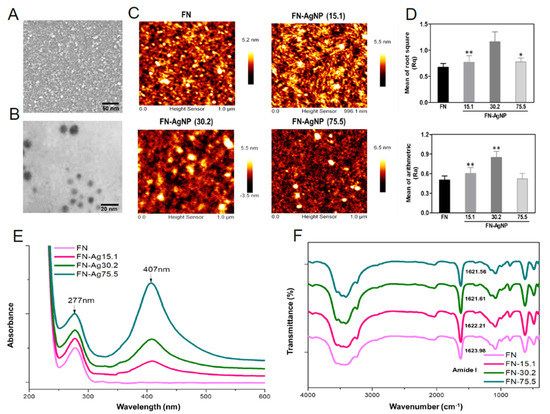
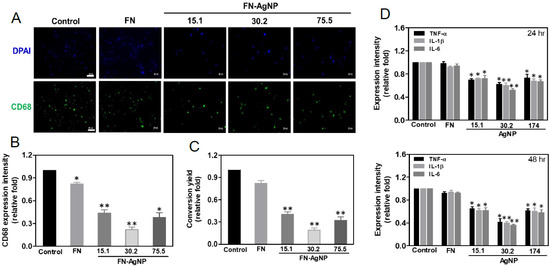
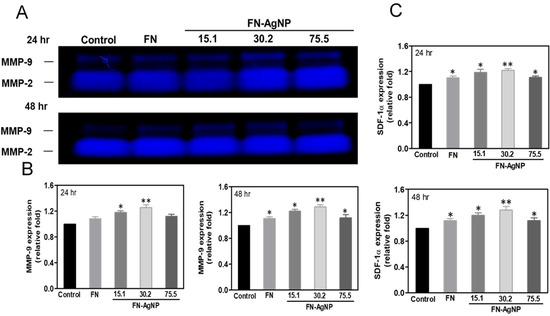
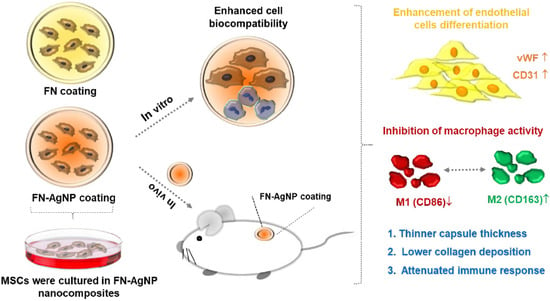
The engineering of vascular regeneration still involves barriers that need to be conquered. In the current study, a novel nanocomposite comprising of fibronectin (denoted as FN) and a small amount of silver nanoparticles (AgNP, ~15.1, ~30.2 or ~75.5 ppm) was developed and its biological function and biocompatibility in Wharton’s jelly-derived mesenchymal stem cells (MSCs) and rat models was investigated. The surface morphology as well as chemical composition for pure FN and the FN-AgNP nanocomposites incorporating various amounts of AgNP were firstly characterized by atomic force microscopy (AFM), UV-Visible spectroscopy (UV-Vis), and Fourier-transform infrared spectroscopy (FTIR). Among the nanocomposites, FN-AgNP with 30.2 ppm silver nanoparticles demonstrated the best biocompatibility as assessed through intracellular ROS production, proliferation of MSCs, and monocytes activation. The expression levels of pro-inflammatory cytokines, TNF-α, IL-1β, and IL-6, were also examined. FN-AgNP 30.2 ppm significantly inhibited pro-inflammatory cytokine expression compared to other materials, indicating superior performance of anti-immune response. Mechanistically, FN-AgNP 30.2 ppm significantly induced greater expression of vascular endothelial growth factor (VEGF) and stromal-cell derived factor-1 alpha (SDF-1α) and promoted the migration of MSCs through matrix metalloproteinase (MMP) signaling pathway. Besides, in vitro and in vivo studies indicated that FN-AgNP 30.2 ppm stimulated greater protein expressions of CD31 and von Willebrand Factor (vWF) as well as facilitated better endothelialization capacity than other materials. Furthermore, the histological tissue examination revealed the lowest capsule formation and collagen deposition in rat subcutaneous implantation of FN-AgNP 30.2 ppm. In conclusion, FN-AgNP nanocomposites may facilitate the migration and proliferation of MSCs, induce endothelial cell differentiation, and attenuate immune response. These finding also suggests that FN-AgNP may be a potential anti-inflammatory surface modification strategy for vascular biomaterials. 

  • mesenchymal stem cells
  • fibronectin
  • silver nanoparticles
  • endothelial differentiation
  • vascular tissue engineering

1. Introduction

FN combined with type I collagen, VEGF and SDF-1α was reputed to improve endothelialization [1]. A novel biostable polyurethane elastomer (TPCU) biofunctionalized with FN and decorin (DCN) did not induce major immune responses, and it could attract endothelial colony-forming cells (ECFCs), suggesting the potential of FN to be an appropriate natural biomolecule for creating nanocomposites [2]. Previously, FN-Au nanocomposites were found to reduce monocyte activation and enhance biocompatibility [3][4]. In the current study, AgNP combined with fibronectin (FN) because the polyurethane–Ag nanocomposites were observed to have better hemocompatibility than polyurethane–Au nanocomposites [5][6]. In vitro and in vivo evaluation showed FN-AgNP to be a novel antimicrobial and anti-inflammatory surface modification coating for vascular repair and regeneration engineering.

2. Analysis on Results

2.1. Characterization of FN and FN-AgNP

The surface morphology of AgNP was observed by SEM analysis (Figure 1A). The nanoparticle size of AgNP is about 5 nm. Furthermore, TEM imaging also confirmed the diameter of AgNP was about 5 nm as shown in Figure 1B. Indeed, the nanotopography were observed by AFM assay as shown in Figure 1C. The value of root mean square (Rq) and average roughness (Ra) were semi-quantified and indicated as Figure 1D. The value of Rq and Ra were significantly higher at 30.2 ppm of FN-AgNP (Rq: ~1.16 nm, Ra: ~0.85 nm), compared to FN-AgNP 75.5 ppm (Rq: ~0.77 nm, Ra: ~0.52 nm), FN-AgNP 15.1 ppm (Rq: ~0.77 nm, Ra: ~0.60 nm) and pure FN (Rq: ~0.67 nm, Ra: ~0.50 nm). FN is an adhesion molecule that composes of three different repeating domains, and contains amino-terminal FN dimers which can be assembled into ECM of fibroblasts. The above results indicated that FN and AgNP may facilitate cellular interactions with ECM contributing to effect differentiation of stem cells. The UV-Vis absorption peak at 407 nm was attributed to the increasing concentration of AgNP from 15.1 ppm to 75.5 ppm (Figure 1E). According to Figure 1F, the position of the amide-I band maximum was at approximately 1636 cm−1 [7]. When FN was combined with AgNP, there was a shift in the peak position of amide I from 1623.98 cm−1 (pure FN) to 1622.21 cm−1 (FN-AgNP 15.1 ppm), 1621.61 cm−1 (FN-AgNP 30.2 ppm) and 1621.56 cm−1 (FN-AgNP 75.5 ppm). The above findings indicated that the amide I band may have strong interaction with AgNP. [8]. After the combination of AgNP into pure FN, significant changes occurred in the spectra near 1610~1700 cm−1 (peptide carbonyl stretching vibration, CO). According to Figure 1F, there was a shift in the peak position of amide I from 1623.98 cm−1 (pure FN) to 1622.21 cm−1 (FN-AgNP 15.1 ppm), 1621.61 cm−1 (FN-AgNP 30.2 ppm) and 1621.56 cm−1 (FN-AgNP 75.5 ppm). The above findings indicated that the amide I band may have strong interaction with AgNP.
Figure 1. Materials characterization. The preparation procedure of fibronectin-silver nanoparticle (FN-Ag) composites. (A) SEM images of AgNP and (B) TEM image of the diameter of AgNP was about 5 nm. (C) Preparation of FN-AgNP nano-composites. The surface topography of pure FN and FN-AgNP containing various amount of Ag were observed by AFM. (D) Rq is the roughness, while Ra represents as the average roughness of each material. * p < 0.05, ** p < 0.01: greater than the control (FN). (E) UV-Visible absorption peak of pure FN and FN-Ag containing various amount of AgNP (~15.1 ppm, ~30.2 ppm and ~75.5 ppm). (F) FTIR spectrum of pure FN and FN-Ag nanocomposites in the total wave number 400 cm−1 to 4000 cm−1. Data results from one representative experiment of three independent experiments.

2.2. Cytoskeletal Change and Migration Ability of HSF and MSC on FN-AgNP Nanocomposites

It has been reported that co-culture of fibroblasts and endothelial could significantly enhance the angiogenesis of endothelial cells. It was indicated that there are intimate communications between fibroblasts and endothelial cells for angiogenesis, and the paracrine effect may play a crucial role in these communications [9]. Therefore, the effects of different materials on biocompatibility and the biological activity of fibroblast (HSF) were also investigated in this study. The assessment of actin fiber staining via phalloidin-rhodamine conjugate is demonstrated in Figure S1A and Figure 2A. In control group, the actin fibers of HSF and MSC were mostly near the cell body and exhibited in circumferential shape. While seeding cells with FN-AgNP 30.2 ppm, the actin fibers became more extended. The length of actin fiber was much longer in MSC culturing in FN-AgNP nanocomposites, especially in FN-AgNP 30.2 ppm (~1.46-fold) and following by FN-AgNP 15.1 ppm (~1.35-fold), pure FN (~1.23-fold) and FN-AgNP 75.5 ppm (~1.20-fold). The above condition could also be observed in HSF, but had a less extension comparing to MSCs: FN-AgNP 30.2 ppm (~1.39-fold), FN-AgNP 15.1 ppm (~1.28-fold), pure FN (~1.20-fold) and FN-AgNP 75.5 ppm (~1.15-fold) (Figure S1C and Figure 2C).
Figure 2. Cytoskeletal fibers examination and Migration ability of MSCs. (A) The cytoskeleton stain-ing for the actin fibers of MSCs cultured with pure FN and various concentrations of FN-AgNP nanomaterials at 48 h observed by fluorescence microscopy. F-actin: red color fluorescence, DAPI: blue color fluorescence. Scale bar equals to 50 μm. (B) MSCs migrated into central area was confirmed through fluorescence microscopy. After incubating for 24 and 48 h, calcein-AM (2 μM) solu-tion was used to stain the MSCs prior to observation. Scale bar = 200 μm. (C) The length of actin fiber was measured for MSCs on various nanomaterials and the results were semi-quantified at 48 h. The migration distance of MSCs seeding on various materials was semi-quantified at 48 h. Data are mean ± SD (n = 3). * p < 0.05; ** p < 0.01: greater than the control. (D) MSC proliferation after seeding on pure FN and FN-AgNP nanocomposites containing ~15.1 ppm, ~30.2 ppm and ~75.5 ppm of AgNP was investigated by MTT assay. Data are the mean ± SD (n = 6). * p < 0.05; ** p < 0.01: greater than the control (MSC). Data results from one representative experiment of six independent experiments The ROS production was targeted by DCFH-dA and was quantified by FACS analysis for (E) MSC on various materials. Data are mean ± SD (n = 3). * p < 0.05; ** p < 0.01: smaller than the control. Data results from one representative experiment of three independent experiments. Control group = tissue culture plate (TCPS).
As Figure S1B and Figure 2B showed, the real-time observation of cell migration distance was observed in pre-migration (t = 0 h) and post-migration (t = 24 and 48 h). The semi-quantitative data (Figure 2D and Figure S1D) in MSCs from 24 to 48 h on FN-AgNP 30.2 ppm (~1.24 to ~1.46-fold) was significantly greater than other materials [FN-AgNP 15.1 ppm (~1.18 to ~1.39-fold), FN-AgNP 75.5 ppm (~1.10 to ~1.22-fold) and pure FN (~1.07 to ~1.18-fold)]. The similar condition could be observed in HSF particularly in FN-AgNP 30.2 ppm (~1.28 to ~1.46-fold), following by FN-AgNP 15.1 ppm (~1.20 to ~1.35-fold), FN-AgNP 75.5 ppm (~1.15 to ~1.25-fold) and pure FN (~1.12 to ~1.22-fold). Based on the results, FN-AgNP 30.2 ppm could induce advanced cell adhesion and migration behaviors.

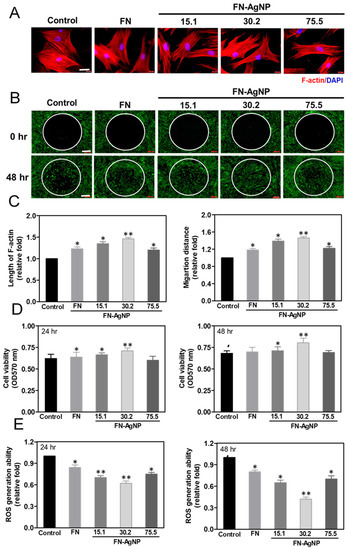
2.3. Cell Proliferation and ROS Production

The proliferation of HSF and MSCs culturing on various materials for 24 and 48 h are demonstrated in Figure S1E and Figure 2E. The cell viability of HSF (OD570nm = ~0.92) and MSC (OD570nm = ~0.80) at 48 h was both the highest on FN-AgNP 30.2 ppm, following by FN-AgNP 15.1 ppm (HSF: OD570nm = ~0.83, MSC: OD570nm = ~0.70), FN-AgNP 75.5 ppm (HSF: OD570nm = ~0.69, MSC: OD570nm = ~0.69) and pure FN (HSF: OD570nm = ~0.66, MSC: OD570nm = ~0.68). ROS generation of HSF and MSC on various materials is depicted in Figures S1F and S2F. At 48 h, the FN-AgNP 30.2 ppm induced the lowest amount of ROS generation in both HSF (~0.5-fold) and MSC (~0.42-fold), comparing to FN-AgNP 15.1 ppm (HSF: ~0.7-fold, MSC: ~0.65-fold), FN-AgNP 75.5 ppm (HSF: ~0.73-fold, MSC: ~0.7-fold) and pure FN (HSF: ~0.87-fold, MSC: ~0.8-fold).

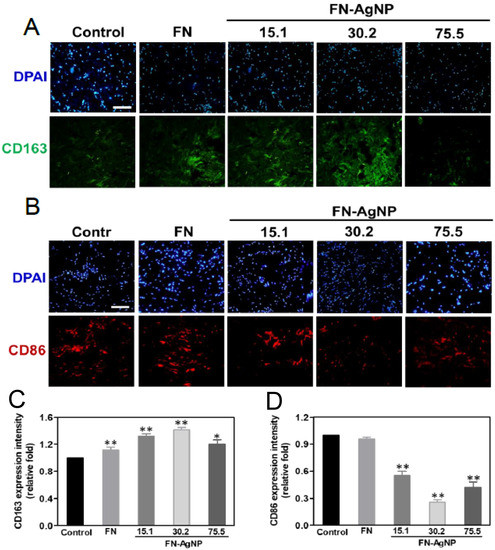
2.4. Biocompatibility Assay

The monocyte activation was further evaluated by CD68 staining (the marker of macrophage) shown in Figure 3A. The quantification of CD68 expression resulting from fluorescent intensity was demonstrated in Figure 3B. While in FN-AgNP 30.2 ppm (~0.52-fold), the expression of CD68 was the lowest, following by FN-AgNP 15.1 ppm (~0.52-fold), FN-AgNP 75.5 ppm (~0.60-fold) and pure FN (~0.88-fold). And a similar trend of conversion ratio among different materials was shown in Figure 3C. Furthermore, the pro-inflammatory cytokines (TNF-α, IL-1β, IL-6) expression were also examined via ELISA assay (Figure 3D). The quantitative data indicated the lowest expression in FN-AgNP 30.2 ppm. These results suggested that FN-AgNP nanocomposites may stimulate lower inflammatory response.
Figure 3. CD68 expression of macrophages on various materials at 96 h and the expression of pro-inflammatory cytokines (TNF-α, IL-1β, IL-6) at 24 and 48 h. (A) The cells were stained by primary anti-CD68 antibody and conjugated with FITC-immunoglobin secondary antibody (green color). DAPI solution was used to locate cell nuclei (blue color). The results were captured using fluorescence microscopy. Scale bar = 20 μm. (B) The expression level of CD68 was analyzed based on fluorescence intensity. (C) The conversion yield of human monocytes activation after culturing on pure FN and various concentrations of FN-AgNP for 96 h. (D) The expression of proinflammatory cytokines at 24 and 48 h was analyzed based on the expression intensity. Data are the mean ± SD (n = 3). * p < 0.05; ** p < 0.01: smaller than the control. Control group = glass cover slide.

2.5. Effect of FN-AgNP Nanocomposites on SDF-1α Expression and MMPs Activation in MSCs

The representative zymograms for MMP-2 (62 kDa) and MMP-9 (90 kDa) at various times (24 and 48 h) are displayed as Figure 4A. The semi-quantification of MMP-9 gene expression is represented in Figure 4B. Indeed, the expression of MMP-9 in MSCs at 48 h is the greatest in FN-AgNP 30.2 ppm (~1.29-fold), following by FN-AgNP 15.1 ppm (~1.22-fold), FN-AgNP 75.5 ppm (~1.20-fold) and pure FN (~1.11-fold). On the basis of previous study, the SDF-1α protein is investigated which plays a critical role in MSCs migration for promoting tissue repair. Semi-quantitative results (Figure 4C) showed that after 24 and 48 h of incubation, the SDF-1α expression in MSCs on FN-AgNP 30.2 ppm (~1.22-fold to ~1.28-fold) examined by ELISA assay was significantly greater than other groups [FN-AgNP 15.1 ppm (~1.19-fold to ~1.2-fold), FN-AgNP 75.5 ppm (~1.11-fold to ~1.12-fold) and pure FN (~1.1-fold to ~1.12-fold)]. The MMP-9 expression in HSF was also showed in Figure S2 [FN-AgNP 30.2 ppm (~1.34-fold to ~1.44-fold), FN-AgNP 15.1 ppm (~1.26-fold to ~1.3-fold), FN-AgNP 75.5 ppm (~1.4-fold to ~1.28-fold) and pure FN (~1.2-fold to ~1.22-fold)].
Figure 4. The MMP enzymatic activities and SDF-1α protein expression in MSCs culturing on various materials at 24 and 48 h. (A) The representative MMP-2 and MMP-9 zymogram for (a) 24 and (b) 48 h is shown. The semiquantitative meas-urement of (B) MMP-9 and (C) SDF-1α protein expression revealed a significantly greater expression culturing MSCs with FN-AgNP 30.2 ppm at 24 and 48 h. Data are presented as mean ± SD (n = 3). * p < 0.05; ** p < 0.01: greater than the control. Control group = glass cover slide.

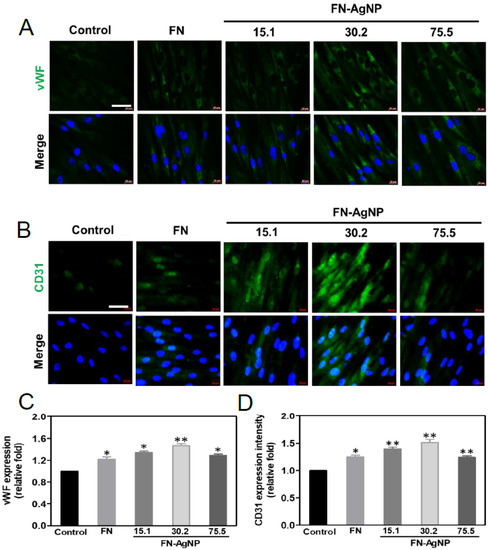
2.6. Endothelialization of MSCs Induced by FN-AgNP Nanocomposites

Immunofluorescence staining analysis can be clearly observed in Figure 5A,B, to characterize the expression of EC marker (CD31 and vWF) after seeded MSCs on FN-AgNP for 7 days. Figure 5C,D demonstrate the semi-quantitative data of CD31 and vWF expression. The CD31 and vWF expression on FN-AgNP 30.2 ppm (CD31: ~1.52-fold, vWF: ~1.47-fold) are significantly greater than other groups [FN-AgNP 15.1 ppm (CD31: ~1.40-fold, vWF: ~1.34-fold), FN-AgNP 75.5 ppm (CD31: ~1.24-fold, vWF: ~1.29-fold) and pure FN (CD31: ~1.25-fold, vWF: ~1.22-fold)]. The above results strongly suggest that FN-AgNP nanocomposites may facilitate MSC differentiate into ECs. The differentiation capacity of MSCs induced by various materials was then evaluated. The phenotypes of endothelial cells were also observed at days three and five. After culturing MSCs with various materials, FN-Ag 30.2 ppm induced a slight expression level of endothelial markers at days three and five as compared to the control, with the immunostaining images shown in Figure S3A,B. The semi-quantitative data showed that the mineral? differentiation in the FN-Ag 30.2 ppm group was the greatest at days three and five (p < 0.01) (Figure S3C,D).
Figure 5. Differential expression of CD31 and vWF protein in MSCs culturing with various nanomaterials at day seven. The MSCs were firstly stained by primary (A) anti-CD31 and (B) anti-vWF antibody and conjugated with FITC secondary antibody (green color). The cell nucleus was located by DAPI (blue color). The images were taken by fluorescence micros-copy. Scale bar = 20 μm. (C,D) The quantitative results of fluorescence intensity for CD31 and vWF revealed a higher expression amount in FN-AgNP 30.2 ppm group. Data are the mean ± SD (n = 3). * p < 0.05; ** p < 0.01: greater than the control. Control group = TCPS.

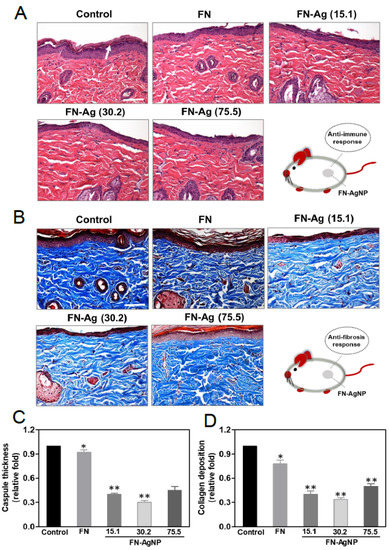
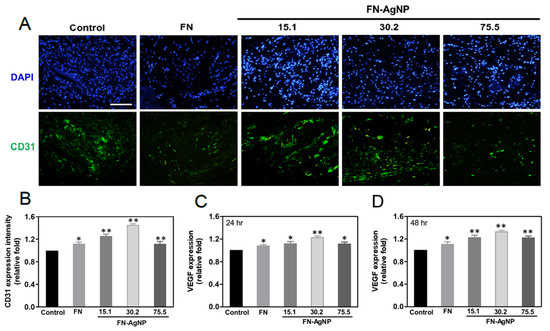
2.7. Biocompatibility and Endothelialization Ability in the Rat Subcutaneous Model

Indeed, chronic inflammation may cause fibrosis and then leads to poor tissue regeneration and affect biocompatibility of nano biomaterials. In brief, a successful implantation is commonly determined by the interaction of cells and molecules between the implanted body and host tissue. The fibrotic encapsulation caused by foreign body response from the different materials was observed via subcutaneous after one month of implantation in order to confirm the biocompatibility and biosafety in vivo (Figure 6A). Indeed, it was also calculated the intensity of tissue fibrosis effect using Masson’s trichrome staining, which revealed collagen deposition in response to the control treated group (glass) (Figure 6B). The semi-quantification analysis results are represented in Figure 6C,D. The value of capsule thickness was the lowest in FN-AgNP 30.2 ppm group (~0.3-fold), comparing to FN-AgNP 15.1 ppm (~0.4-fold), FN-AgNP 75.5 ppm (~0.45-fold) and pure FN (~0.92-fold). And the collagen deposition was also investigated and had a similar trend with capsule thickness [FN-AgNP 30.2 ppm (~0.34-fold), FN-AgNP 15.1 ppm (~0.4-fold), FN-AgNP 75.5 ppm (~0.5-fold) and pure FN (~0.78-fold)]. In addition, the endothelialization marker CD31, and VEGF were also investigated (Figure 7). As Figure 7A,B showed, the expression of CD31 was significantly higher in FN-AgNP 30.2 ppm (~1.46-fold) group than in other materials [FN-AgNP 15.1 ppm (~1.26-fold), FN-AgNP 75.5 ppm (~1.12-fold) and pure FN (~1.13-fold)]. And the expression of VEGF was measured at 24 and 48 h through ELISA assay (Figure 7C). The results showed the expression in FN-AgNP 30.2 ppm group (~1.23-fold to ~1.33-fold) was greater than other materials [FN-AgNP 15.1 ppm (~1.12-fold to ~1.23-fold), FN-AgNP 75.5 ppm (~1.12-fold to ~1.22-fold) and pure FN (~1.08-fold to ~1.11-fold)]. Furthermore, the macrophage polarization was examined and demonstrated as Figure 8A,B. The marker for M1 polarization, CD86, was significantly lower expressed in FN-AgNP 30.2 ppm group (~0.22-fold), then followed by FN-AgNP 75.5 ppm (~0.38-fold), FN-AgNP 15.1 ppm (~0.44-fold) and pure FN (~0.82-fold) groups (Figure 8C). Next, CD163 was selected as t M2 polarization marker, then found a reverse trend. Indeed, the tissues in the FN-AgNP 30.2 ppm group (~1.42-fold) was the greatest expression, comparing to FN-AgNP 15.1 ppm (~1.32-fold), FN-AgNP 75.5 ppm (~1.20-fold) and pure FN (~1.12-fold) (Figure 8D). The above results elucidated FN-AgNP 30.2 ppm could remarkably suppress inflammatory responses and enhance endothelialization ability. The biocompatibility capacity, biological performance, endothelial differentiation ability, and anti-inflammatory response was enhanced by FN-AgNP nanocomposites both in in vivo and the in vivo assay as illustrated in Figure 9.
Figure 6. Subcutaneous implantation to measure the foreign body reactions induced by various nanomaterials. After four weeks of implantation, (A) H&E staining, white arrows indicate the thickness of the capsule, and (B) Masson’s staining were applied to process further investigations. Scale bar = 100 μm. (C,D) Semi-quantification of capsule thickness and collagen deposition was revealed based on the histology examination. Control group = glass cover slide. * p < 0.05; ** p < 0.01: less than the control (n = 5).
Figure 7. Immunohistochemistry staining for endothelialization marker CD31 affected by the implant materials. (A) The histology images for CD31 were showed after implanting various materials for four weeks. Scale bar = 100 μm. (B) The CD31 expression was also investigated and then semi-quantified according to fluorescence intensity. * p < 0.05; ** p < 0.01: higher than the control (n = 5). Control group = glass cover slide. (C,D) The expression level of VEGF protein was evaluated via ELISA assay at 24 and 48 h, then the fluorescence intensity were semi-quantified by Image J software. Control group = TCPS. Data are the mean ± SD. * p < 0.05; ** p < 0.01: greater than the control (n = 5).
Figure 8. Images of immunohistochemistry staining for macrophage polarization after four weeks subcutaneous implant-ation. (A,B) The IHC staining for markers of macrophage, CD163 (M2, green color) and CD86 (M1, red color), were inves-tigated after implanting various materials. (C) The expression of CD163 was semi-quantified. * p < 0.05; ** p < 0.01: greater than the control (n = 5). (D) The expression of CD86 was also analyzed resulting from fluorescence intensity. * p < 0.05; ** p < 0.01: less than the control. cell nucleus was located by DAPI (blue color). Control group = glass cover slide. Scale bar = 100 μm. Data are presented as mean ± SD (n = 5).
Figure 9. Schematic illustrations that indicate the efficacy of FN-AgNP nanocomposites. FN-AgNP nanocomposite coating enhanced the migration and differentiation ability of MSCs while inhibiting monocyte activation. Furthermore, after im-planted into the rat model, FN-AgNP induced thinner capsule formation, lower collagen deposition, and had an anti-immune response. Based on these evidences, FN-AgNP nanocomposites are suggested to be a promising surface modifi-cation strategy for biomedical applications.

3. Current Insights

Bacterial infection during intravenous injection is a barrier for clinical treatments. The short-term peripheral venous catheters (PVC) are one of the commonly used invasive medical devices in hospitals, but PVC often fail due to vascular or infectious complications such as gram-negative bacteremia or other bloodstream infections before the end of treatments. The above reasons can cause the interruption of treatments that is harmful to patients. Moreover, PVC replacement causes pain on patients and increases treatment costs [10]. A biodegradable water absorption sponge incorporating AgNP had antibacterial properties [11]. Likewise, FN-AgNP nanocomposites can become a novel of surface modification biomaterials for clinical treatments. After coating FN-AgNP on PVC, it may have potential to prevent bloodstream infection and reduce inflammatory response on patients. This kind of surface modified peripheral venous catheters may be developed as a long-term injection medical device to reduce failure rate and decrease treatment costs.
In conclusion, this research suggests that via making composites with fibronectin and AgNP, the behavior of MSCs on the biomaterial such as protein expression of SDF-1α and MMP enzymatic activities can be affected, leading to vascular remodeling. The nanocomposite coating improved blood compatibility, enhanced MSCs migration, proliferation, and EC phenotype as well as attenuated the immune response and ROS generation. With these benefits, the FN-AgNP nanocomposite may be a promising nanobiomaterial to provide a suitable surface coating and delivery technology for implanted cardiovascular devices.

This entry is adapted from the peer-reviewed paper 10.3390/ijms22179262

References

  1. Sgarioto, M.; Vigneron, P.; Patterson, J.; Malherbe, F.; Nagel, M.-D.; Egles, C. Collagen type I together with fibronectin provide a better support for endothelialization. Comptes Rendus Biol. 2012, 335, 520–528.
  2. Daum, R.; Visser, D.; Wild, C.; Kutuzova, L.; Schneider, M.; Lorenz, G.; Weiss, M.; Hinderer, S.; Stock, U.A.; Seifert, M.; et al. Fibronectin Adsorption on Electrospun Synthetic Vascular Grafts Attracts Endothelial Progenitor Cells and Promotes Endothelialization in Dynamic In Vitro Culture. Cells 2020, 9, 778.
  3. Hung, H.-S.; Tang, C.-M.; Lin, C.-H.; Lin, S.-Z.; Chu, M.-Y.; Sun, W.-S.; Kao, W.-C.; Hsien-Hsu, H.; Huang, C.-Y.; Hsu, S.-H. Biocompatibility and favorable response of mesenchymal stem cells on fibronectin-gold nanocomposites. PLoS ONE 2013, 8, e65738.
  4. Chen, Y.-W.; Hsieh, S.-C.; Yang, Y.-C.; Hsu, S.-h.; Kung, M.-L.; Lin, P.-Y.; Hsieh, H.-H.; Lin, C.-H.; Tang, C.-M.; Hung, H.-S. Functional engineered mesenchymal stem cells with fibronectin-gold composite coated catheters for vascular tissue regeneration. Nanomed. Nanotechnol. Biol. Med. 2018, 14, 699–711.
  5. Hung, H.-S.; Hsu, S.-H. Biological performances of poly (ether) urethane–silver nanocomposites. Nanotechnology 2007, 18, 475101.
  6. Huang, H.; Lai, W.; Cui, M.; Liang, L.; Lin, Y.; Fang, Q.; Liu, Y.; Xie, L. An evaluation of blood compatibility of silver nanoparticles. Sci. Rep. 2016, 6, 25518.
  7. Koteliansky, V.E.; Glukhova, M.A.; Benjamin, M.V.; Smirnov, V.N.; Filimonov, V.V.; Zalite, O.M.; Venyaminov, S.Y. A Study of the Structure of Fibronectin. Eur. J. Biochem. 1981, 119, 619–624.
  8. Baujard-Lamotte, L.; Noinville, S.; Goubard, F.; Marque, P.; Pauthe, E. Kinetics of conformational changes of fibronectin adsorbed onto model surfaces. Colloids Surf. B Biointerfaces 2008, 63, 129–137.
  9. Li, H.; Chang, J. Bioactive silicate materials stimulate angiogenesis in fibroblast and endothelial cell co-culture system through paracrine effect. Acta Biomater. 2013, 9, 6981–6991.
  10. Sasaki, T.; Harada, S.; Yamamoto, S.; Ohkushi, D.; Hayama, B.; Takeda, K.; Hoashi, K.; Shiotani, J.; Takehana, K.; Doi, Y. Clinical characteristics of peripheral venous catheter-associated gram-negative bloodstream infection among patients with malignancy. PLoS ONE 2020, 15, e0228396.
  11. Boonpavanitchakul, K.; Pimpha, N.; Kangwansupamonkon, W.; Magaraphan, R. Processing and antibacterial application of biodegradable sponge nano-composite materials of silver nanoparticles and silk sericin. Eur. Polym. J. 2020, 130, 109649.
More
This entry is offline, you can click here to edit this entry!