Your browser does not fully support modern features. Please upgrade for a smoother experience.
Please note this is an old version of this entry, which may differ significantly from the current revision.
Subjects:
Food Science & Technology
Grape stems are a by-product from the wine industry that has been underused to date despite having great potential for the agro-food, pharma and cosmetic industries. This entry statistical analysis revealed that the influence of environmental factors such as light, temperature and precipitations have different impact on the synthesis of polyphenols depending on the family of the specific compound.
- grape stem
- variety
- vintage
- phenolic composition
- antioxidant activity
1. Introduction
The agricultural sector and the agro-food industry generate a large quantity of problematic residues because of their high humidity and also their high content of organic matter. One of those industries corresponds to the wine industry, that produces high levels of waste, which is a major problem and concern from both economic and ecological point of view [1]. The main by-products of this industry include grape stems, skins and seeds, that involves 20% of the weight of the processed grapes [2]. Currently there exist innovative applications for the use of these residues, including the use of grape skins for the production of infusions [3], food supplements [4] or as additives in the winemaking process itself [5]. Among them, grape stem are the least studied by-products despite representing a large amount of annual waste [6]. Usually, grape stems are used as organic fertilizer, as feed for ruminants [7] or valorized through the production of ethanol and paper pulp [8]. However, in recent years, several studies have demonstrated that these by-products contain high concentrations of polyphenols, cellulose, hemicellulose and lignin [9][10][11], which is causing a growing interest in their use as bioactive phytochemicals [12][13]. For instance, Leal et al. [14] found that stem extracts present antimicrobial activity, with high efficacy against ulcers produced by Gram-positive bacteria in foot wounds. In addition, they observed that these extracts have an anti-inflammatory capacity by inhibiting the production of nitric oxide by lipopolysaccharide-stimulated macrophages, and anti-aging effect by inhibiting the anti-tyrosinase and anti-elastase activities. Grape stem extracts have also been demonstrated to be a good therapeutic agent, as they possess antibacterial activity against a wide variety of pathogens, including Listeria monocytogenes, Staphylococcus aureus, Enterococcus faecalis, Escherichia coli, Pseudomonas aeruginosa and Salmonella enterica [15][16]. Other authors also found that the use of these by-products in food industry, in cosmetics and in products with pharmacological activity is interesting since they have potential antioxidant, antimicrobial, anti-inflammatory and anticancer activity, among others [17][18][19][20].
Several authors have demonstrated that the antioxidant activity of grape stem extracts is correlated with their phenolic composition [7][12][16][21][22]. There exist a large variety of phenolic compounds belonging to different families identified in grape stems. Among them, caftaric and gallic acids are the most representative phenolic acids found in grape stems, trans-resveratrol and ε-viniferin the two main stilbenes, quercetin derivatives the main flavonols, catechin and epicatechin the most abundant flavanols, and malvidin-3-glucoside and other malvidin derivatives are the anthocyanins most frequently identified in those by-products [9]. Despite this, Teixeira et al. [23] found that the composition and concentration of polyphenols on grape stems depend on the grape variety, ripeness, climatic and geographical growing conditions and cultivation practices. However, the magnitude of the influence of each parameter in the phenolic composition of grape stem it is not well known. There exist research works that studied the influence of the grape variety on the phenolic composition of grape stem extracts [21][24][25], but there are few studies that afford the influence of a relevant factor such as the vintage in the polyphenolic composition of grape stems. Recently, Blackford et al. [9] performed a compilation of the phenolic composition of different grape stems reported in the literature by different authors. In this work it is confirmed that there exist differences in the phenolic composition and antioxidant capacity among stems from different varieties and vintages. However, it is very difficult to compare the values obtained from different studies, since the extraction protocols are different, and, also, data are presented in different units. For this reason, the main objective of the present work is to know how the grape variety and the vintage can affect the phenolic composition of grape stem extracts from six varieties (Garnacha, Tempranillo, Mazuelo, Graciano, Chardonnay and Cabernet Sauvignon), all of them from the same geographical region, and three of them coming from two different vintages (Garnacha, Mazuelo and Tempranillo). The use of samples from the same geographical region will guarantee that the influence of soil, culture practices and climatic conditions will be very similar in all cases, so the use of the same extraction and analysis protocols will allow obtaining reliable information about the influence of the variety and vintage on the phenolic composition of grape stem extracts.
2. Phenolic Compounds
Table 1 shows the phenolic compounds identified and quantified in grape stems from the different varieties from the 2016 and 2018 vintages. These data are also summarized through an inferential analysis of the phenolic composition in Figures S2 and S3 (see Supplementary Material). As it can be seen, catechin was the most abundant phenolic compound in all extracts from both vintages, with a concentration range between 0.95 and 3.50 mg/g. This result is in agreement with other authors [10][23][26][27] who also identified catechin as one of the main polyphenolic compounds in grape stem extracts, and described similar concentration ranges than those obtained in the present study. Among the phenolic acids identified and quantified in the present study, gallic acid was the most abundant in all varieties and vintages, with concentration values from 0.12 to 1.29 mg/g. These results are consistent with other authors [10][18] who also found that gallic acid is one of the most abundant hydroxybenzoic acids in grape stem extracts.
Table 1. Phenolic composition (mg/g extract) of the different grape stem extracts analyzed in this study (mean ± SD).
| Gallic Acid | Ellagic Acid | Caftaric Acid | Catechin | trans-Resveratrol | ε-Viniferin | Quercetin | Quercetin-3-Derivative | Procyanidin B1 | Malvidin-3-Glucoside | Unknown Anthocyanin | |
|---|---|---|---|---|---|---|---|---|---|---|---|
| Vintage 2016 | |||||||||||
| GAR | 0.12 ± 0.03 a | 0.031 ± 0.007 a | 0.05 ± 0.01 a | 1.0 ± 0.2 a | 0.06 ± 0.01 a | 0.33 ± 0.05 ab | 0.014 ± 0.002 a | 0.24 ± 0.06 a | 0.4 ± 0.1 a | 0.03 ± 0.01 a | <LD a |
| MAZ | 0.23 ± 0.01 b | 0.028 ± 0.001 a | 0.13 ± 0.00 b | 1.2 ± 0.1 ab | 0.24 ± 0.02 b | 0.69 ± 0.03 c | 0.043 ± 0.002 c | 0.99 ± 0.03 d | 0.4 ± 0.0 a | 0.09 ± 0.00 a | 0.10 ± 0.00 b |
| TEM | 0.14 ± 0.02 a | 0.043 ± 0.009 a | 0.12 ± 0.01 b | 1.0 ± 0.2 a | 0.04 ± 0.01 a | 0.20 ± 0.06 a | 0.029 ± 0.008 b | 0.70 ± 0.06 c | 0.5 ± 0.1 a | 0.48 ± 0.04 b | 0.22 ± 0.02 c |
| GRA | 0.18 ± 0.00 ab | 0.042 ± 0.002 a | 0.14 ± 0.01 b | 1.6 ± 0.0 b | 0.37 ± 0.03 c | 0.45 ± 0.03 b | 0.013 ± 0.001 a | 0.52 ± 0.02 b | 1.1 ± 0.1 b | 0.61 ± 0.03 c | 0.37 ± 0.03 d |
| Vintage 2018 | |||||||||||
| GAR | 1.29 ± 0.06 c | 0.097 ± 0.004 a | 0.14 ± 0.01 a | 1.3 ± 0.1 a | 0.13 ± 0.01 c | 0.46 ± 0.04 b | 0.073 ± 0.003 b | 0.62 ± 0.03 ab | 0.9 ± 0.1 a | 0.12 ± 0.00 b | 0.03 ± 0.00 a |
| MAZ | 1.18 ± 0.09 c | 0.054 ± 0.005 a | 0.33 ± 0.03 b | 3.5 ± 0.3 b | 0.30 ± 0.04 d | 0.55 ± 0.08 b | 0.108 ± 0.011 c | 1.50 ± 0.14 c | 2.5 ± 0.2 c | 0.22 ± 0.04 b | 0.24 ± 0.04 b |
| TEM | 0.52 ± 0.04 b | 0.060 ± 0.004 a | 0.23 ± 0.02 ab | 0.9 ± 0.1 a | 0.04 ± 0.00 ab | 0.15 ± 0.03 a | 0.056 ± 0.004 b | 0.79 ± 0.05 b | 0.4 ± 0.0 a | 0.80 ± 0.06 c | 0.55 ± 0.07 c |
| CHA | 0.15 ± 0.02 a | 0.049 ± 0.006 a | 0.20 ± 0.02 a | 1.0 ± 0.2 a | 0.07 ± 0.01 b | 0.42 ± 0.08 b | 0.013 ± 0.001 a | 0.39 ± 0.05 a | 0.7 ± 0.1 a | nd a | nd a |
| CS | 0.25 ± 0.04 a | 0.089 ± 0.015 a | 0.26 ± 0.03 ab | 2.6 ± 0.6 b | 0.01 ± 0.00 a | 0.28 ± 0.06 ab | 0.013 ±0.002 a | 0.75 ± 0.07 ab | 1.8 ± 0.4 b | 0.07 ± 0.01 ab | 0.01 ± 0.00 a |
Results expressed as mg/g extract (n = 9). GRA: Graciano, MAZ: Mazuelo, TEM: Tempranillo, GAR: Garnacha, CHA: Chardonnay and CS: Cabernet Sauvignon. Different letters in the same column and within the same vintage, indicate significantly different results among varieties (ANOVA, significance level: 0.05). nd, not detected.
In the 2016 vintage, grape stem extracts of the studied varieties showed different phenolic profiles. Moreover, the concentration of individual compounds showed significant differences among them, with the exception of ellagic acid, which presented similar concentration levels in samples from different varieties. Regarding samples from each variety, Graciano stem extract presented the highest values in anthocyanins, procyanidin B1, catechin and trans-resveratrol, while Mazuelo stem extract was richer in gallic acid, ε-viniferin, quercetin and quercetin-3-derivative. Garnacha samples presented the lowest values of all the phenolic compounds analyzed, especially of the unknown anthocyanin, quercetin-3-derivative and caftaric acid. Finally, extracts from Tempranillo stems presented similar concentration than Garnacha extracts in all components with the exception of anthocyanins, caftaric acid, quercetin and its derivative, which presented significantly higher values.
In 2018, stem extracts from Mazuelo variety presented the highest values of procyanidin B1, resveratrol, gallic acid, quercetin and quercetin-3-derivative, and extracts from Tempranillo stems were the richest in anthocyanins. It should be point out that stem extracts from Chardonnay (the only white variety analyzed in this work) showed the lowest concentrations of all the components with the exception of stilbenes (ε-viniferin and trans-resveratrol). This is in line with Gouvinhas et al. [10] who compared several research works and concluded that, despite some exceptions, grape stems from red varieties have significantly higher values of phenolic compounds than stems from white varieties.
When comparing the phenolic composition of grape stem extracts of the same variety but from two different vintages, most of the polyphenols showed significantly higher concentrations in extracts from the 2018 vintage than from the 2016 vintage (see Table 3). In the case of Garnacha stem extracts, only catechin and the unknown anthocyanin showed similar values in both vintages, while in the case of Tempranillo stem extracts, catechin, ε-viniferin, procyanidin B1 and trans-resveratrol were the phenolic compounds that kept similar values from one vintage to another (see Figure S4 in Supplementary Material). Finally, Mazuelo stems showed higher values of all the phenolic compounds in 2018 than in 2016 with the exception of ε-viniferin that presented lower values in 2018 than in 2016. Nevertheless, and despite the fact that most of the phenolic compounds increased in concentration from one vintage to another, it can be observed that not all of them presented the same enhancement.
In order to better understand the behavior of each phenolic compound, results of grape stem extracts from Mazuelo, Garnacha and Tempranillo varieties were subjected to a principal component analysis (PCA) (Figure 1). As it can be seen in Figure 1a, PCA grouped the variables under study into four different clusters. The first one is composed by both anthocyanins quantified in this work. As we move along the plane in clockwise direction, the following cluster is composed by ellagic and caftaric acid, the third cluster by quercetin and its derivative, gallic acid, catechin and procyanidin B1, and the fourth cluster is defined by the two stilbenes, ε-viniferin and trans-resveratrol. In both Figure 1a,b, the OX axis is explained by the phenolic composition, so it only informs about the increase of the concentration of phenolic compounds from 2016 to 2018. In Figure 1b (individuals chart) it can be seen that grape stem extracts from vintage 2018 are shifted to the right of the OX axis, what indicates that those samples presented higher concentrations of phenolic compounds than their counterparts of the 2016 vintage.
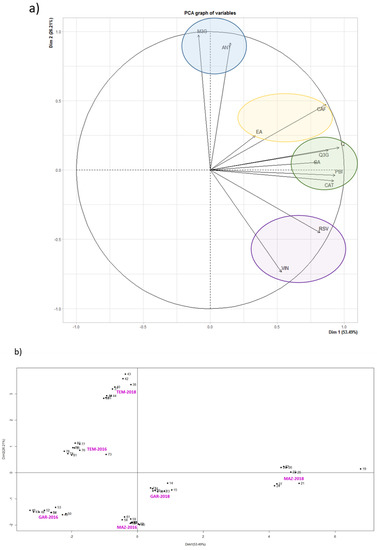
Figure 1. Principal component analysis (PCA) of phenolic compounds of grape stem extracts from Mazuelo, Garnacha and Tempranillo varieties from vintages 2016 and 2018. (a) Variables graph: GA (gallic acid); CAT (catechin); Q (quercetin); Q3G (quercetin-3-derivative); M3G (malvidin-3-glucoside); ANT (unknown anthocyanin); RSV (trans-resveratrol); VIN (ε-viniferin); CAF (caftaric acid); EA (elagic acid); PB1 (procyanidin B1); (b) Individuals factor map. Individuals (Mazuelo 2016 and Mazuelo 2018; Graciano 2016 and Graciano 2018; Tempranillo 2016 and Tempranillo 2018) are presented in pink color.
Nevertheless, and despite that the concentration of all variables increased from 2016 to 2018, the phenolic compounds contained in the third cluster were the most affected from the “vintage” factor. Therefore, gallic acid, quercetin, quercetin-3-derivative, catechin and procyanidin B1 presented the highest increase in concentration from 2016 and 2018, and this effect is particularly remarkable in Mazuelo stem extracts (Figure 1b).
On the other hand, it can be observed that both malvidin-3-glucoside and the unknown anthocyanin, which correspond to the first PCA cluster, are the compounds that best reflect the position of Tempranillo stem extracts in Figure 1b. It seems that grape variety has a more decisive influence on the concentration of these compounds in grape stems than vintage. Similar conclusions can be obtained for both stilbenes, as the variation in concentration levels of both trans-resveratrol and ε-viniferin is higher among varieties than between vintages. In the case of stilbenes, it also seems that these compounds are the phenolics least affected by weather conditions during grape development and veraison, since there has hardly been variation in their concentration from one year to another in any of the varieties studies in comparison with the rest of phenolic compounds analyzed.
In view of all these results, it could be concluded that the biosynthesis and accumulation of anthocyanins in grape stems between vintages is not correlated with either the behavior observed for the flavan-3-ols (catechin), proanthocyanidins (procyanidin B1), flavonols (quercetin and its derivative) and hydroxybenzoic acid (gallic acid), or the stilbenes (trans-resveratrol and ε-viniferin) analyzed in the present work, so they are not equally affected by the same factors.
Finally, it is noteworthy that the compounds corresponding to each cluster are related by its chemical structure. This could mean that the influence of the environmental factors such as light, temperature and precipitations have different impact on the polyphenols depending on the family of the specific compound. Although the comparison of the results obtained in the present study with other works is very difficult as each study consider distinct factors and use different protocols, other authors also found different influence of environmental factors on the synthesis and accumulation of the different families of phenolic compounds. Therefore, Blancquaert et al. [28] studied the evolution of flavonoids under altered temperature and light conditions of grapes during ripening in two different vintages. Although they studied the evolution of flavonoids in grape and not in grape stem, they also found different behavior between anthocyanins and flavonols. They concluded that the reduction of UV-B light significantly decreases the amount of flavonol biosynthesis, while this parameter has low influence in the case of anthocyanins, being both light and temperature the main factors that affect their synthesis and accumulation. Teixeira et al. [29] have also concluded that there exists different behavior between anthocyanins and proanthocyanidins with temperature and radiation, and identified flavan-3-ol compounds and proanthocyanidins as the most stable phenolics under diverse growing conditions.
3. Conclusions
The results showed that there exist significant differences in antioxidant activity, TPC and TF among grape stem from different varieties, and also between stems from the same grape variety but different vintages. The year that presented the highest number of days with extreme temperature conditions and accumulated precipitations during the time of grape development, veraison and ripeness (2016), was also the year in which the grape stems presented the lowest TPC, TF, antioxidant activity and concentration values of individual phenolic compounds. Regarding individual phenolic compounds, in general, Mazuelo presented higher concentration values of the different phenolic compounds than Garnacha and Tempranillo. It was also found that climatic conditions during the specified period of time had different impact on the synthesis of polyphenols depending on the family of the specific compound. Specifically, quercetin and its derivative, catechin, procyanidin B1 and gallic acid were the compounds most affected from one vintage to another, while the stilbenes presented a marked varietal component, since there has hardly been variation in their concentration from one year to another in any of the varieties studied in comparison with the rest of phenolic compounds analyzed.
In view of these results, it is important to consider that not only the variety can have a deep impact on the phenolic composition of a grape stem extract. Changes in the phenolic composition within the same variety among different vintages could significantly determine the future application of their corresponding extract. Therefore, the knowledge of the composition of grape stem extracts of different grape varieties and vintages is very important, as offers the possibility to select the most suitable application for each extract.
This entry is adapted from the peer-reviewed paper 10.3390/biom11081221
References
- FAO. El Estado Mundial de La Agricultura y La Alimentación 2012; FAO: Rome, Italy, 2012.
- Rajha, H.N.; El Darra, N.; Hobaika, Z.; Boussetta, N.; Vorobiev, E.; Maroun, R.G.; Louka, N. Extraction of Total Phenolic Compounds, Flavonoids, Anthocyanins and Tannins from Grape Byproducts by Response Surface Methodology. Influence of Solid-Liquid Ratio, Particle Size, Time, Temperature and Solvent Mixtures on the Optimization Process. Food Nutr. Sci. 2014, 5, 397–409.
- Cheng, V.J.; Bekhit, A.E.-D.A.; Sedcole, R.; Hamid, N. The Impact of Grape Skin Bioactive Functionality Information on the Acceptability of Tea Infusions Made from Wine By-Products. J. Food Sci. 2010, 75, S167–S172.
- Arvanitoyannis, I.S.; Ladas, D.; Mavromatis, A. Potential uses and applications of treated wine waste: A review. Int. J. Food Sci. Technol. 2006, 41, 475–487.
- Pardo, J.E.; Fernández, E.; Rubio, M.; Alvarruiz, A.; Alonso, G.L. Characterization of grape seed oil from different grape varieties (Vitis Vinifera L.). Eur. J. Lipid Sci. Technol. 2009, 111, 188–193.
- Sánchez-Gómez, R.; Zalacain, A.; Alonso, G.L.; Salinas, M.R. Vine-shoot waste aqueous extracts for re-use in agricultura obtained by different extraction techniques: Phenolic, volatile and mineral compounds. J. Agric. Food Chem. 2014, 62, 10861–10872.
- Anastasiadi, M.; Pratsinis, H.; Kletsas, D.; Skaltsounis, A.-L.; Haroutounian, S.A. Grape stem extracts: Polyphenolic content and assessment of their in vitro antioxidant properties. LWT Food Sci. Technol. 2012, 48, 316–322.
- Rajha, H.N.; Boussetta, N.; Louka, N.; Maroun, R.G.; Vorobiev, E. A comparative study of physical pretreatments for the extraction of polyphenols and proteins from vine shoots. Food Res. Int. 2014, 65, 462–468.
- Blackford, M.; Comby, M.; Zeng, L.; Dienes-Nagy, Á.; Bourdin, G.; Lorenzini, F.; Bach, B. A Review on Stems Composition and Their Impact on Wine Quality. Molecules 2021, 26, 1240.
- Gouvinhas, I.; Queiroz, M.; Rodrigues, M.; Barros, A.I.R.N.A. Evaluation of the phytochemistry and biological activity of grape (Vitis Vinifera L.) stems: Toward a sustainable winery industry. In Polyphenols in Plants, 2nd ed.; Watson, R.R., Ed.; Elsevier Inc.: Amsterdam, The Netherlands, 2019; pp. 381–394.
- Ruiz-Moreno, M.J.; Raposo, R.; Cayuela, J.M.; Zafrilla, P.; Piñeiro, Z.; Rojas, J.M.M.; Mulero, J.; Puertas, B.; Girón, F.; Guerrero, R.F.; et al. Valorization of grape stems. Ind. Crops Prod. 2015, 63, 152–157.
- Barros, A.; Gironés-Vilaplana, A.; Teixeira, A.; Collado-González, J.; Moreno-Fernández, D.; Gil-Izquierdo, A.; Rosa, E.; Domínguez-Perles, R. Evaluation of grape (Vitis vinifera L.) stems from Portuguese varieties as a resource of (poly)phenolic compounds: A comparative study. Food Res. Int. 2014, 65, 375–384.
- Domínguez-Perles, R.; Guedes, A.; Queiroz, M.; Silva, A.M.; Barros, A.I.R.N.A. Oxidative stress prevention and an-ti-apoptosis activity of grape (Vitis vinifera L.) stems in human keratinocytes. Food Res. Int. 2016, 87, 92–102.
- Leal, C.; Gouvinhas, I.; Santos, R.A.; Rosa, E.; Silva, A.M.; Saavedra, M.J.; Barros, A. Potential application of grape (Vitis vinifera L.) stem extracts in the cosmetic and pharmaceutical industries: Valorization of a by-product. Ind. Crops Prod. 2020, 154, 112675.
- Dias, C.; Domínguez-Perles, R.; Aires, A.; Teixeira, A.; Rosa, E.; Barros, A.; Saavedra, M.J. Phytochemistry and activity against digestive pathogens of grape (Vitis vinifera L.) stem’s (poly)phenolic extracts. LWT Food Sci. Technol. 2015, 61, 25–32.
- Poveda, J.M.; Loarce, L.; Alarcón, M.; Díaz-Maroto, M.C.; Alañón, M.E. Revalorization of winery by-products as source of natural preservatives obtained by means of green extraction techniques. Ind. Crops Prod. 2018, 112, 617–625.
- Gouvinhas, I.; Pinto, R.; Santos, R.A.; Saavedra, M.J.; Barros, A. Enhanced phytochemical composition and biological activities of grape (Vitis vinifera L.) Stems growing in low altitude regions. Sci. Hortic. 2020, 265, 109248.
- Teixeira, A.; Baenas, N.; Dominguez-Perles, R.; Barros, A.; Rosa, E.; Moreno, D.A.; Garcia-Viguera, C. Natural Bioactive Compounds from Winery By-Products as Health Promoters: A Review. Int. J. Mol. Sci. 2014, 15, 15638–15678.
- Quero, J.; Jiménez-Moreno, N.; Esparza, I.; Osada, J.; Cerrada, E.; Ancín-Azpilicueta, C.; Rodríguez-Yoldi, M. Grape Stem Extracts with Potential Anticancer and Antioxidant Properties. Antioxidants 2021, 10, 243.
- Esparza, I.; Martínez-Inda, B.; Cimminelli, M.J.; Jimeno-Mendoza, M.C.; Moler, J.A.; Jiménez-Moreno, N.; Ancín-Azpilicueta, C. Reducing SO2 Doses in Red Wines by Using Grape Stem Extracts as Antioxidants. Biomolecules 2020, 10, 1369.
- Moreira, M.M.; Barroso, M.F.; Porto, J.V.; Ramalhosa, M.J.; Svarc-Gajic, J.; Estevinho, L.; Morais, S.; Delerue-Matos, C. Poten-tial of Portuguese vine shoot wastes as natural resources of bioactive compounds. Sci. Total Environ. 2018, 634, 831–842.
- Jiménez-Moreno, N.; Volpe, F.; Moler, J.A.; Esparza, I.; Ancín-Azpilicueta, C. Impact of Extraction Conditions on the Phenolic Composition and Antioxidant Capacity of Grape Stem Extracts. Antioxidants 2019, 8, 597.
- Teixeira, N.; Mateus, N.; Freitas, V.; Oliveira, J. Wine industry by-product: Full polyphenolic characterization of grape stalks. Food Chem. 2018, 268, 110–117.
- González-Centeno, M.R.; Jourdes, M.; Femenia, A.; Simal, S.; Roselló, C.; Teissedre, P.L. Proanthocyanidin composition and antioxidant potential of the stem winemaking byproducts from 10 different grape varieties (Vitis vinifera L.). J. Agric. Food Chem. 2012, 60, 11850–11858.
- Souquet, J.-M.; Labarbe, B.; Le Guernevé, C.; Cheynier, V.; Moutounet, M. Phenolic Composition of Grape Stems. J. Agric. Food Chem. 2000, 48, 1076–1080.
- Marchante, L.; Gómez Alonso, S.; Alañón, M.E.; Pérez-Coello, M.S.; Díaz-Maroto, M.C. Natural extracts from fresh and ov-en-dried winemaking by-products as valuable source of antioxidant compounds. Food Sci. Nutr. 2018, 6, 1564–1574.
- Silva, V.; Igrejas, G.; Falco, V.; Santos, T.P.; Torres, C.; Oliveira, A.M.; Pereira, J.; Amaral, J.; Poeta, P. Chemical composition, antioxidant and antimicrobial activity of phenolic compounds extracted from wine industry by-products. Food Control. 2018, 92, 516–522.
- Blancquaert, E.H.; Oberholster, A.; Ricardo-Da-Silva, J.M.; Deloire, A.J. Grape Flavonoid Evolution and Composition Under Altered Light and Temperature Conditions in Cabernet Sauvignon (Vitis vinifera L.). Front. Plant Sci. 2019, 10, 1062.
- Teixeira, A.; Eiras-Dias, J.; Castellarin, S.D.; Gerós, H. Berry Phenolics of Grapevine under Challenging Environments. Int. J. Mol. Sci. 2013, 14, 18711–18739.
This entry is offline, you can click here to edit this entry!