1. Introduction
Lipopolysaccharide (LPS) is a component of the outer membrane of gram-negative bacteria and is known to induce a variety of inflammatory reactions through Toll-like receptor 4 (TLR4). Injection of LPS into human blood elicits an inflammatory response [
1,
2], but it was thought that LPS is rarely detected in human blood, except under pathological conditions such as infection and colitis. However, in 2007, Cani et al. showed that mice fed with a high-fat diet had higher blood LPS levels than normal chow-fed mice, resulting in inflammation of the liver and adipose tissue, which led to the development of NAFLD and insulin resistance, and the authors defined this condition as metabolic endotoxemia [
3]. Since then, studies on metabolic endotoxemia have been conducted for a variety of diseases. It has been reported that blood LPS levels are higher in humans with obesity [
4], type 2 diabetes [
5], NAFLD [
6], pancreatitis [
7], amyotrophic lateral sclerosis [
8], and Alzheimer’s disease [
8] than those in healthy individuals. Although the causal relationship between metabolic endotoxemia and disease onset is unclear, it is expected to be an interesting target in the future from the viewpoint of disease prevention and treatment. In recent years, the association between metabolic endotoxemia and dietary factors, and the mechanism by which fat intake induces metabolic endotoxemia have been actively studied. In contrast, dietary factors that suppress metabolic endotoxemia have also been explored.
2. Fat Intake and Metabolic Endotoxemia
2.1. Dysbiosis
As Cani et al. reported an increase in blood LPS levels due to a high-fat diet in mice, the mechanism of LPS influx by fat ingestion has been investigated. LPS content both in cecal contents and blood was concomitantly increased by fat ingestion [
9], and this increase of LPS was suppressed with oral administration of intestinal alkaline phosphatase, a LPS inactivating enzyme [
9]. Oral administration of ampicillin and neomycin, broad-spectrum antibiotics that are poorly absorbed, also suppressed the increase in blood LPS concentration induced by a high-fat diet [
10]. These reports suggest that intestinal bacteria are an important source of LPS. In particular, Cani et al. demonstrated changes in intestinal flora (reduction in Bacteroides, Bifidobacterium, and Eubacterium) due to a high-fat diet. Thus, dysbiosis of the intestinal flora due to a high-fat diet has attracted attention as a possible cause for metabolic endotoxemia. Changes in the intestinal bacteria due to ingestion of a high-fat diet have been studied in animals and humans and have been summarized in a review by Netto Candido et al. [
11]. In animals, it has been reported that a high-fat diet increases the proportion of Firmicutes, Proteobacteria, and the ratio of Firmicutes to Bacteroidetes. On the other hand, in humans, it has been reported that high-fat dietary intake increases the proportion of Bacteroidetes and decreases the proportion of Firmicutes and Proteobacteria. One possible cause of the different changes in the gut microbiota at the phylum level (e.g., Firmicutes, Bacteroidetes, Proteobacteria) in human and animal studies is the difference in the type of fat consumed. The high-fat diet used in animal experiments (e.g., Research Diets Inc., catalog# D12451) contains lard, while human studies assess fat intake in daily diets. Devkota et al. evaluated the gut microbiota in C57BL/6 mice fed a low-fat diet, a high-fat diet with lard, or a high-fat diet with milk fat for 21 days [
12]. In this experiment, both high-fat diets were isocaloric, rich in saturated fatty acids, and 37% of the ingested kcal were from fat. As a result, the proportion of Firmicutes increased and that of Bacteroidetes decreased in the gut microbiota of mice fed a high-fat diet containing lard, compared to mice fed a low-fat diet. In contrast, in mice fed a high-fat diet containing milk fat, the proportion of Firmicutes decreased and that of Bacteroidetes increased compared to the low-fat diet fed mice. Interestingly, Devkota et al. also identified specific bacteria that increased only by ingestion of a high-fat diet containing milk fat [
12]. Compared to mice fed a low-fat diet, or a high-fat diet containing lard, mice fed with a high-fat diet containing milk fat had increased proportions of Bilophila wadsworthia, a sulfite-reducing bacterium, in gut microbiota. They also elucidated the mechanism underlying this increase; intake of milk fat increased the level of taurocholic acid in bile. Bilophila wadsworthia populations increased by utilizing sulfur components in taurocholic acid, causing intestinal inflammation in mice. An increase in total fecal bile acid and a concomitant increase in Bilophila wadsworthia in the gut microbiota was also reported in humans upon dietary intake of animal fat [
13]. Natividad et al. also showed that increased Bilophila wadsworthia in mice fed a high-fat diet contributed to increased blood LPS levels (they measured soluble CD14 as a surrogate marker), increased fasting blood glucose levels, and the development of a fatty liver [
14]. As Helicobacter pylori was discovered as a pathogen in gastric cancer, some pathobionts may also exist for induction of metabolic endotoxemia (however, this cannot be detected by evaluating changes of the gut flora at the phylum levels). We further discuss the bacterial genera that are thought to be associated with metabolic endotoxemia in
Section 4. It is also necessary to consider dietary LPS as a source of LPS. For example, milk has been reported to contain high concentrations of LPS in some commercial products [
15]. Multiple animal studies have reported that ingested LPS may contribute to increased blood LPS levels. Specifically, Kaliannan et al. measured blood LPS levels 45 min after ingestion of LPS alone or corn oil and LPS in mice [
9]. It showed that blood LPS levels were elevated when corn oil and LPS were co-administered. Lindenberg et al. reported that LPS concentrations in the blood were higher in mice fed a high-fat diet containing LPS than in mice fed a high-fat diet without LPS [
16]. However, the effect of LPS levels in food on blood LPS levels has not been adequately studied in humans and further studies are needed.
2.2. Mechanisms of the Influx of LPS into the Bloodstream
The gut is protected by a barrier consisting of a mucin layer and epithelial cells. Thus, even if the number of gram-negative bacteria that produce LPS increases in the gut, it is unlikely that the bacterium itself will invade the body. The limulus amebocyte lysate assay used to measure LPS recognizes lipid A, a glycolipid moiety of LPS [
17], but because lipid A is embedded in the outer membrane of gram-negative bacteria [
18], elevated blood LPS levels suggest that LPS released from gram-negative bacteria is flowing into the blood. In an in vitro study with Escherichia coli, the concentration of free LPS in the culture medium increased with bacterial growth, but the addition of antibiotics stimulated further LPS release [
19]. In addition, Jin et al. suggested that treatment with penicillin and erythromycin killed the gram-negative bacteria, Bacteroides and γ-Proteobacteria, leading to increased blood LPS levels in mice [
20]. Radilla-Vázquez et al. conducted a correlation analysis of blood LPS levels with fecal Escherichia coli, Prevotella, and Bacteroides fragilis counts in humans and reported that the lower the number of gram-negative bacteria Escherichia coli, the higher the risk of increased blood LPS levels [
21]. These reports suggest that LPS release by lysis as well as the increase in gram-negative bacteria may be important factors in increasing blood LPS levels, which may contribute to the inconsistent relationship between changes in intestinal flora and blood LPS levels described above.
With respect to the influx of free LPS, Laugerette et al. reported that in an in vitro assay system using the intestinal epithelial cell line caco-2, LPS permeability to the basal side was increased in the presence of oleic acid, 2-oleoylglycerol, soybean lecithin, cholesterol, and sodium taurocholate [
22]. In addition, Clement-Postigo et al. reported a positive correlation between increased LPS levels in the chylomicron fraction and increased triglyceride concentration in serum up to 3 h after a high-fat meal [
23]. LPS uptake in chylomicrons has been observed by immunoelectron microscopy [
22]. These results suggest that released-LPS in the intestine is taken up into micelles during lipid absorption, and then LPS is absorbed from the intestine together with lipids. In mice, ingestion of a high-fat diet has been reported to increase intestinal permeability by inhibiting the mRNA expression of tight junction-related factors, zonula occludens-1 (ZO-1) and occludin in intestinal epithelial cells [
10]. This increase in intestinal permeability is markedly inhibited by antibiotic administration [
10], suggesting that it is not the direct effect of lipids but rather a change in intestinal flora. Indeed, secondary bile acids metabolized by enteric bacteria are known to inhibit expression of intestinal tight junction proteins [
24,
25]. Increased intestinal LPS has been reported to destroy the tight junction of intestinal epithelial cells through TLR4 [
26]. Although ingestion of a high-fat diet broadly enhances intestinal and colonic permeability [
27], permeability in the colon is closely related to increased blood LPS levels [
28,
29]. Therefore, disruption of the barrier function by a high-fat diet may have also contributed to the LPS inflow, and the colon may be important as a site of the absorption. The transit time of colonic contents is also probably important. In mice, Anitha et al. suggested that saturated fatty acids induced apoptosis of neurons in the large intestine, reduced peristalsis, induced constipation, and increased blood LPS levels [
30]. On the other hand, Reichardt et al. similarly evaluated peristalsis of the large intestine by ingestion of a high-fat diet, but did not observe a clear decrease in peristalsis and an increase in blood LPS levels [
31]. Anitha et al. and Reichardt et al. used high-fat diets where either 60% or 30%, respectively of ingested kcal came from fat. Although the ratio of fat to energy intake varied, it has been reported that blood LPS levels increased by consumption of a high-fat diet with 30% of kcal ingested being from fat [
32,
33]. Therefore, the reason for the lack of increase in blood LPS levels in the study of Reichardt et al. is not considered to be a difference in the fat content of the diet. Ingestion of a high-fat diet does not simply increase blood LPS levels, and retention time of colonic contents due to constipation may also contribute to absorption of LPS.
2.3. Kinetics and Activity of LPS
The LPS concentration in the portal blood is approximately 10 times higher than the LPS concentration in the peripheral blood [
34], suggesting that a part of the LPS released in the intestinal tract is flowing from the portal vein. On the other hand, LPS which is concomitantly absorbed with lipids binds to lipoproteins in chylomicrons via LPS-binding protein (LBP) [
35], and is thought to pass through the lymphatic system, flow into the blood stream from the left subclavian vein, and then circulate throughout the body. It is reported that blood LPS is bound to various lipoproteins, with plasma LPS concentrations of 31%, 30%, 29%, and 10% for the very low-density lipoprotein (VLDL) fraction, low-density lipoprotein (LDL) fraction, high-density lipoprotein (HDL) fraction, and free LPS, respectively [
36]. In addition, LPS bound to lipoproteins of HDL has been reported to be transferred to VLDL and LDL by LBP and phospholipid transfer protein [
37], suggesting that the LPS concentration of each lipoprotein fraction changes actively. There are several reports that bioactivity of LPS bound to lipoprotein varies with the type of lipoprotein. First, Vreugdenhil et al. evaluated the effect of chylomicrons, HDL, LDL, and VLDL on the production of tumor necrosis factor-α (TNF-α) from human peripheral blood mononuclear cells on LPS stimulation and showed that chylomicrons inhibited TNF-α production the most [
35]. Emansipator et al. reported that a mix of LPS with LDL or HDL decreased the spike recovery of LPS activity in the limulus amebocyte lysate test, and that incubation of LPS with apo A1 decreased the febrile response of rabbits when injected compared to those without apo A1 [
38]. In a study using human mononuclear cells [
39] and the mouse macrophage cell line Raw 264.7 [
40], it was reported that LPS bound to HDL showed reduced interleukin-6 (IL-6) and TNF-α production. VLDL has also been reported to inhibit LPS-induced activation of nuclear factor κB (NF-κB) [
41]. On the other hand, oxidized LDL has been shown to promote NFκB activation with LPS in macrophages [
42], suggesting that binding to lipoproteins not only decreases LPS activity but also may promote inflammatory responses.
Increased LPS content has been reported in the livers of mice fed a high-fat diet [
43], suggesting that the liver is an important site for LPS clearance. Ninety percent of the free LPS that entered the bloodstream is captured by liver resident macrophages (i.e., Kupffer cells) within 1 h [
44]. LPS bound to HDL attaches primarily to sinusoidal epithelial cells of the liver [
40,
44], but it shows slower blood kinetics than free LPS, with 50% present in plasma even 1 h after administration and the amount accumulated in the liver accounted for only 15% of the dose [
44]. LPS bound to HDL on the other hand is distributed widely to organs other than the liver, such as the kidney and adipose tissue [
44]. LPS accumulated in the liver is inactivated by acyloxyacyl hydroxylase produced by Kupffer cells regardless of free or HDL-bound form [
44]. Previously, in a mouse model of high-fat diet plus streptozotocin-induced non-alcoholic steatohepatitis-hepatocellular carcinoma, fecal LPS levels were continuously elevated from six weeks, while liver LPS levels were transiently elevated at eight weeks, followed by increased plasma LPS levels [
45]. This report suggests that the liver acts as the first barrier against LPS entering from the intestinal tract and that liver dysfunction leads to elevated blood LPS levels. Interestingly, LPS administration in mice increased the expression of apolipoprotein AIV in the liver via TLR4, suggesting that the liver has a mechanism to increase HDL production and protect itself against LPS stimulation [
46].
3. Dietary Factors that Decrease Blood LPS Levels
Previous reports investigating the effects of dietary factors on blood LPS levels are summarized in Table 1 (human interventional studies), Table 2 (human epidemiological studies) and Table 3 (animal studies). The findings about representative food categories are reviewed in the following sections.
Table 1. Dietary factors that have been evaluated for efficacy on blood lipopolysaccharide (LPS) levels in human interventional studies.
|
Category
|
Dietary Factor
|
Dose
|
Consumption Period
|
Subject
|
LPS
|
LBP
|
Gut Microbes with Significant Changes in Proportion **
|
|
Increase
|
Decrease
|
|
Probiotics/
Prebiotics
|
Yakult light
(Lactobacillus casei Shirota 1 × 10⁸ CFU/mL) [48]
|
195 mL
|
3 months
|
Metabolic syndrome
|
ND
|
↑
|
—
|
—
|
|
Low-fat yogurt
[49]
|
339 g
|
9 weeks
|
Healthy subject or Obesity
|
→
|
→
|
—
|
—
|
|
Low-fat yogurt
[50]
|
226 g
|
Premeal
|
Healthy subject or Obesity
(postprandial endotoxemia was assessed)
|
→
|
→
|
—
|
—
|
|
Oligofructose
[57]
|
21 g
|
12 weeks
|
Overweight/
Obesity
|
↓
|
—
|
—
|
—
|
|
Oligofructose-
enriched inulin
[58]
|
10 g
|
8 weeks
|
Type 2 diabetes
|
↓
|
—
|
—
|
—
|
|
Inulin +
Oligofructose
[59]
|
8 g
8 g
|
3 months
|
Obesity
|
→
|
—
|
Bifidobacterium,
Faecalibacterium prausnitzii
|
Bacteroides intestinalis,
Bacteroides vulgatus,
Propionibacterium
|
|
Galacto-
oligosaccharide
[60]
|
5.5 g
|
12 weeks
|
Type 2 diabetes
|
→
|
→
|
none
|
none
|
|
Galacto-
oligosaccharide
[61]
|
15 g
|
12 weeks
|
Overweight/
Obesity
|
—
|
→
|
Bifidobacterium spp.
|
none
|
|
α-Galacto-
oligosaccharide
[62]
|
6–18 g
|
14 days
|
Overweight
|
↓
|
—
|
Bifidobacteria
|
none
|
|
Resistant dextrin
[63]
|
10 g
|
8 weeks
|
Type 2 diabetes
|
↓
|
—
|
—
|
—
|
|
Insoluble dietary fiber
[from Fiber One Original cereal
(General mills)]
[64]
|
30 g
|
With high-fat, high-calorie meal
|
Healthy subject
(postprandial endotoxemia was assessed)
|
↓*
|
—
|
—
|
—
|
|
Whole grains
[65]
|
3 servings
|
6 weeks
|
Overweight/
Obesity
|
—
|
↓
|
none
|
none
|
|
Probiotics/
Prebiotics
|
Bifidobacterium longum +
Oligofructose +
Life style modification
[110]
|
—
|
24 weeks
|
Non-alcoholic steatohepatitis
|
↓
|
—
|
—
|
—
|
|
Polyphenol
|
Resveratrol +
Polyphenol
[72]
|
100 mg
75 mg
|
10 minutes before intake of high-fat high-carbohydrate meal
|
Healthy subjects
(postprandial endotoxemia was assessed)
|
—
|
↓ *
|
—
|
—
|
|
Red wine
[73]
|
272 mL
|
With high-fat meal
|
Healthy subjects
(postprandial endotoxemia was assessed)
|
→
|
→
|
—
|
—
|
|
Dietary habits
|
Fruits +
Vegetables
[65]
|
3 servings
|
6 weeks
|
Overweight/
Obesity
|
—
|
↓
|
α-diversity
(No significant change in bacterial genera was found)
|
none
|
|
Caloric restriction
[107]
|
800 kcal
|
4 weeks
|
Obesity
|
—
|
↓
|
Anaerostipes hadrus,
Blautia sp.,
Ruminococcus faecis,
Bifidodbacterium sp.
|
Agathobacter rectalis
|
|
Others
|
Glutamine
[85]
|
30 g
|
14 weeks
|
Overweight/
Obesity
|
↓
|
—
|
—
|
—
|
ND: Not detected, —: No data, ↑: Significantly increased, →: Not significantly changed, ↓: Significantly decreased, *: Attenuation of postprandial endotoxemia, **: The bacteria mentioned by the author in the paper are listed.
Table 2. Correlation of dietary factors, gut microbes, and blood LPS levels in human epidemiological studies.
|
Subject
|
Number of Subject
|
Correlation of
Dietary Factor and Gut Microbe *
|
Correlation of
Blood LPS and Gut Microbe
|
Correlation of
Blood LPS and Dietary Factor
|
|
Over-
weight pregnant women
[111]
|
88
|
P
|
Dietary fiber vs.
|
diversity, richness, Firmicutes in unidentified family of order Clostridiales, Barnciellaceae family belonging to the phylum Bacteroidetes
|
P
|
none
|
P
|
none
|
|
Vitamin A,
β-Carotene vs.
|
Firmicutes
|
|
N
|
Fat vs.
|
diversity, richness, Barnsiellaceae
|
N
|
none
|
N
|
none
|
|
Healthy subjects
[86]
|
150
|
N
|
25-Hydroxy vitamin D vs.
|
Coprococcus, Bifdobacterium
|
N
|
LPS vs.
|
Faecalibacterium
|
N
|
LPS
vs.
|
25-Hydroxy vitamin D
|
|
Type 1 diabetes
[105]
|
668
|
—
|
—
|
—
|
—
|
—
|
—
|
N
|
LPS
vs.
|
Dietary pattern; “Fish”(frequently eat fish dishes), “Healthy snack” (frequently eat fruits, berries, fresh vegetable, yoghurt, low-fat cheese, and do not drink much soft drinks), “Modern”(frequently eat poultry, pasta, rice, meat dishes, fried and grilled foods, and fresh vegetables)
|
—: No data, P: Positive correlation, N: Negative correlation, LPS: lipopolysaccharide, *: The bacteria mentioned by the author in the paper are listed.
Table 3. Dietary factors that have been evaluated for efficacy on blood LPS levels in animal interventional studies.
|
Category
|
Dietary Factor
|
Dose
|
Administration Period
|
Model
|
LPS
|
LBP
|
Significant Change in
Gut Microbiota
|
|
Probiotics/
Prebiotics
|
Lactobacillus rhamnosus GG
[51]
|
1 × 10⁸ CFU/day
|
12 weeks
|
HFD-fed ApoE KO mouse
|
↓
|
—
|
no
|
|
Lactobacillus rhamnosus CNCM I-4036
[52]
|
1 × 10¹⁰ CFU/day
|
30 days
|
Chow diet-fed
Zucker-Lepfa/fa rat
|
—
|
↓
|
—
|
|
Lactobacillus sakei OK67 +/−
Lactobacillus sakei PK16
[53]
|
1 × 10⁹ CFU/day
1 × 10⁹ CFU/day
|
4 weeks
|
HFD-fed
C57BL/6 mouse
|
↓
|
—
|
yes
|
|
Bifidobacterium longum BR-108
(sterilized)
[54]
|
200, 400 mg/kg/day
|
4 weeks
|
HFD-fed
C57BL/6J mouse
|
↓
|
—
|
yes
|
|
Bifidobacterium infantis +
Lactobacillus acidophilus +
Bacillus cereus
[55]
|
0.5 × 10⁶ CFU/day
0.5 × 10⁶ CFU/day
0.5 × 10⁵ CFU/day
|
12 weeks
|
HFHSD-fed
SD rat
|
↓
|
—
|
yes
|
|
Lactobacillus plantarum LC27 +/−
Bifidobacterium longum LC67
[43]
|
1 × 10⁹ CFU/day each
(or 0.75 × 10⁹ (LC27) + 0.25×10⁹ (LC67) CFU/day in mix)
|
4 weeks
|
HFD-fed
C57BL/6 mouse
|
↓
|
—
|
yes
|
|
Oligofructose
[112]
|
10% (mixed in diet)
|
12 weeks
|
HFHSD-fed
SD rat
|
↓
|
—
|
yes
|
|
Galacto-
oligosaccharide
[84]
|
800 mg/kg/day
|
8 weeks
|
HFD-fed
SD rat
|
↓
|
—
|
yes
|
|
Inulin
[113]
|
5% (intragastric administration, sample volume was not described)
|
6 weeks
|
standardized diet (kcal %: 10% fat, 20% protein, and 70% carbo- hydrate; 3.85 kcal g−1)-fed db/db mouse
|
↓
|
—
|
yes
|
|
Wheat-derived arabinoxylan
[114]
|
7.5% (mixed in diet)
|
8 weeks
|
HFD-fed
C57BL/6J mouse
|
↓
|
—
|
—
|
|
Polyphenols
|
Grape seed proanthocyanidin
[33]
|
500 mg/kg/day
|
10 days (prophylactic) or
17 weeks (with cafeteria diet)
|
Cafeteria diet
(high-fat/high carbohydrate diet)-fed Wistar rat
|
↓
|
—
|
—
|
|
Grape-seed proanthocyanidin
[29]
|
100, 500 mg/kg/day
|
2 weeks
|
Cafeteria diet
(high saturated-fat/high refined-carbohydrate diet)-fed Wistar rat
|
↓
|
—
|
—
|
|
Resveratrol
[74]
|
50, 75, 100 mg/kg/day
|
16 weeks
|
HFD-fed
C57BL/6 mouse
|
↓
|
↓
|
yes
|
|
Apple-derived polymeric procyanidins
[75]
|
0.5% (administration route was not described)
|
20 weeks
|
HFHSD-fed
C57BL/6J mouse
|
↓
|
—
|
yes
|
|
Genistein
[76]
|
0.2% (mixed in diet)
|
6 months
|
HFD-fed
C57BL/6 mouse
|
↓
|
—
|
yes
|
|
Isoflavone
[77]
|
0.1% (mixed in diet)
|
5 weeks
|
HFD-fed
C57BL/6 mouse
|
↓
|
↓
|
yes
|
|
Syringaresinol
[78]
|
50 mg/kg/day
|
10 weeks
|
40-week-old
C57BL/6 mouse
|
—
|
↓
|
yes
|
|
Sulfated polysaccharide
|
Sea cucumber-derived sulfated polysaccharide
[80]
|
300 mg/kg/day
|
8 weeks
|
HFD-fed
BALB/c mouse
|
—
|
↓
|
yes
|
|
Sea cucumber-derived sulfated polysaccharide
[81]
|
300 mg/kg/day
|
42 days
|
Chow-fed
BALB/c mouse
|
—
|
↓
|
yes
|
|
Acaudina molpadioides-derived fucosylated chondroitin sulfate
[82]
|
80 mg/kg/day
|
10 weeks
|
HFD-fed
C57BL/6J mouse
|
↓
|
—
|
yes
|
|
Chicken-derived chondroitin sulfate
[83]
|
150 mg/kg/day
|
16 days
|
Exhaustive exercise stress model
BALB/c mouse
|
↓
|
—
|
yes
|
|
Fucoidan
[84]
|
100 mg/kg/day
|
8 weeks
|
HFD-fed
SD rat
|
↓
|
—
|
yes
|
|
Other dietary components
|
Tetrahydro iso-alpha acid
(included in hops)
[88]
|
0.1% (mixed in diet)
|
8 weeks
|
HFD-fed
C57BL/6J mouse
|
↓
|
—
|
—
|
|
Rhein (included in rhubarb)
[89]
|
120 mg/kg/day
|
6 weeks
|
HFD-fed
C57BL/6J mouse
|
↓
|
—
|
yes
|
|
Phlorizin (included in apple)
[90]
|
20 mg/kg/day
|
10 weeks
|
Chow-fed
db/db mouse
|
↓
|
—
|
yes
|
|
Capsaicin
[91]
|
0.01% (mixed in diet)
|
12 weeks
|
HFD-fed
C57BL/6J mouse
|
↓
|
—
|
yes
|
|
Rutin
[92]
|
0.64% (mixed in diet)
|
20 weeks
|
HFD-fed
C57BL/6J mouse
|
↓
|
—
|
yes
|
|
Lycopene
[93]
|
0.03% (mixed in diet)
|
10 weeks
|
HFD and fructose-fed C57BL/6 J mouse
|
↓
|
—
|
—
|
|
Other extracts/dietary components
|
Broccoli sprout extract
[94]
|
2.2% (mixed in diet)
|
14 weeks
|
HFD-fed
C57BL/6JSlc mouse
|
↓
|
↓
|
yes
|
|
Camu camu extract
[96]
|
200 mg/kg/day
|
8 weeks
|
HFHSD-fed
C57BL/6J mouse
|
↓
|
—
|
yes
|
|
Other extracts/dietary components
|
Cranberry extract
[95]
|
200 mg/kg/day
|
8 weeks
|
HFHSD-fed
C57BL/6J mouse
|
↓
|
—
|
yes
|
|
Green tea extract
[34]
|
2% (mixed in diet)
|
8 weeks
|
HFD-fed
C57BL/6J mouse
|
↓
|
—
|
yes
|
|
Tartary buckwheat protein
[32]
|
23.5% (mixed in diet)
|
6 weeks
|
HFD-fed
C57BL/6 mouse
|
↓
|
—
|
yes
|
|
Foods
|
Cocoa
[97]
|
8% (mixed in diet)
|
18 weeks
|
HFD-fed
C57BL/6J mouse
|
↓
|
—
|
—
|
|
Nopal
[98]
|
5% of dietary fiber was replaced with those of nopal-derived (mixed in diet)
|
1 month
|
HFHSD-fed
Wistar rat
|
↓
|
—
|
yes
|
|
Steamed fish meat
[99]
|
Ad libitum
(9:00–12:00 and 18:00–21:00)
|
8 weeks
|
Chow-fed
C57BL/6 mouse
|
—
|
↓
|
yes
|
|
Chinese medicines
|
Geniposide +
Chlorogenic acid
[100]
|
90 mg/kg/day
1.34 mg/kg/day
|
4 weeks
|
HFD-fed
C57BL/6 mouse
|
—
|
↓
|
—
|
|
Potentilla discolor Bunge water extract
[101]
|
400 mg/kg/day
|
8 weeks
|
HFD-fed, streptozotocin-
injected
C57BL/6J mouse
|
↓
|
↓
|
yes
|
|
Ganoderma lucidum mycelium water extract
[102]
|
2–8 mg/day
|
8 weeks
|
HFD-fed
C57BL/6NCrlBltw mouse
|
↓
|
—
|
yes
|
|
Semen hoveniae extract
[103]
|
300, 600 mg/kg/day
|
8 weeks
|
Alcohol-containing Lieber-DeCarli diet-fed SD rat (Alcoholic liver disorder model)
|
↓
|
—
|
yes
|
|
Shenling Baizhu powder
[104]
|
30 g/kg/day
|
16 weeks
|
HFD-fed
SD rat
|
↓
|
—
|
yes
|
|
Caloric restriction
|
30% caloric restriction
[108]
|
—
|
62–141 weeks
|
HFD, LFD-fed
C57BL/6J mouse
|
—
|
↓
|
yes
|
|
40% caloric restriction
[109]
|
—
|
30 days
|
Chow-fed C57BL/6J mouse
|
↓
|
↓
|
yes
|
—: No data, HFD: High-fat diet, HFHSD: High-fat high-sucrose diet, ↑: Significantly increased, →: Not significantly changed, ↓: Significantly decreased.
4. Association of Dietary Factor-Induced Reduction of Blood LPS and Modulation of Gut Microbiota
Although few studies have evaluated the relationship between the effect of dietary factors on blood LPS and intestinal flora in humans, several studies have evaluated intestinal flora in oligosaccharide intervention studies (
Table 1). A common finding in these reports is an increase in Bifidobacterium. Bifidobacterium has been reported to enhance the intestinal tight junction by preserving claudin 4 and occludin localization at tight junctions, and inhibit permeability in mice with colitis [
115]. Similarly, in human colonic epithelial cell line T84, the addition of culture supernatant of Bifidobacterium has been reported to enhance barrier function through increased expression of tight junction protein, suggesting that some humoral factors contribute to improved intestinal barrier function [
116]. Increased expression of tight junction protein in Bifidobacterium-treated mice has been reported to be associated with increased short-chain fatty acids (acetic acid, butyric acid, and propionic acid) in the intestinal tract [
117]. These short-chain fatty acids have been reported in the human colonic epithelial cell line caco-2 to act as an energy source for epithelial cells to protect themselves, and also act as a histone deacetylase inhibitor which inhibit Nod-like receptor P3 inflammasomes to maintain the barrier function of epithelial cells [
118]. These results suggest that the increase in Bifidobacterium induced by oligosaccharide intake decreases blood LPS levels through the improvement of the barrier function of the intestinal tract. In addition, dietary factors that increase Bifidobacterium are expected to reduce blood LPS levels.
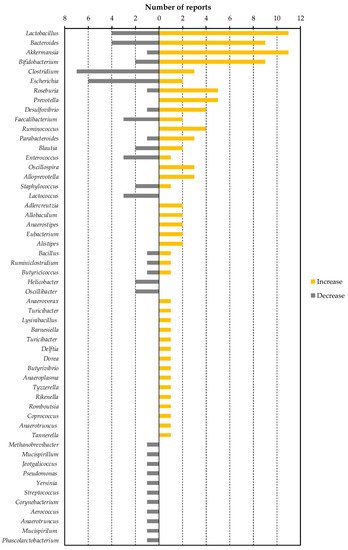
All of the dietary factors commonly lowered blood LPS or LBP levels in animals, as described in Table 3. In other words, by finding bacteria that have decreased or increased in many dietary factor intervention studies, we can find specific bacteria that contribute to the increase or decrease in blood LPS levels. To this end, we have organized the number of reports that show increases or decreases of each bacterial genus (Figure 1). We selected eight of these genera (Lactobacillus, Bacteroides, Akkermansia, Clostridium, Escherichia, Roseburia, Prevotella and Desulfovibrio) as bacteria included in a sufficient number (five or more) of reports, and a biased number of reports (Bifidobacterium was excluded because it was discussed above. Faecalibacterium was also excluded because there is almost no bias in the number of reports).
Figure 1. The number of reported changes of intestinal bacterial genera in dietary factor intervention studies in animals.
This entry is adapted from the peer-reviewed paper 10.3390/nu11102277