Food waste (FW) is one of the world’s major crises in both developed and developing countries. Up to 1.3 billion tons of food across the globe is thrown away each year, accounting for one third of all food produced for human consumption and presenting tremendous social, economic, and environmental challenges. In Thailand, FW causes a significant problem when it comes to waste management, particularly in metropolitan areas. Studies conducted between 2005 and 2009 indicated that FW made up the greatest proportion of all waste collected in Bangkok at between 42% and 45%. This waste was generated in households and was usually thrown away into garbage bins, to be collected and buried in landfills by governmental and private sector companies.
- food waste (FW)
- food supply chain
- Bangkok
1. Introduction
Systems of food production and consumption have become dynamically adapted to urban settings [1]. Factors such as increased income [2], dietary transition towards Westernized consumption patterns [3], modern retail diffusion [4], and time scarcity [5] impact the generation of FW in rapidly urbanizing localities.
Up to now, there has been no serious movement campaigning for household food waste reduction in Thailand. Waste separation is the only practice promoted by society, which has led to the apparent decrease in the amount of recyclable waste at MSW collection sites through a well-organized waste collection process. By contrast, the amount of FW has continued to increase due to lack of knowledge and proper understanding on household food management, so actions such as not eating whole portions, throwing away leftovers, or leaving food to rot become commonplace in households. However, if information is made available on how food loss and food waste is generated in households, the public gain more awareness and can then change their behavior [6]. These trends can be observed in other countries such as China [7][8], Pakistan [9], and Saudi Arabia [10].
It is important to distinguish between food loss and food waste and the circumstances of their occurrence, especially when identifying causes and developing solutions and interventions to address this issue [11]. According to the definition of FAO,
Food waste typically but not exclusively happens at the retail and consumer levels whereas food loss takes place at the earlier stages of the food supply chain—during production, post-harvest, and processing stages.
2. Food Waste (FW) Generation in Bangkok
Based on the data collected by our research team, it was found that the food supply chain is geographically separated—food production and most food manufacturing and wholesale centers are based outside of Bangkok, while consumption is carried out inside the city. Not much FW is generated during the production, processing, storage, and transportation stages. It was also found that data on municipal solid waste (MSW) include FW generated by retailers, street vendors, restaurants, and households. Subsequently, the official data on MSW and on the FW component of MSW collected between 2003 and 2018 were used to clarify the time-series changes in FW generation in Bangkok. However, owing to the lack of a systematic FW management system and data collection scheme, it is difficult to subdivide the material flow of FW in Bangkok accurately.
MSW refers to solid waste generated by municipal activities (including that by residences, supermarkets, retail shops, businesses, service providers, marketplaces, and institutions), which is collected and treated by the Bangkok Metropolitan Administration (BMA). Data on MSW and its composition are collected by officially published reports such as the Bangkok State of the Environment [12][13][14][15] and the State of Municipal Solid Waste of Thailand [16][17][18]. The total amount of MSW generation and the percentage of FW in MSW are shown in Figure 1, while FW generation and FW generation per capita are shown in Figure 2. Both the total amount of MSW generation and the percentage of FW in MSW increased between 2003 and 2018. Overall, FW generation doubled from 2860 tons per day in 2003 to 5669 tons per day in 2018. Per capita, it increased by 80% from 0.36 kg per day in 2003 to 0.65 kg per day in 2013 but then decreased to 0.45 kg per day in 2014 owing to the large population inflow (the population was estimated to be 6.82 million in 2013 and 9.06 million in 2014). FW then began to increase again from 2015 and reached 0.61 kg per day per person in 2018. Even supposing the 15 million daytime population was the total population, the per capita FW generation remains at 0.38 kg/day. In addition, the municipality of Bangkok collected an average of 10,705 tons of MSW a day, of which 59% was organic waste. Of the total MSW generated in 2018, 78.3% (8382 tons/day) was landfilled, 16.8% (1798 tons/day) was treated by composting plants, and 4.9% (525 tons/day) was incinerated based on a report by a sanitation technical officer at the BMA’s Department of Environment [6]. The amount of FW generated compared with other large cities (Hanoi, Surabaya, and Phnom Penh) in Southeast Asian developing countries and developed countries can found in [6].
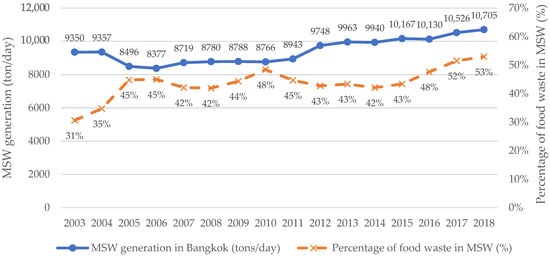
Figure 1. Bangkok MSW generation and ratio of FW from 2003 to 2018. Source: Compiled by the authors.
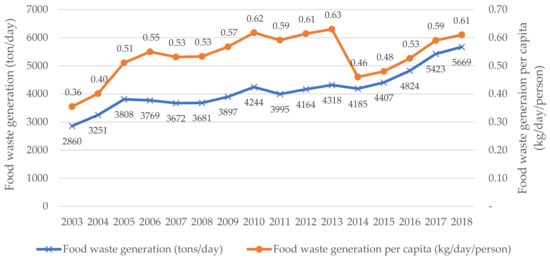
Figure 2. Bangkok FW generation per capita from 2003 to 2018. Source: Compiled by the authors.
The Department of Environment (DOE), under the BMA, and the Environment and Sanitation Section of each district office are authorities responsible for overall environmental management. Currently, the BMA possesses 2031 waste collection trucks in total. These can be classified into five types including 2-ton compacting truck, 5-ton compacting truck, 8-cubic meter lifting truck, 6-ton dumping truck, and 1.5-ton side loading truck. There are 2587 collection drivers, 7591 collection staff, and 9042 street sweepers [19][20]. The DOE then allocates these resources to districts for waste collection and transportation. The MSW collection and transportation process starts after residents put generated waste, either sorted or unsorted, in a container in front of their households or at designated locations. Then, waste collection staff collect disposed waste as scheduled. All the MSW is then transported to three MSW transfer stations—Saimai, Onnut, and Nongkhaem—based on distance of transportation [21][22]. The current fee for waste collection services (THB 80 or less than USD 3 per month) does not provide an incentive to reduce and separate waste, so there is room to consider a system that can properly collect fees based on volume such as using special garbage bags [23].
3. Causes of Food Waste Generation
In households, FW mismanagement and lack of proper planning are the main reasons for food loss. This loss generally means the decrease in edible food products throughout the supply chain, from manufacturing and transportation to human consumption. Most of the food loss occurs at the end of the supply chain (retail and consumption). FW also includes edible leftovers that are thrown away to feed animals. It therefore excludes inedible or undesirable portions of foodstuffs [24][25][26][27]. The causes of household food waste generation are summarized in Table 1. A recent survey on household lifestyles in Bangkok reveals the similar ways in which consumers generate FW [6]. For example, sources of FW generation in Bangkok by consumers are distributed widely in the supply chain owing to diverse eating habits; most consumers often or sometimes waste food for various reasons when eating in, consuming ready-to-eat meals, and eating out; time scarcity prevents people paying attention to food and FW, particularly on weekdays.
Table 1. Causes of household food waste generation.
| Causes | Explanation and Support Evidence |
|---|---|
 Planning |
Over-purchasing and lack of planning are among the factors that lead to an increase in household FW. Most consumers who do not plan their food purchases are likely to buy more food than they need [28]. Lee and Willis’s study [29] in the UK discovered that 5.3 million tons, or 64% of household food waste, is avoidable. In addition, a survey in Germany also showed that 59% of household food waste comes from ill-organized planning and suboptimal food storage. By age group, teenagers are less likely than adults to plan their food purchasing in advance [30]. Good pre-shopping planning or using shopping lists are some efficient ways to prevent excessive spending [31] particularly in reducing over-purchase [30]. |
 Food date labeling |
Confusion over shelf-life and expiry dates on food labels, such as ‘best before’ date or ‘use by’ date, means that plenty of edible food is unnecessarily thrown away [32]. ‘Best before’ labels show the date before which products still retain good qualities in terms of color and taste when kept under proper conditions. The labels, however, do not indicate spoilage of products. When a product goes past its regulated specified date, consumers can choose whether they want to eat it or not by considering its color and taste. In contrast, a ‘use by’ date indicates when a food product becomes harmful to consume because of contamination. The use by date is quite similar to an expiry date, also known as EXP or Exp. Date. The quality of the food, in terms of texture, color, smell, taste, nutrition, and microorganisms, will deteriorate after the regulated date. As such, it fails to meet the required standards and is best discarded. These labeling distinctions can leave consumers baffled. For instance, more than 50% of consumers in the UK tend to be confused by the difference between the ‘best before’ and ‘use by’ dates, with 20% of all food waste stemming from such label-related confusion [29]. |
 Portion sizes |
Package size can also be linked with the amount of food waste. Larger packs of food are generally popular among consumers, because they are cheaper than foodstuffs sold in small- and medium-sized packaging. Food bought in bulk can lead to more waste because consumers are not able to finish the product before it starts to decay. On the other hand, while small-sized packages help to reduce food waste, they can also generate more waste in other forms, such as plastic and glass. Therefore, if consumers have sufficient knowledge about food storage, preservation, and freezing, then they can buy food in bulk or in large-sized packages and make a significant contribution to reducing food waste and packaging, as well as saving money. |
 Unnecessary purchase |
FW tends to increase if consumers buy food that is not needed at the time of purchase [31]. Overstocking often leads to more waste generation because food is not eaten by the expiry date. Furthermore, advertisements that tempt consumers into trying new foodstuffs are also another factor in FW generation. This means some food is likely to be thrown away simply because consumers try it once and find they do not like it. |
 Storage |
When storing food, it is vital to maintain proper levels of humidity, light, and temperature as these have an impact on food deterioration and spoilage [30]. Poor food storage results in more waste, whereas proper food storage helps extend product shelf-life [32]. Knowledge about food storage also depends on the age of consumers. Older consumers are inclined to organize storage space better than younger consumers [33][34]. Consumer behavior focuses on convenience products, which also means that people do not need to know about food preservation and cooking. Another way to prevent food waste is to re-arrange food storage space frequently. That way, it is possible to check how much food is on the shelf and what the expiry dates are. A survey has shown that when people do not carry out sufficient cleaning and inspection of food storage space, many food products tend to be thrown away [30]. |
 Cooking skills and knowledge |
According to Corrado’s study [35], food waste is attributed to a lack of cooking and food preparation skills. Such skills are linked to age. Older people tend to have more skills than young people in this regard. Younger people are more likely to burn or spoil food when they cook and prepare food [35][36][37][38]. In the UK, 50% of people under the age of 24 lack the ability to cook food using ingredients they already have in their refrigerators, so they are forced to buy new foodstuffs. They also do not often make good use of leftovers [38][39]. Proper portioning and good preparation techniques play a useful part in reducing food waste [30]. |
 Eating habits |
According to Glanz’s study [38][40][41], food waste is also related to eating habits. Consumers who neglect to prepare in advance when purchasing food often end up throwing away rotten food in landfills. Householders who cook and eat food at home tend to produce less food waste than those who dine out [42]48[43]. Up to 60% of food waste in the UK is generated during the cooking and preparation process and from excessive portions of food. |
 Socio-economic trends |
Rising wages and changes in consumer behavior are linked to the increased amount of food waste [44]. Affluent households are inclined to produce more food waste [24]. This relationship corresponds to the European Union’s study showing that the amount of food loss tends to increase dramatically in line with household income. The increased amount of food waste has also been linked to consumption patterns, such as the rising trend in imported food product consumption. This is because imported products have quite a short shelf life. Another issue is that women who work outside the home affect the household food management because daily food purchase becomes more difficult without their help. These households inevitably buy and store in large quantities each week, leaving large amounts of food unused which has to be thrown away [28]. |
 Demographic change |
The shift from extended family to nuclear family in society is also connected to an increased amount of food waste. This is because the average rate of waste disposal per person in the nuclear family is higher than that in the extended family, because food sharing is less common in the nuclear family. Furthermore, teenagers are likely to produce more food waste than older people as they are less experienced in planning and preparing meals, and often do not have the skills to properly manage food waste [44][45][46][47][48]. |
4. Impacts of Food Waste Generation
The daily increase in the amount of food waste in Thailand has a negative impact on food security for the poor, as well as adversely affecting economic development and environmental issues [49][50][51]. However, a contrasting argument states that reducing food waste will not solve widespread hunger. Famine is often the outcome of inadequate food production in terms of quantity and nutrition. Financial constraints also prevent food purchasing. As a result, FW reduction measures in rich countries where food is wasted do little to tackle these problems. Nevertheless, food waste generation has various adverse impacts as described in Table 2.
Table 2. Adverse impacts of household food waste generation.
| Impacts | Explanation and Support Evidence |
|---|---|
 Food resources |
The food industry is the largest generator of greenhouse gases, accounting for 14% of all emissions. Greenhouse gases generated by agricultural sectors are either directly discharged, such as methane and nitrous oxide from composting, livestock, and rice farming, or indirectly discharged from deforestation in order to cultivate lands for food production [28]. |
 Food industry |
The food industry also consumes the most resources. Food production in agricultural sectors uses up to 70% of all fresh water [52]57 ]. Water usage is likely to increase by 10–13 trillion square meters a year by the middle of the 21st century [50]. Moreover, monoculture farming uses vast amounts of chemicals in the form of fertilizers and insecticides which are causing contamination of the soil and water. This has a negative impact on biodiversity and ecosystem services [28]. It is clear that if food is excessively and mindlessly consumed and mostly ends up in garbage bins, natural resources will be lost without any real advantages for humankind. |
 Environmental impacts |
Food waste will eventually become biodegradable material, which has substantial impacts, namely (1) degradation and deposition causing emissions of methane, a greenhouse gas that accelerates global warming [53][54], (2) food waste elimination requiring large spaces for burial, a more popular method of disposal than incineration which requires high energy consumption, and (3) decomposition of food waste, causing leachate that seeps into groundwater and other natural water sources affecting human water consumption [55]. |
 Economic impacts |
The 1.3 billion tons of food waste each year has an economic value of USD 750 billion [56]. In the UK, food disposal costs USD 10.2 billion. Each year, households incur costs of up to USD 420 to dispose of household food waste. Meat and fish make up the majority of waste, costing USD 602 million each year. The cost for wasted bread, apples, and potatoes is USD 360 million, USD 317 million, and USD 302 million, respectively. Fresh food dumped before its expiry date costs up to USD 950 million each year [57]. A survey has also shown that people are generally not particularly aware of the value of the food they throw away. Up to 24% of people never think of the cost of food waste. Another issue is that there are fees incurred from waste collection services provided by government and private sectors. |
5. Food Waste Elimination Strategy
Despite suggestions to encourage FW reduction at the source, quite a lot of household food waste ends up in curb-side collections of trash. These are managed either by the government or the private sector which transports the waste to landfills.
There are several ways to reduce food waste. The first is composting, which is a highly effective way of improving the quality of soil for agriculture [58]. Another way is to use waste to produce biogas, which is a renewable energy source. This is the product of the breakdown of food waste and other organic waste, such as leaves and animal dung, by means of fermentation in biogas containers in the absence of oxygen, turning organic waste into useful gases. Biogas includes household cooking gas and is also used to generate electricity. A third method is using waste to produce bio-extract, a liquid that stems from the fermentation of microorganisms, such as leftovers, vegetables, fruits, herbs, and sweeteners like sugar and honey. Organic matter decomposes with the help of microorganisms. The end product of the whole process is a brown concentrated solution consisting of many different microorganisms and organic materials. This liquid can be used to reduce and replace household chemicals, such as dishwashing liquid, detergent, shampoo, and it can also benefit agricultural practices, such as crop growth and livestock [59].
Despite the obvious advantages, these methods do not catch on in metropolitan regions as they are not compatible with urban lifestyles, which do not depend on traditional agriculture. Furthermore, there is a stronger market for chemicals than compost and other organic materials. The supply of organic matter production is relatively low as a result [58]. The procedures used to produce organic material are also complicated, time-consuming, and take up a great deal of space. Such difficulties hamper urban populations from taking advantage of their food waste through composting, biogas, and bio-extract. Therefore, it is inevitable that household food is wasted.
Food waste makes up a large part of other solid waste collected either by governments or the private sector. Waste disposal by open dumping is the easiest and cheapest process whereby all food collected in communities is accumulated and left to decompose naturally. Waste gradually builds up until it turns into a health hazard with offensive odor and vermin including rats, cockroaches, and flies. Decomposing food waste also generates leachate that often pollutes groundwater and other natural water sources nearby, and this poor-quality water has a negative effect on people’s lives. Open dumping is therefore not a healthy way to dispose of food waste and must be avoided. Unfortunately, it is still a common sight in numerous regions across Thailand. There have been attempts to put other less polluting methods into practice by applying appropriate engineering processes such as sanitary landfill, whereby waste is dispersed evenly and then covered with layers of soil. Each layer needs to be compacted repeatedly and covered permanently by soil and plants as they help prevent water runoff. In some cases, a protective base is put in place to block leachate that could leak from the landfill. However, this practice is still not common in local communities [55].
Another practical method is incineration. All solid waste undergoes complete combustion in high-temperature incinerators. The features of incinerators can vary depending on the waste components. Flammable and dry materials are suitable for low-temperature incinerators, while high-temperature incineration must be used for liquid-saturated waste, which is harder to burn down. The latter also pushes up the cost of incineration as it requires substantial energy consumption [55][60][61].
Recently, hydrothermal carbonization (HTC) was proven to be an effective tool for converting waste biomass into a solid high energy dense material (hydrochar) and a liquid residue where the most volatile and oxygenated compounds (mainly furans and organic acids) concentrate during reaction [62]. The most common waste biomass materials include those produced by agro-industries and municipalities (organic fraction of municipal solid waste, food waste, and sewage sludge), as well as from forestry and paper mill industries. HTC can also be conducted with per-sulfate at lower temperatures for hydrochar biofuel production [63][64][65].
6. Related Policies, Strategies, and Plans on FW Reduction
Based on a review of official documents on waste management, food loss, FW, and the ‘3Rs’ (i.e., reduce, reuse, recycle), the overall structure of waste management policy, along with related food loss and FW policies, is summarized in Figure 3. Although Thailand has no specific institutions to administer FW policies, the Ministry of Natural Resources and Environment (MONRE) is tasked with developing strategies, action plans, and technical guidance on waste management and the 3Rs; the Ministry of Interior administers MSW management; the Ministry of Industry addresses industrial sources of FW; and the Ministry of Agriculture and Cooperatives is responsible for food loss issues in the planting, harvesting, transportation, and processing phases.
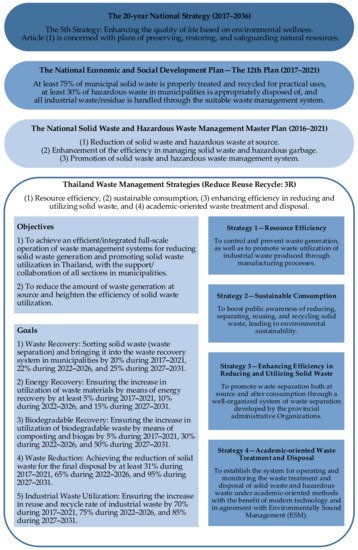
Figure 3. Overall structure of the waste management policy as well as related food loss and waste policies and regulations. Source: Modified and translated from Executive Summary: Thailand Waste Management Strategies (Reduce Reuse Recycle: 3R) by the authors.
From the perspective of proper management of solid waste, the National Roadmap for Solid Waste and Hazardous Waste Management and the National Master Plan on Waste Management seek participation by provincial governors, local authorities, and the private sector in (1) reducing waste and separating waste at its source; (2) enhancing the efficiency in managing MSW; and (3) using promoting mixed technologies in disposal, including transforming waste to energy [66].
The BMA adopted a Solid Waste Management Plan (2015–2019), pursuant to the National Roadmap for Solid Waste and Hazardous Waste Management and the National Master Plan on Waste Management (2016–2021). This five-year plan envisioned a 7% reduction in household waste by 2019. The current 20-year plan seeks to promote a 20% reduction in waste and a 20% increase in separation at the source from 2013 to 2032, increase waste recycling or treatment to 50%, and reduce waste disposal through landfills by 50%. The BMA has also enacted a ‘Green Metropolis’ policy to make its waste management system more environmentally friendly, particularly through the use of clean technology [67].
This entry is adapted from the peer-reviewed paper 10.3390/su13147651
References
- Soma, T. (Re)framing the food waste narrative: Infrastructures of urban food consumption and waste in Indonesia. Indonesia 2018, 105, 173–190.
- Rangkuti, F.; Wright, T. Indonesia Retail Foods: Indonesia Retail Report Update 2013; Foreign Agricultural Service: Jakarta, Indonesia, 2013; USDA Foreign Agricultural Service, Global Agricultural Information Network (GAIN).
- Goodman, D.; Robison, R. The New Rich in Asia: Mobile Phones, McDonald’s and Middle Class Revolution; Routledge: London, UK, 2013.
- Reardon, T.; Hopkins, R. The supermarket revolution in developing countries: Policies to address emerging tensions among supermarkets, suppliers and traditional retailers. Eur. J. Dev. Res. 2006, 18, 522–545.
- Lee, K.C. Grocery shopping, food waste, and the retail landscape of cities: The case of Seoul. J. Clean. Prod. 2018, 172, 325–334.
- Liu, C.; Mao, C.; Bunditsakulchai, P.; Sasaki, S.; Hotta, Y. Food waste in Bangkok: Current situation, trends and key challenges. Resour. Conserv. Recycl. 2020, 157, 104779.
- Liu, G. Food Losses and Food Waste in China: A First Estimate. In OECD Food, Agriculture and Fisheries Papers; OECD Publishing: Paris, France, 2014.
- Wang, L.; Xue, L.; Li, Y.; Liu, X.; Cheng, S.; Liu, G. Horeca food waste and its ecological footprint in Lhasa, Tibet, China. Resour. Conserv. Recycl. 2018, 136, 1–8.
- Khalid, S.; Naseer, A.; Shahid, M.; Shah, G.M.; Ullah, M.I.; Waqar, A.; Abbas, T.; Imran, M.; Rehman, F. Assessment of nutritional loss with food waste and factors governing this waste at household level in Pakistan. J. Clean. Prod. 2019, 206, 1015–1024.
- Baig, M.B.; Gorski, I.; Neff, R.A. Understanding and addressing waste of food in the Kingdom of Saudi Arabia. Saudi J. Biol. Sci. 2019, 26, 1633–1648.
- Rezaei, M.; Liu, B. Food Loss and Waste in the Food Supply Chain; International Nut and Dried Fruit Council: Reus, Spain, 2017; pp. 26–27.
- BMA. Bangkok State of the Environment 2015–2016; BMA: Bangkok, Thailand, 2016.
- BMA. Bangkok State of the Environment 2013–2014; BMA: Bangkok, Thailand, 2014.
- BMA. Bangkok State of the Environment 2010–2011; BMA: Bangkok, Thailand, 2011.
- Lammawichai, J. Solid Waste Management in Bangkok; BMA: Bangkok, Thailand, 2017; Available online: https://www.jesc.or.jp/Portals/0/center/training/10thasia3r/8.10thasia3r_bangkok.pdf (accessed on 21 June 2021).
- Pollution Control Department, Ministry of Natural Resources Environment. Thailand State of Pollution Report 2018; Pollution Control Department, Ministry of Natural Resources Environment: Bangkok, Thailand, 2019.
- Pollution Control Department, Ministry of Natural Resources Environment. Thailand State of Pollution Report 2017; Pollution Control Department, Ministry of Natural Resources Environment: Bangkok, Thailand, 2018.
- Pollution Control Department, Ministry of Natural Resources Environment. Thailand State of Pollution Report 2015; Pollution Control Department, Ministry of Natural Resources Environment: Bangkok, Thailand, 2016.
- Department of Environment. Handbook of Community Based Solid Waste Management; Department of Environment: Bangkok, Thailand, 2013.
- Policy and Planning Division. Waste Collection Trucks for the Fiscal Year of 2014; The Bangkok Metropolitan Administration: Bangkok, Thailand, 2015.
- Sukholthaman, P.; Sharp, A. A system dynamics model to evaluate effects of source separation of municipal solid waste management: A case of Bangkok, Thailand. Waste Manag. 2016, 52, 50–61.
- Jungrungrueng, S. Bangkok towards sustainable waste management. In Proceedings of the management of the Sai Mai waste transfer and disposal station, Bangkok, Thailand; 2014.
- The Nation. Monthly Garbage Fees to Quadruple as New Disposal Cost Adde. The Nation. 9 May 2019. Available online: https://www.nationthailand.com/national/30369133 (accessed on 21 June 2021).
- Parfitt, J.; Barthel, M.; Macnaughton, S. Food Waste within Food Supply Chains: Quantification and Potential for Change to 2050. Philos. Trans. R. Soc. B 2010, 365, 3065–3081.
- Food and Agriculture Organization of the United Nations (FAO). Food Loss Prevention in Perishable Crops. Agriculture Services bulletin No. 43; Food and Agriculture Organization of the United Nations: Rome, Italy, 1981.
- Batista, L.; Dora, M.; Garza-Reyes, J.A.; Kumar, V. Improving the sustainability of food supply chains through circular economy practices—A qualitative mapping approach. Manag. Environ. Qual. Int. J. 2021, 32, 752–767.
- Hodges, R.J.; Buzby, J.C.; Bennett, B. Postharvest Losses and Waste in Developed and Less Developed Countries: Opportunities to Improve Resource Use. J. Agric. Sci. 2011, 149, 37–45.
- Priefer, C.; Jörissen, J.; Bräutigam, K. Technology Options for Feeding 10 Billion People: Options for Cutting Food Waste; Science and Technology Options Assessment (STOA): Brussels, Switzerland, 2013.
- Lee, P.; Willis, P. Waste Arisings in the Supply of Food and Drink to UK Households; Waste & Resources Action Programme (WRAP): Banbury, UK, 2010.
- United States Environmental Protection Agency. Food: Too Good to Waste Pilot; U.S. Environmental Protection Agency-Region 10: Washington, DC, USA, 2012.
- Quested, T.E.; Marsh, E.; Stunell, D.; Parry, A.D. Spaghetti Soup: The Complex World of Food Waste Behaviour. Resources, Conservation and Recycling. Resour. Conserv. Recycl. 2013, 79, 43–51.
- European Commission. Preparation Study on Food Waste across EU27; BIO Intelligence Service: Paris, France, 2010.
- Johnson, D.; Hipps, N.; Hails, S. Helping Consumers Reduce Fruit and Vegetable Waste: Final Report; Ipsos MORI and Waste & Resources Action Programme (WRAP): Banbury, UK, 2008.
- Bekteş, A. Research and Product Design to Minimize Food Waste in Western Domestic Kitchens. Master's thesis, Middle East Technical University, Ankara, Turkey, 2010.
- Corrado, M. Understanding Consumer Food Management Behaviour; Ipsos MORI and Waste & Resources Action Programme (WRAP): Banbury, UK, 2007.
- Canali, M.; Amani, P.; Aramyan, L.; Gheoldus, M.; Moates, G.; Östergren, K.; Silvennoinen, K.; Waldron, K.; Vittuari, M. Food waste drivers in Europe, from identification to possible interventions. Sustainability 2017, 9, 37.
- Ponis, S.T.; Papanikolaou, P.-A.; Katimertzoglou, P.; Ntalla, A.C.; Xenos, K.I. Household food waste in Greece: A questionnaire survey. J. Clean. Prod. 2017, 149, 1268–1277.
- Bilska, B.; Tomaszewska, M.; Kołożyn-Krajewska, D. Analysis of the behaviors of polish consumers in relation to food waste. Sustainability 2020, 12, 304.
- Waste & Resources Action Programme (WRAP). Understanding Food Waste; Waste & Resources Action Programme (WRAP): Banbury, UK, 2007.
- Glanz, R. Causes of Food Waste Generation in Households—An Empirical Analysis; University of Natural Resources and Applied Life Sciences: Vienna, Austria; Cranfield University: Vienna, Austria, 2008.
- Chenene, L.M.L. The Relationship between Household-Generated Food Waste in Rural and Urban Lesotho: An Investigation; University of the Free State: Bloemfontein, South Africa, 2020.
- Schneider, F. Wasting Food—An Insistent Behaviour. Available online: http://analyseplatformen.dk/Data/madspildsmonitor/HTML_madspildsplatform/assets/schneider_2008_wasting-food--an-insistent-behaviour..pdf (accessed on 21 June 2021).
- Parizeau, K.; von Massow, M.; Martin, R. Household-level dynamics of food waste production and related beliefs, attitudes, and behaviours in Guelph, Ontario. Waste Manag. 2015, 35, 207–217.
- Mattar, L.; Abiad, M.G.; Chalak, A.; Diab, M.; Hassan, H. Attitudes and behaviors shaping household food waste generation: Lessons from Lebanon. J. Clean. Prod. 2018, 198, 1219–1223.
- Grethe, H.; Dembélé, A.; Duman, N. How to Feed the World’s Growing Billions. Understanding FAO World Food Projections and Their Implications; Heinrich Böll Stiftung und WWF Deutschland: Berlin, Germany, 2011.
- Cox, J.; Downing, P. Food Behaviour Consumer Research: Quantitative Phase; Ipsos MORI and Waste & Resources Action Programme (WRAP): Banbury, UK, 2007.
- Yamakawa, H.; Williams, I.; Shaw, P.; Watanabe, K. Food waste prevention: Lessons from the Love Food, Hate Waste campaign in the UK. In Proceedings of the 16th International Waste Management and Landfill Symposium, S. Margherita di Pula, Italy, 2–6 October 2017; pp. 2–6.
- Hamilton, C.; Denniss, R.; Baker, D. Wasteful Consumption in Australia; The Australia Institute: Canberra, Australia, 2005.
- Stancu, V.; Haugaard, P.; Lähteenmäki, L. Determinants of consumer food waste behaviour: Two routes to food waste. Appetite 2016, 96, 7–17.
- Gustavsson, J.; Cederberg, C.; Sonesson, U.; van Otterdijk, R.; Meybeck, A. Global Food Losses and Food Waste: Extent, Causes and Prevention; Food and Agriculture Organization of the United Nations: Rome, Italy, 2011.
- Institution of Mechanical Engineers (ImechE). Global Food: Waste Not, Want Not; Institution of Mechanical Engineers: London, UK, 2013.
- The Government Office of Science. The Future of Food and Farming: Challenges and Choices for Global Sustainability; The Government Office of Science: London, UK, 2011.
- UN-Water. Water in a Changing World; World Water Assessment Programme (UNESCO WWAP): Istanbul, Turkey, 2009.
- Rahmani, M.; Davary, K.; Teimori, L.A.M.; Shafiei, M. Investigating and Selecting of Assessment Indexes for Sustainable Water Management at Watershed Scale. J. Irrig. Sci. Eng. 2021, 44, 141–154.
- Hall, K.; Guo, J.; Dore, M.; Chow, C. The Progressive Increase of Food Waste in America and Its Environmental Impact. PLoS ONE 2009, 4, 1–6.
- Alexander, P.; Brown, C.; Arneth, A.; Finnigan, J.; Moran, D.; Rounsevell, M.D. Losses, inefficiencies and waste in the global food system. Agric. Syst. 2017, 153, 190–200.
- Sinsuwan, P. Municipal Solid Waste: The Significant Problem of Thialand; National Assembly Library of Thailand: Bangkok, Thailand, 2014.
- UN News Center. Nearly 870 Million People Chronically Undernourished, Says New UN Hunger Report. Available online: https://news.un.org/en/story/2012/10/423022#.VPFw4nysV4s (accessed on 29 June 2021).
- Ventour, L. The Food We Waste; Exodus Market Research and Waste & Resources Action Programme (WRAP): Banbury, UK, 2008.
- Sharp, A.; Sang-Arun, J. A Guide for Sustainable Urban Organic Waste Management in Thailand: Combining Food, Energy, and Climate Co-Benefits; Institute for Global Environmental Strategies: Kanagawa, Japan, 2012.
- Chaiyasut, C. Bioextract. Pathumthani: National Science and Technology Development Agency; NSTDA Bookstore: Bangkok, Thailand, 2010.
- Wang, K.; Nakakubo, T. Comparative assessment of waste disposal systems and technologies with regard to greenhouse gas emissions: A case study of municipal solid waste treatment options in China. J. Clean. Prod. 2020, 260, 120827.
- Lou, Z.; Bilitewski, B.; Zhu, N.; Chai, X.; Li, B.; Zhao, Y. Environmental impacts of a large-scale incinerator with mixed MSW of high water content from a LCA perspective. J. Environ. Sci. 2015, 30, 173–179.
- Maniscalco, M.P.; Volpe, M.; Messineo, A. Hydrothermal carbonization as a valuable tool for energy and environmental applications: A review. Energies 2020, 13, 4098.
- Wang, T.; Liu, X.; Wang, D.; Gong, Z.; Si, B.; Zhai, Y. Persulfate assisted hydrothermal processing of spirulina for enhanced deoxidation carbonization. Bioresour. Technol. 2021, 322, 124543.
- Wang, T.; Si, B.; Gong, Z.; Zhai, Y.; Cao, M.; Peng, C. Co-hydrothermal carbonization of food waste-woody sawdust blend: Interaction effects on the hydrochar properties and nutrients characteristics. Bioresour. Technol. 2020, 316, 123900.
- Wang, T.; Zhai, Y.; Zhu, Y.; Li, C.; Zeng, G. A review of the hydrothermal carbonization of biomass waste for hydrochar formation: Process conditions, fundamentals, and physicochemical properties. Renew. Sustain. Energy Rev. 2018, 90, 223–247.
- UNCRD. Country 3R Progress Report Kingdom of Thailand, 2018. In Proceedings of the Eight Regional 3R Forum in Asia and the Pacific, Indore, Madhya Pradesh, India, 9–12 April 2018.
- Chanhthamixay, B.; Vassanadumrongdee, S.; Kittipongvises, S. Assessing the sustainability level of municipal solid waste management in Bangkok, Thailand by wasteaware benchmarking indicators. Appl. Environ. Res. 2017, 39, 49–61.