Mangrove forests play an important role in mitigating climate change but are threatened by aquaculture expansion (shrimp ponds). The change of land use from natural environments to productive uses, generates a change in the balance and carbon sequestration and storaging. In mangrove forest the carbon stocks are larger than in other tropical forest. Addtionally, soil mangrove forest represent 40-80% of Cardon stocks. These reasons are the evidence of mangrove forest need to be included in REED programs and conservation strategies. .
[1]1. Introduction
Mangrove forests have an area of 152,361 km
2 worldwide [
1], with 15.7% of that surface in South America (23,882 km
2) [
2]. Currently, mangrove forests in Ecuador occupy 1906 km
2 [
3]. These ecosystems are wildlife refuges with high natural, cultural, and scientific value, as well as the largest artisanal and industrial fishing area in Ecuador [
4].
Mangrove forests play an important role in the global carbon cycle because they are highly productive ecosystems [
5]. Currently, coastal ecosystems such as mangroves present burial rates of 353 gm
−2 y
−1 [
6]. Although they occupy only a small fraction of the coastal area globally (0.5%), mangroves store 10%–15% of carbon (C) present in coastal sediments (at a rate of 24 Tg C y
−1) and export 10%–11% of terrestrial carbon particles to the ocean [
7]. In addition, they contribute 55% of air–sea exchange and 14% of organic carbon burial, and export 28% of dissolved inorganic carbon (DIC) and 13% of dissolved organic carbon (DOC) plus particulate organic matter (POC) from the coastline and estuaries [
8].
In these ecosystems, soils are the largest carbon sinks due to high contents of organic matter (OM) [
5] and deep soil horizons. Soil C accumulation depends on several factors such as organic matter inputs, root turnover, necromass, algae and benthic organisms, the slow decomposition of refractory material, the magnitude and frequency of waves, the activity of micro- and macro-organisms, tree species and the composition of litter, and high humidity and temperature [
9]. Average soil stocks are more than 1023 Mg C ha
−1, representing between 48 and 98% of carbon stored at depths from 0.5 to more than 3 m [
10]. These values double and even triple carbon stocks in terrestrial tropical forest soils; one example is the terrestrial forest of Sumatra with 180 Mg C ha
−1 [
11,
12]. However, accelerated deforestation threatens the stability of mangrove carbon sinks. Global CO
2 emissions caused by the loss of mangrove forests have been estimated to be ~ 7.0 Tg CO
2e y
−1. Countries with the highest CO
2 emissions due to mangrove loss are Indonesia (3410 Gg CO
2e y
−1) and Malaysia (1288 Gg CO
2e y
−1) [
13].
Land use change in mangrove forests results in mineralization of C that has been stored for decades or millennia. From 1982 to 2002, the loss of 35% of the world’s mangroves resulted in the release of 3.8 × 10
14 g C stored in the aboveground biomass of these forests [
14,
15]. It is estimated that 10,600 Mg CO
2 km
−2 will be emitted in the first year after mangrove cover changes to other land uses, and 20 years later, 3000 Mg CO
2 km
−2 y
−1 [
16]. Globally, the estimates of emissions vary between 0.02 and 0.12 Pg C y
−1, equivalent to 10% of globlal emissions caused by deforestation [
10,
17,
18]. In this sense, international agreements such as the mechanism for reducing emissions from deforestation and degradation (REED+), whose main strategy is to maintain C stored through economic incentives to forest conservation, are a cost-effective option to mitigate climate change [
10]. In addition, there are other programs from the United Nations Framework Convention on Climate Change (UNFCCC), which require rigorous monitoring of carbon sinks and emissions.
2. Mangrove Forest Strata and Shrimp Ponds
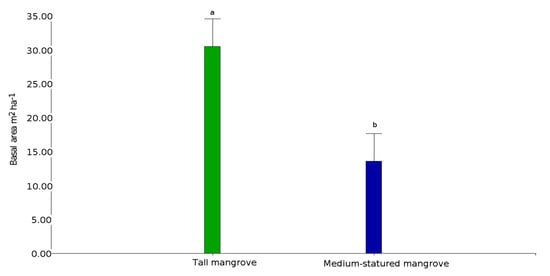
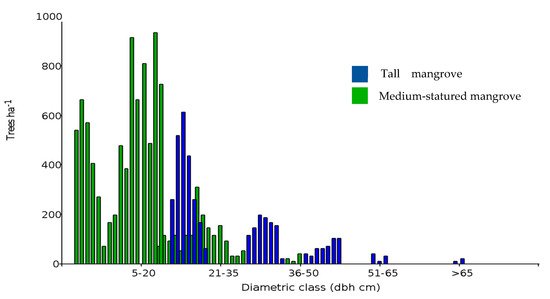
In the Gulf of Guayaquil, we identified 117,746 ha of medium-statured mangroves, 16,317 ha of tall mangroves, and 163,950 ha of shrimp farms (Figure 1). Due to the homogeneity in the composition of species present in the sampled transects, it was not possible to differentiate forest community types. However, basal area allowed us to differentiate the structure of the trees present in the two strata (Figure 3). The structure of both mangrove strata also differs, with a large presence of trees with 5–20 cm diameters and a low presence of trees of 36–50 cm in diameter in medium-statured mangrove. In contrast, tall mangroves showed a diameter distribution biased towards larger trees, exceeding the dbh > 50 cm category and reaching up to > 65 cm (Figure 4).
Figure 3. Differences in basal area between medium-statured and tall mangrove forests in the gulf of Guayaquil, Ecuador (different letters denote statistically significant differences).
Figure 4. Number of trees (per ha−1) by diameter class (cm) in medium-statured and tall mangrove forests in the gulf of Guayaquil, Ecuador.
Rhizophora mangle (red mangrove) and Laguncularia racemosa var. glabriflora (white mangrove) were present in both mangrove strata. We found red mangrove relative abundances of 99.6% and of 0.3% for white mangroves in medium-statured mangroves, respectively, while their relative dominances were 91.1% and 8.8%, respectively. The average height for these strata was 17 ± 4 m, with a maximum height of 34 m. The average basal area was 15.4 ± 6.5 m2 ha−1, and tree density reached 834 ± 410 ha. For tall mangroves, we found relative abundances of 96.2 and 3.7% and relative dominances of 95.2% and 5% for red and white mangroves, respectively. The average tall mangrove strata height was 17.9 ± 4.1 m, with a maximum height of 38 m. The average basal area was 30.8 ± 6.7 m2 ha−1 and the tree density reached 827 ± 388 ha (Table 2). Although similar in density, tall mangroves had twice the basal area as the medium-statured mangroves.
Table 2. Mangrove forest height (m), basal area (m2 ha−1), and tree density (trees ha−1) by island in the gulf of Guayaquil, Ecuador.
| Mangrove Stratum |
Transect |
Island |
Species |
Height |
Basal Area |
Tree Density |
| Medium-statured |
T11 |
San Ignacio |
Rhiz |
18.0 ± 2.4 |
10.5 ± 4.3 |
671 ± 281 |
| Medium-statured |
T12 |
Canoa |
Rhiz |
18.2 ± 1.5 |
16.2 ± 6.8 |
942 ± 477 |
| Medium-statured |
T13 |
San Ignacio |
Rhiz |
19.6 ± 3.6 |
16.8 ± 9.0 |
769 ± 271 |
| Medium-statured |
T14 |
San Ignacio |
Rhiz |
16.1 ± 4.1 |
18.5 ± 9.8 |
693 ± 268 |
| Medium-statured |
T15 |
Chupadores Chico |
Rhiz |
8.4 ± 0.8 |
3.2 ± 1.7 |
487 ± 99 |
| Medium-statured |
T16 |
Chupadores Chico |
Rhiz |
13.0 ± 5.1 |
8.8 ± 5.7 |
379 ± 139 |
| Medium-statured |
T17 |
Chupadores Chico |
Rhiz/Lag |
21.1 ± 2.9 |
13.9 ± 4.1 |
531 ± 156 |
| Medium-statured |
T18 |
Chupadores |
Rhiz |
20.8 ± 3.6 |
14.0 ± 2.8 |
498 ± 140 |
| Medium-statured |
T19 |
San Ignacio |
Rhiz |
22.7 ± 1.7 |
27.7 ± 9.9 |
1007 ± 158 |
| Medium-statured |
T20 |
Canoa |
Rhiz |
23.0 ± 4.2 |
23.1 ± 13.0 |
736 ± 168 |
| Medium-statured |
T21 |
Bellavista |
Rhiz |
17.7 ± 1.7 |
20.2 ± 7.9 |
1321 ± 853 |
| Medium-statured |
T22 |
Chupadores Chico |
Rhiz |
12.9 ± 2.2 |
19.2 ± 11.2 |
1039 ± 344 |
| Medium-statured |
T4 |
Tortuga |
Rhiz |
22.9 ± 1.5 |
26.6 ± 8.7 |
1180 ± 255 |
| Medium-statured |
T5 |
Tortuga |
Rhiz/Lag |
19.8 ± 1.4 |
10.1 ± 3.4 |
693 ± 333 |
| Medium-statured |
T6 |
Tortuga |
Rhiz |
18.4 ± 1.6 |
10.0 ± 4.5 |
1061 ± 333 |
| Medium-statured |
T7 |
Bocana |
Rhiz |
14.4 ± 2.7 |
11.1 ± 4.2 |
888 ± 262 |
| Medium-statured |
T8 |
Bocana |
Rhiz/Lag |
16.7 ± 2.9 |
12.0 ± 2.3 |
1288 ± 238 |
| Tall |
TM1 |
Mondragón |
Rhiz |
22.4 ± 6.0 |
32.6 ± 17.9 |
585 ± 179 |
| Tall |
TM10 |
Mondragón |
Rhiz/Lag |
11.8 ± 2.8 |
18.7 ± 9.5 |
985 ± 186 |
| Tall |
TM11 |
Mondragón |
Rhiz/Lag |
14.5 ± 2.1 |
29.2 ± 11.5 |
1245 ± 289 |
| Tall |
TM12 |
Mondragón |
Rhiz |
17.8 ± 2.4 |
34.3 ± 16.8 |
1104 ± 448 |
| Tall |
TM3 |
Mondragón |
Rhiz |
17.3 ± 1.4 |
28.0 ± 14.4 |
660 ± 271 |
| Tall |
TM8 |
Mondragón |
Rhiz |
17.7 ± 3.1 |
31.9 ± 10.0 |
812 ± 365 |
| Tall |
TM9 |
Mondragón |
Rhiz |
23.5 ± 4.7 |
40.9 ± 20.0 |
401 ± 156 |
Note: T and TM = transect code, Rhiz (Rhizophora mangle), Lag (Laguncularia racemosa).
3. Aboveground Carbon
Aboveground carbon ranged from 73.6 ± 8.3 Mg C ha−1 in medium-statured mangroves to 192.2 ± 29.2 Mg C ha−1 in tall mangroves. We found statistical differences in aboveground C with respect to the marine ecotone; in medium-statured mangroves only, carbon decreased beyond 100 m inside the mangrove forest (Table 3).
Table 3. Carbon stocks of medium-statured mangroves varied according to distance from the estuary edge in the gulf of Guayaquil, Ecuador.
| Seaward Edge (m) |
Aboveground Carbon (Mg·ha−1) |
| 25 |
85.8 |
a |
| 50 |
86.7 |
a |
| 75 |
83.0 |
a |
| 100 |
78.3 |
a |
| 125 |
59.1 |
b |
| 150 |
48.6 |
b |
Different letters denote a significant difference (p < 0.05) in mangrove strata.
4. Soil Carbon
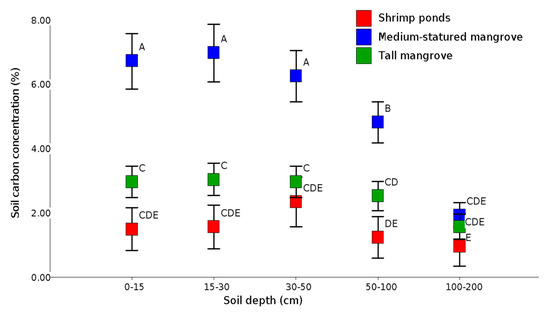
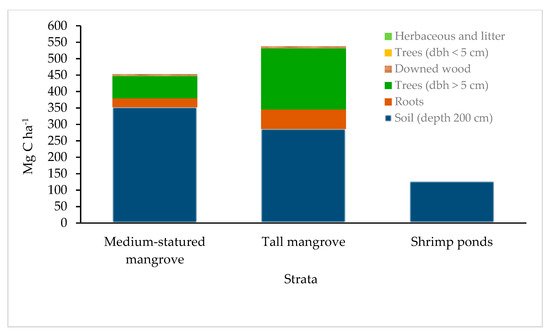
Soil C concentrations decreased with depth and are statistically different (p < 0.05) at 1 m depth, but at greater depths (Figure 5). This suggests that soil C in the surface layers is most affected by the conversion from mangroves to shrimp farms (Figure 5). Carbon stocks in roots and sediments at 1 m depth were 247.3 ± 21.8 in medium-statured mangroves and 227.2 ± 26.7 Mg C ha−1 in tall mangroves. In addition, at a depth of 2 m, we found 379.2 ± 30.3 and 345.4 Mg C ha−1, respectively. In shrimp ponds, the average stocks were 81.9 ± 13.6 Mg C ha−1 at 1 m depth and 126.9 ± 16.3 Mg C ha−1 at 2 m depth, 50% less than the soil carbon stocks under mangrove forests (Figure 6).
Figure 5. Soil carbon concentrations in mangrove stages and shrimp ponds (different letters represent statistically significant differences (p < 0.05) in soil pools between different mangrove strata).
Figure 6. Total carbon stocks in compartments of the mangrove forest and shrimp ponds at 200 cm of depth.
This entry is adapted from the peer-reviewed paper 10.3390/f12070816