Various frameworks and methods, such as quality by design (QbD), real time release test (RTRT), and continuous process verification (CPV), have been introduced to improve drug product quality in the pharmaceutical industry. The methods recognize that an appropriate combination of process controls and predefined material attributes and intermediate quality attributes (IQAs) during processing may provide greater assurance of product quality than end-product testing. The efficient analysis method to monitor the relationship between process and quality should be used. Process analytical technology (PAT) was introduced to analyze IQAs during the process of establishing regulatory specifications and facilitating continuous manufacturing improvement. Although PAT was introduced in the pharmaceutical industry in the early 21st century, new PAT tools have been introduced during the last 20 years.
1. Introduction
Quality control in the pharmaceutical industry has traditionally depended on statistical process control (SPC) [
1,
2,
3,
4], which is used to understand the process and desired specification limits and to ensure a stable process by eliminating the allocable sources of variation. Statistical methods, including control charts and run charts, are used to inspect the quality of the post-manufacturing finished product and determine the performance suitability of unit operations in the pharmaceutical manufacturing process [
1]. Moreover, most offline analyses and monitoring are conducted to evaluate the quality of the intermediate and finished products during the production batch process. For example, it is common to use control charts for monitoring general production processes, thereby ensuring that various aspects of the production process are controlled [
5,
6]. This traditional process verification is designed to perform process verification on finished batches under predesigned process conditions. Therefore, a disadvantage of this method is that the quality characteristics of intermediate products cannot be confirmed during the manufacturing process. Hence, identifying and solving problems that arise during the process requires a lot of time and results in relatively more high-quality defects. Moreover, there is no assurance that the entire lot conforms to the required specifications, and the method cannot be applied generally as a solution to all quality defects.
The International Council for Harmonisation (ICH) launched continuous process verification (CPV) to overcome SPC limitations, ensure process control, and improve the understanding of processes and product quality. Furthermore, ICH described CPV as an alternative approach to process validation, in which manufacturing process performance is continuously monitored and evaluated. In addition, CPV provides more information about variability and control, providing higher statistical confidence, improving the assessment of pharmaceutical manufacturing processes and higher assurance of continuous control status.
Another strategy introduced by the pharmaceutical industry to improve the understanding of the process and quality control is quality by design (QbD). QbD is defined in ICH Q8 guidelines as “a systematic approach to development that begins with predefined objectives and emphasizes product and process understanding and process control, based on sound science and quality risk management.” The development of a QbD-based pharmaceutical process involves a scientific risk-based systematic method to correlate critical process parameters (CPPs), input-materials attributes, and critical-quality attributes (CQAs) [
3]. In general, QbD tools, including design of experiments (DoE), empirical modeling, and response surface analysis can develop a design space and reveal process variability during the pharmaceutical manufacturing process [
7,
8,
9]. Unlike the existing quality by testing (QbT) system, in which the quality test of the finished product is mainly used, the QbD approach enables drug-quality management to enhance the quality of drugs based on science- and risk-based technology.
The US Food and Drug Administration (FDA)’s Center for Drug Evaluation and Research (CDER) discussed the need for FDA guidance to facilitate PAT implementation, and the FDA published the PAT guidance for innovative pharmaceutical manufacturing and quality in September 2004 [
10]. It is recognized as an important paradigm shift in inspecting and approving processes for the continuous process verification of pharmaceutical production processes. This initiative is also implemented by the EMA, and the Ministry of Health, Labor, and Welfare (MHLW) in Japan adopted it immediately [
11]. Interfacing manufacturing processes with analytical techniques is essential in PAT, as it facilitates process development according to QbD principles and enables real-time release testing (RTRT) [
12]. PAT is applied to each unit operation in the manufacturing process; CPPs, which have a significant influence on CQAs, are controlled to present a high-quality product in the market [
13,
14,
15].
PAT in CPV ensures product quality throughout the manufacturing process and enables the automation of transportation between product processes [
16,
17]. Furthermore, PAT is used as a control strategy for monitoring processes in real time, improving the understanding of the process, and RTRT [
11,
18,
19]. The vast amount of information obtained by PAT enables rapid problem resolution, optimization, and defect detection. In addition, in the event of unexpected process changes, PAT can be applied to identify the root causes of undesired drug product-quality issues. Therefore, appropriate PAT enables the timely adjustment of process parameters, ensures good and stable product quality, and shortens the overall manufacturing time. These frameworks provide advantages that enable process control quickly and easily and are a trend that has been gradually adopted and introduced because it contributes significantly to establishing the control technology [
18,
19,
20,
21]. Furthermore, several studies have applied the QbD approach and PAT in pharmaceutical manufacturing processes [
12,
14,
16,
17,
18].
2. Control Strategy for PAT Application
Appropriate control strategies should be applied during the manufacturing process to control variables affecting product quality. A control strategy comes from the understanding of products and processes and risk management. There are various approaches, such as in-process testing, RTRT, and finished product testing [
11,
14,
15]. Traditional control strategies mostly rely on off-line analysis of finished-product testing. In addition, process verification has been performed on batches produced under predesigned process conditions. However, because it is difficult to predict the effect of process parameters during processing on finished-product quality, there is a limit to effectively controlling the process. It cannot be determined that all produced lots comply with the requirements. In addition, it is not easy to establish the feasibility of controlling the process variables of each unit process. Therefore, real-time process control is impossible and inefficient in terms of time and cost. The QbD approach has been introduced to overcome this and to improve understanding of product performance, identify critical process parameters (CPPs) during quality risk assessment of the product manufacturing process, and establish appropriate control strategies for each variable [
13,
22]. The QbD approach is applied for the accurate and reliable prediction of product-quality characteristics within the design space established, using each variable, manufacturing environment, and other conditions [
12]. As this improves the understanding of products and processes, control strategies are applied to produce products of consistent quality that meet the desired quality attributes [
23,
24]. Introducing process control strategies to minimize the variability of the finished-product quality can justify an approach to quality assurance with an improved level of quality compared to finished-product testing using existing compendial standards.
2.1. The Effect of the Manufacturing Process on Intermediates during Processing
As described above, CPV was introduced in the pharmaceutical industry to produce high-quality drugs through quality control and quality assurance throughout the drug lifecycle. Therefore, in CPV, the quality control and process monitoring of intermediate products are recommended by using QbD to identify the quality of intermediate products that may affect the quality of finished products and by adjusting process parameters during the manufacturing process using the PAT framework. [
12,
13,
22].
Table 1 presents the process parameters and quality of intermediate products that need to be adjusted in the manufacturing process, including blending, granulation, drying, coating, and tableting of solid dosage form based on the risk assessment using the QbD approach. Since the proposed process parameters and quality of the intermediate can greatly influence the quality attribute of the finished product, they should be adjusted by conducting appropriate process monitoring through a PAT framework during the manufacturing process [
23,
24].
Table 1. Effect of critical process parameters (CPPs) on intermediate quality attributes (IQAs) for the solid dosage form.
2.2. Workflow of PAT Framework for the Pharmaceutical Manufacturing Process
Before applying PAT to the process, first, it is necessary to understand the process and materials and consider the characteristics of the PAT tool. The most appropriate PAT tool is selected and applied to the PAT process. In this process, factors such as the location of the PAT tool and the measurement method should be considered. The measurement methods of PAT during the process are classified into at-line, on-line, and in-line. The at-line method is a measurement method that collects, separates, and analyzes a sample from a place very close to the process. On-line is a measurement method in which a sample is measured in the manufacturing process, suitability is determined, and the sample is returned to the process or discarded. In-line is a real time monitoring method using software without collecting a sample from the process flow [
121]. After that, process monitoring is performed, and the collected data is analyzed and evaluated with statistical methods. The statistical methods could be divided into preprocessing technologies, chemometric modeling, and data evaluation. Standard normal variate (SNV), multiplicative scatter correction (MSC), and derivatives to reduce data interference and correct data are used in the preprocessing step [
60,
122,
123,
124,
125]. The chemometric modeling includes partial least square (PLS), principal component analysis (PCA), multiple linear regression (MLR), etc., to confirm the correlation between CQAs, critical material attributes (CMAs), and CPPs [
16,
20]. Data evaluation is to measure and enhance data predictability using the root mean square error of the calibration (RMSEC), root mean square error of the prediction (RMSEP), etc. [
126,
127,
128]. Various literature presented use PAT in this way. It is suggested that process control and quality control can be performed by measuring the quality of intermediate and finished products in RTRT using PAT during the process.
2.3. The Role of PAT Framework on QbD, CPV, and RTRT
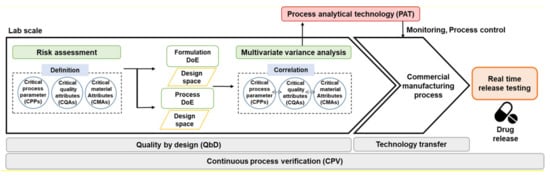
As shown
Figure 1, PAT is important for CPV and QbD approaches to the production of high-quality drug products. In lab-scale drug development, CMAs, CPPs, and CQAs in the formulation and process are identified through QTPP and risk assessment, an optimal design space is derived through DoE, and correlations with CQAs, CPPs, and IQAs are identified through multivariate analysis (MVA) based on QbD [
35]. Based on the correlation between CQAs, CPPs, and IQAs, process and quality control are possible by checking process variability in real-time through PAT during the commercial-/pilot-scale manufacturing process. Therefore, the introduction of PAT in the QbD approach in the pharmaceutical manufacturing process is used as a control strategy for RTRT by improving process understanding through monitoring the process in real-time and enabling rapid identification and response [
11,
129,
130,
131,
132,
133]. In other words, performing RTRT using PAT application in real time to manage the correlation identified based on the QbD approach enables CPV through the production of high-quality drug products with guaranteed product qualification throughout the manufacturing process.
Figure 1. Framework of process analytical technology (PAT) application in quality by design (QbD) approach.
3. PAT Tools for the Pharmaceutical Manufacturing Process
3.1. Near-Infrared Spectroscopy (NIRS)
After discovery by Herschel in the 1800s, NIRS has been applied as a useful spectral analysis technology in many studies. NIRS is a qualitative and quantitative analysis based on the transmittance and reflectance generated by molecular vibrational motion using light in the near-infrared range of 780–2800 nm. It is most often used in the pharmaceutical industry as a real-time process-monitoring tool for product quality control and quality assurance during processing [
11,
19,
20,
21,
22,
23,
24]. The NIRS is connected to a fiber optic probe, and the QA of the product in the process is non-destructively measured by the transmission and reflection of the NIRS by the sample, and quality control through real-time monitoring is possible [
19]. The inside of the probe is composed of an optical fiber, a lens, mirror, and signal channel, and the outside of the probe is made of a corrosion-resistant material. It is connected through a sapphire window, so it can be effectively used even in poor process conditions. When the probe is connected to the NIR spectrometer, the light emitted from the light source is focused by the focusing lens. The light reflected by the mirror located at the tip of the probe is transmitted to the NIR spectrum by reflecting a sample. The transmitted signal forms a spectrum through computer software connected to the NIR spectrometer. However, a disadvantage of NIRS is that it is more difficult to interpret a signal than by using conventional analysis methods, such as chromatography, ultraviolet/visible (UV-VIS) light, and others, because the absorption bands overlap due to spectral complexity. In addition, because this is a relative approach, it is necessary to form and verify an accurate correction model using a reference method to utilize it effectively [
20]. Nevertheless, NIRS can non-destructively measure the IQAs of a product in a short time during the process, and it can be used as a tool for RTRT in the pharmaceutical industry by enabling the process control and quality assurance of finished products through real-time monitoring [
7,
21,
72,
134,
135,
136,
137,
138,
139,
140,
141,
142,
143,
144,
145,
146,
147,
148,
149,
150,
151,
152,
153,
154,
155,
156]. Some literature, which shows that PAT is highly applicable to CPV through RTRT, conducted to monitor and evaluate product quality by applying NIRS as a PAT tool, are presented below in various pharmaceutical industries.
3.2. Raman Spectroscopy
Similar to NIRS, Raman spectroscopy is a noncontact analysis technology that uses optical fibers [
157]. Raman spectroscopy is a type of vibration spectroscopy. Various Raman laser sources offer a range of wavelengths (generally 785 nm), from the UV-VIS to near-infrared regions; the most common are visible light lasers [
158]. In general, vibrations occur in chemical bonds that are not rigid, and materials can be characterized based on their molecular-vibration frequencies. Raman spectroscopy is widely used in pharmaceutical manufacturing because it enables the rapid characterization of the chemical composition and structure of a solid, liquid, gas, gel, or powder sample by providing the detailed characteristics of their vibrational transitions [
1]. Raman spectroscopy is used to determine the molecule in the sample, and their intensity enables the calculation of the drug content of a particular sample. One of the main reasons for using PAT is to build and qualitatively analyze the specificity library of the raw material spectrum, including impurities in the sample [
158]. Raman spectroscopy is ideally suited for PAT systems because it has the flexibility to operate on-line or in-line. Moreover, it provides both quantitative and qualitative data, enabling accurate and consistent monitoring and control during real-time processes. Depending on the compound, the Raman spectrum for a specific molecule differs for each movement of the scattered photon energy, and because it has a unique fingerprint, it enables the monitoring of qualitative information [
8,
159]. Furthermore, it can be used for analyzing liquid products without moisture interference, similar to Fourier-transform infrared spectroscopy (FTIR) or NIRS, and has a high measurement speed.
Similar to other spectroscopy methods, Raman spectroscopy is commonly used as a real-time monitoring tool for CPV in various pharmaceutical unit processes, including blending, granulation, coating, and tableting. It can analyze the IQAs and CQAs of drug content [
160,
161,
162] during the blending process, moisture content [
8,
9] during the drying and granulation process, and coating thickness and content [
157,
163,
164] during the coating process, as well as enable polymorph identification in API preparation [
165,
166,
167], granule-formulation analysis [
8], blending uniformity [
27,
168], particle-size analysis [
16,
159,
169], and others.
3.3. Hyperspectral Imaging (HSI)
HSI is well known for chemical or spectral imaging. It is a nondestructive PAT tool that can extract both spatial and spectral information from an object by integrating existing imaging and spectroscopy techniques. HSI can be applied to various wavelength ranges, including visual, near-infrared, and short-wave infrared (1000–2500 nm). Each pixel of the image acquired by the HSI tool, which contains a spectrum of a specific location, comprises hundreds of consecutive wavelength bands in each space. This generates a large amount of information because the spectrum is constantly acquired from a wide range. Similar to other spectroscopy methods, the preprocessing of the acquired data cube must be performed on qualitative and quantitative images by extracting information in an easy-to-understand image format [
170]. HSI provides dependable chemical and spatial imaging data on the content and distribution of API and excipients during the processes of blending, granulation, and tableting [
170]. The acquired images are combined and processed in three dimensions (3D) to form the data cube. The x and y dimensions of the formed cube are shown as the two space dimensions, whereas λ is the spectral dimension. There are four basic techniques (spatial scanning, spectral scanning, nonscan, and spatiotemporal scanning) for acquiring 3D (x, y, λ) data in a hyperspectral cube, and the choice of technology depends on the specific application. HIS as an on-line PAT tool has been used to monitor blending uniformity and analyze tablet variability [
171]. Moreover, it can analyze the sample to be measured faster than spectroscopy, and it is also used for package monitoring to ensure products are correctly placed in the package, identify defective tablets, or detect empty slots in a package [
172]. Kandpal et al. studied an in-line HIS system for monitoring drug content in microtablets’ surface. The collected multivariate data were evaluated by applying the PLSR and PCR chemometric model. The authors showed a high predictive ability and proposed a quick in-line determination of product quality using HIS.
3.4. Terahertz Pulse Imaging (TPI)
TPI, a widely used PAT tool for real-time imaging, is applied for monitoring tablet surface and coating analysis [
173]. The terahertz absorption spectrum is related to the 3D arrangement and covers the spectral range of 0.1–4.0 THz, which corresponds to the range between the infrared and microwave frequencies. For this reason, the terahertz region is known as far-infrared radiation. Compared with infrared radiation, it has the advantage of causing little scattering because of its longer wavelength, and lower radiation energy interacting with drugs is less likely to damage the sample [
173]. Furthermore, TPI is widely used as a noninvasive method because it uses nonionizing radiation and is safe to use. As mentioned previously, TPI is mainly used in the pharmaceutical coating process. In particular, it is used for predicting the degree of coating thickness in sustained-release tablets, in which the coating thickness is directly related to drug release [
164,
174,
175,
176]. If drug release is via the coating instead of through the dissolution of the tablet, then it can be predicted by analyzing the coating formulation using TPI.
3.5. Mass Spectrometry (MS)
MS is an extremely useful PAT tool for the qualitative analysis of drug, compound, and related substances. Because it has a high resolution and mass accuracy, it is also used in the qualitative analysis of small molecules and is often selected and used in biological processes, such as in analyzing heterogeneous biomolecules [
177,
178,
179]. In addition, it provides quick analysis when high throughput sample preparation and automated data processing are possible [
8]. The mass spectrum is commonly employed to obtain the identity of two compounds or to establish the structure of a new compound and provides the accurate molecular weight or molecular formula to indicate the existence of a specific structural unit in a molecule. The main advantage of MS is its ability to measure several types of compounds with excellent discrimination over a very short analysis time. Moreover, it is used to quantitatively analyze known substances or identify unknown compounds in a sample and to reveal the structure and chemical properties of other molecules. To perform MS, a vacuum must be maintained, and the sample needs to be vaporized and ionized. Thus, the disadvantage of MS is that a sample cannot be analyzed if it cannot be decomposed and evaporated. The typical applications of MS include the real-time control of the drying process, particularly the monitoring of the trace amounts of organic solvents used in the production of intermediate and finished products.
3.6. Acoustic Resonance Spectrometry (ARS)
ARS as a PAT tool detects and analyzes the sound generated during the pharmaceutical process. The sound detected by ARS is much higher than the frequencies detectable by the human ear [
180,
181]. It is usually applied to processes that cause acoustic emission and is applied to the chemical reaction checking or blending, pulverization, and fluidized-bed granulation of the drugs. For example, during the granulation process, particles emit various sounds when they collide with each other and cause friction in the equipment. As with most PAT tools, ARS is noninvasive, does not require sample preparation, and has the advantage of being an inexpensive and convenient application method. Using acoustic emission, quantitative information, such as particle characteristics and moisture content, can be obtained. Changes in the physical properties of the powder, such as compression characteristics and distribution characteristics, can be monitored. Tsujimoto et al. used ARS to monitor and characterize particle motion due to friction occurring during the fluidized-bed granulation process; they also monitored the behavior of particles via the correlation between ARS and particle motion. ARS was installed at the bottom of the fluidized-bed granulator, and the collected sound was amplified and the sensitivity optimized to analyze the frequency. The impact of particles hitting the chamber wall increased with the increasing rotational speed of the fluidized-bed granulator, resulting in the subsequent increase of the AE amplitude. In addition, the instability due to the increased amount of spray solution, i.e., increased moisture content, could be detected during the fluidized-bed granulation process by ARS [
180].
3.7. Spatial Filter Velocimetry (SFV)
Similar to FBRM, SFV is a technique that measures the chord length of a moving particle in real time. Therefore, it is used as a PAT tool for the real-time monitoring of particle size, size distribution, and shape in various solid dosage manufacturing processes, including fluidized-bed granulation/coating, grinding, and spray-drying [
147,
153,
182,
183,
184]. However, unlike FBRM, which uses backscattered laser light, SFV applies a shadow to calculate the particle code length. When the particles pass through a parallel laser beam, a shadow is created in the linear fiber-optic array, and a secondary pulse signal is generated by a single fiber. Hence, it is possible to measure the size and velocity of individual particles simultaneously and calculate the chord length of the particle by using the time of the pulse signal and velocity of the moving particle [
77]. Therefore, monitoring using SFV allows quality control to be performed by evaluating the properties of intermediate and finished products in a non-invasive method without special sampling procedures. Due to these characteristics, SFV can be used as a monitoring tool in CPV through RTRT.
3.8. Focused Beam Reflectance Measurement (FBRM)
FBRM is a technique that provides information on the code length distribution of a population of dispersed particles based on the backscattering of laser light. In the pharmaceutical industry, it is suitable for studying particle properties in suspension [
185,
186,
187,
188], emulsion [
189,
190,
191,
192], and crystallization [
193,
194]. Therefore, FBRM is used as a tool to evaluate IQAs including particle size, size distribution, shape, and particle-growth behavior in granulation and crystallization processes, which can have a great influence on the quality of the finished product due to particle properties, and to perform real time monitoring [
195]. In the case of FBRM, a laser beam connected to the probe via a fiber is inserted into the process equipment through a sapphire window at the end of the probe. At this time, some of the light scattering generated by the laser beam crossing the particles by high-speed rotational motion is transmitted to the detector to generate the code length. Thousands of code lengths are measured simultaneously, and based on this, a code-length distribution can be generated to measure particle properties such as particle size and size distribution in real-time [
92,
93,
95].
3.9. X-ray Fluorescence (XRF)
XRF is an atomic analysis technique used to determine the component of a variety of sample types, including solids, liquids, slurries, and powders, similar to inductively coupled plasma light atomic emission spectroscopy (ICP-AES) and atomic absorption spectroscopy (AAS). AAS and ICP-AES are widely used in the pharmaceutical industry for atomic high-sensitivity analysis because they can measure >70 different elements. However, only a specific analyte can be measured by the cathode lamp, and sample preparation takes longer because of the acid-decomposition procedure. Moreover, there are obvious disadvantages because of the large space requirement and high maintenance cost. As an alternative, XRF was developed [
196]. XRF is a chemical analysis method based on the transfer of internal electrons and the interaction of X-ray radiation and atoms. High-energy X-rays attack electrons in high-energy atoms, leading to their release [
16]. Hence, a vacancy is created in the inner shell, and electrons in the outer orbit are moved to cover the vacancy, thereby generating fluorescent X-rays because of the energy difference between the two orbits. Because each element has an electron of its own energy level, elemental analysis is possible as a result of the unique energy difference resulting from the characteristic X-ray irradiation [
197]. Therefore, XRF has the advantage of high selectivity, a small number of collected spectra, and a lack of overlap [
198]. The obtained spectrum of XRF indicates the properties of each element, and the intensity of the spectrum indicates the content of the element present in the sample [
196]. XRF is unaffected by the matrix effect because it reduces the absorption and scattering of the X-ray beam between the sample and the matrix. Moreover, the sample preparation time is short, and the method is relatively simple because of its high sensitivity [
199]. XRF is highly applicable to CPV in the pharmaceutical industry as it allows simpler data analysis because of its lesser influence on the non-overlapping spectrum and matrix effect, as well as its ability to nondestructively quantify multiple elements at the same time. This is explained through research cases in which the quality evaluation of intermediate and finished products was performed through the real-time monitoring of various manufacturing processes in the pharmaceutical industry.
3.10. Other PAT Tools
OCT (optical coherence tomography) is a high-resolution imaging method that can non-destructively measure the depth of translucent or cloudy materials. In the pharmaceutical industry, it is used to measure coating thickness and uniformity during the coating process by applying the same principles as TPI. OCT can compensate for the shortcomings of TPI’s low resolution and long measurement time and enables high resolution due to its relatively short wavelength [
200,
201]. However, imaging the thickness of the coating can be difficult due to strong scattering that limits the depth of penetration into the coating matrix and does not produce a clear refractive index difference. Nevertheless, it can measure not only the coating thickness but also the coating homogeneity within the tablet and has the advantage of being less affected by probe contamination and measurement location during the process compared to NIRS or Raman spectroscopy. Therefore, in the pharmaceutical industry, OCT is widely used as a real-time monitoring tool for the quality control of intermediate and finished products, and several studies have applied this tool to RTRT to prove the possibility of CPV [
200]. Eyecon is a direct imaging analyzer of particle size. It does not require sampling and automatically captures data regarding the particle size and shape of the powder or variations to analyze the process. Another PAT tool is microwave resonance technology (MRT). MRT can measure moisture during the granulation process by noting the interaction between water molecules and the changing electromagnetic field. Unlike spectroscopy, such as NIRS and Raman spectroscopy, MRT does not require any mathematical preprocessing of the collected data.
This entry is adapted from the peer-reviewed paper 10.3390/pharmaceutics13060919