Your browser does not fully support modern features. Please upgrade for a smoother experience.
Please note this is an old version of this entry, which may differ significantly from the current revision.
Subjects:
Clinical Neurology
The Rubinstein-Taybi syndrome (RSTS) is a rare congenital developmental disorder characterized by a typical facial dysmorphism, distal limb abnormalities, intellectual disability, and many additional phenotypical features. It occurs at between 1/100,000 and 1/125,000 births.
- Rubinstein-Taybi syndrome
- CREBBP
- EP300
- epigenetics
- chromatin
- acetylation
- chromatinopathies
- phenotype
- genotype
1. Introduction
Rubinstein-Taybi syndrome (RSTS; OMIM #180849, OMIM #613684), formerly called thumb syndrome and hallux larges, is a rare neurodevelopmental genetic abnormality whose incidence is currently estimated between 1/100,000 and 1/125,000 births [1]. The transmission is autosomal dominant and the vast majority of cases (~99%) occur sporadically de novo although a few familial cases have been reported [2,3,4].
This syndrome is now well-defined phenotypically and is characterized primarily by post-natal growth retardation, characteristic facial dysmorphia, large thumbs and hallux, and intellectual deficit [5,6]. There are no pathognomonic criteria for RSTS but there is a broad phenotypic spectrum associated with these cardinal signs. Multiple malformations are reported, including cardiac, genitourinary, digestive, Ear-Nose-Throat (ENT), and skin malformations. Patients also present an increased risk of developing benign tumors [1,5,7,8,9,10,11].
Pathogenic variants in two highly evolutionarily conserved genes have been implicated in the etiology of RSTS: the CREBBP gene encoding the cAMP response element-binding protein (CREB) binding protein (NM_600140) located in 16p13.3 [12] and the EP300 gene encoding the EA1-associated protein p300 (NM_602700) located in 22q13 [13]. These two genes are ubiquitously expressed and encode acetyltransferases with a major role in histone acetylation and chromatin remodeling involved notably in neuronal plasticity and cognition [13,14]. The Rubinstein-Taybi syndrome is a developmental disorder whose physiopathology is based primarily on an epigenetic mechanism, belonging thereby to the group of “Chromatinopathies” defined as Mendelian disorders of the epigenetic machinery, as reviewed in [15].
2. Clinical Description
In 1957, the first description of this syndrome was reported by Michail et al. [16], as a case presenting wide thumbs with a radial deviation. However, this syndrome remained relatively unknown until 1960 when J. H. Rubinstein, a pediatrician, and H. Taybi, a radiologist, reported seven children with large thumbs a

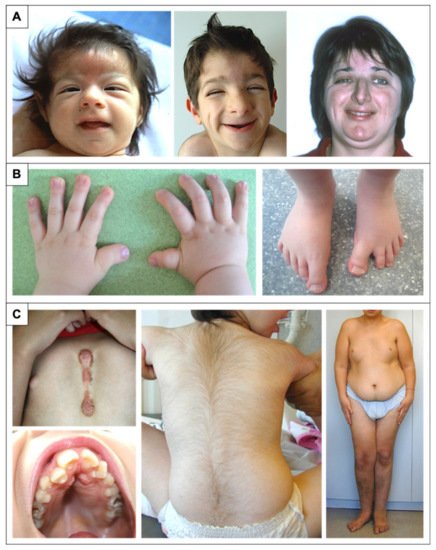
Figure 1. Physical features in RSTS patients. (A) Evolution of the phenotype from birth to adulthood. The glabellar hemangioma classically disappears during childhood. The palpebral slits are more oriented downward and outward. Nasal features are more obvious with a prominent nose and a protruding columella. The characteristic grimacing smile with closure of the palpebral fissures and bilateral and asymmetric ptosis of the eyelids can also be noted. The patient on the left was previously reported at 2 months of age by Lacombe et al. [81]. The patients in the middle and on the right have not been reported in any publication to date and were 4 and 33 years old, respectively, at the time of description. (B) Distal limb abnormalities with broad thumbs and halluces. Characteristic aspect of short, broad hands with broad thumbs with radial deviation and spatulate last phalanges; enlarged halluces are a near-constant sign. (C) Additional classic features in RSTS. We can note the formation of a keloid scar post-sternotomy for cardiac surgery; the highly arched palate with the presence of talon cusps of the four upper incisors and the dental caries of the premolars; the hypertrichosis and the risk of being overweight or obese during adolescence.
nd hallux and minor facial feature and intellectual disability [6]. Since then, this syndrome has been clearly identified as a severe abnormality of embryonic development.3. Genotype and Mutation Spectrum
Rubinstein-Taybi syndrome is inherited as an autosomal dominant trait. However, the occurrence is sporadic in the large majority of cases (~99%), with mutation occurring de novo in the family. In most families, the index case is the only member with the disease. However, cases of moderately affected relatives by somatic mosaicism have been reported [2,82,83,84] up to familial forms transmitted by one affected parent [2,4,85,86,87], confirming the clinical heterogeneity of the syndrome.
Historically, the location of the first gene involved in RSTS at 16p13.3 was identified by Imaizumi et al. in 1991 [88,89] and confirmed in 1992 by the works of Lacombe et al. [81] and Tommerup et al. [90]. Then, in 1995, Petrij et al. [12] identified this gene as CREBBP which encodes the cAMP response element-binding protein (CREB) binding protein. Initially, this protein was given this name because it was described as a partner of the CREB transcription factor [91]. Ten years later, mutations were identified in a CREBBP paralog gene, EP300 as an alternative cause of RSTS [13]. EP300 encodes the p300 protein that was originally described as a factor interacting with the EA1 protein of adenovirus type 5 [92,93].
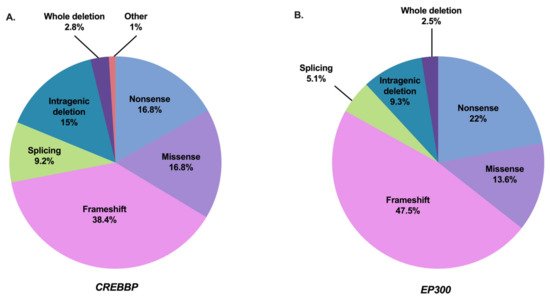
The syndrome has been subdivided into type 1 associated with the CREBBP mutation spectrum (RSTS1; OMIM #180849) and type 2 associated with the EP300 mutation spectrum (RSTS2; OMIM #613684). The frequency of abnormalities in the responsible CREBBP gene is approximately 55–75% of cases [2,12,13,37,65,94,95,96,97,98,99]. To date, 500 pathogenic variants in this gene have been referenced as causing RSTS1 (55 of which are unpublished) based on the HGMDPro variant and LOVD databases (analyzed on 27 April 2021) [100,101] (Tables S1 and S3). The mutational spectrum includes 80.2% point mutations of which 55.2% are truncating mutations, 9.2% splicing mutations, and 16.8% missense mutations, 18.8% correspond to large rearrangements [100,101] (Figure 2A). There are no real hot spot mutations in CREBBP with a mutational spectrum distributed along the 31 exons. However, some recurrent mutations have been described and it is noted that about 52% of the reported missense mutations are located in the lysine acetyltranferase (KAT domain) [99]. An exception to this is the presence of an unstable region of CREBBP located between introns 1 and 2, characterized by a high frequency of repeated or palindromic sequences resulting in recurrent rearrangements in this region [37,102,103,104]. The presence of these heterozygous mutations or microrearrangements suggests a haploinsufficiency mechanism leading to the developmental abnormalities observed in the syndrome.

Figure 2. Mutation spectrum of CREBBP and EP300 in RSTS individuals referenced in the literature and HGMDPro variant or LOVD databases [100,101]. (A) Repartition of all 500 pathogenic variants in CREBBP gene referenced as causing RSTS1 including 84 nonsense mutations, 192 frameshift mutations, 46 splicing mutations, 84 missense mutations, 75 intragenic deletions, 14 deletions including the entire CREBBP gene, and 5 other abnormalities (2 intragenic duplications and 3 complex rearrangements). (B) Repartition of all 118 pathogenic variants in EP300 gene referenced as causing RSTS2 including 26 nonsense mutations, 56 frameshift mutations, 6 splicing mutations, 16 missense mutations, 11 intragenic deletions, and 3 deletions encompassing the entire EP300 gene.
Abnormalities in the EP300 gene are responsible for about 8–11% of cases [2,13,17,18,19,20,21,22,44,99,105,106,107]. To date, 118 pathogenic variants in this gene have been referenced as causing RSTS2 (eight of which are unpublished) based on HGMDPro variant and LOVD databases (on 27 April 2021) [100,101] (Tables S2 and S3). The mutational spectrum includes 84.7% point mutations of which 69.5% are truncating mutations, 5.1% splicing mutations, and 13.6% missense mutations for 11.8% large rearrangements [100,101] (Figure 2B). Like CREBBP, there is no hot spot mutation in EP300, with only four pathogenic variants referenced more than twice in the databases: three in the catalytic domain and one in exon 2 [100,101]. In contrast, almost all of the predicted pathogenic missense mutations of EP300-associated RSTS are located in the KAT domain. Only three patients with RSTS have been reported in the literature with a missense mutation in EP300 out of KAT domain. However, each of these mutations was inherited from a healthy parent, making the pathogenic involvement of these variants difficult.
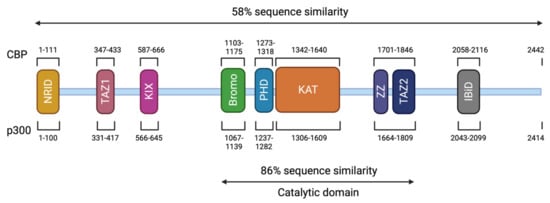
CREBBP and EP300 contain 31 exons and span approximately 155 kilobases (kb) and 87 kb, respectively [18,107,108]. The CBP (or KAT3A) and p300 (or KAT3B) proteins are paralogous transcriptional coactivators with intrinsic KAT activity. They are the only two members of the KAT3 family due to their low sequence homology to other acetyltransferases in the human genome [109] (Figure 3). They share a similar structure with different functional domains, including different types of protein–protein interaction motifs, and have high sequence identity (58% overall). On the N-terminal side, there is a nuclear receptor interaction domain (NRID or RID), that can bind to PXXP motifs. There are three cysteine-histidine-rich regions (C/H1 to C/H3) involved in protein–protein interactions. The C/H1 and C/H3 domains contain zinc finger transcriptional adapters (TAZ1 and TAZ2), and the C/H3 domain also contains a ZZ zinc finger domain and interacts with the EA1 oncoprotein. C/H2 contains a homeodomain (PHD). The catalytic domain has been highly conserved during evolution with 86% of similarity between CBP and p300. It includes a KAT domain and flanking regions (Bromodomain, C/H2, and C/H3 regions) [110,111]. Other non-catalytic domains show a high sequence similarity. The KIX domain allows the interaction of CREB, specifically at phosphorylated residue 133 (Ser133) of the CREB protein, with other transcription factors, and finally, a bromodomain (BD) links acetylated lysines [112]. On the C-terminal side of p300/CBP, there is an interferon-binding transactivation domain (IBiD), which contains a nuclear binding coactivator domain (NCBD) and a glutamine-rich domain, followed by a proline-containing PxP motif [113,114] (Figure 3).

Figure 3. Structure of CBP and p300. The CBP protein is composed of 2442 amino acids (AA) and has a molecular weight of approximately 265 kDa. The p300 protein is composed of 2414 AA and has a molecular weight of approximately 265 kDa. These two proteins present 58% of sequence similarity within their domains. The different domains are represented and correspond to an N-terminal nuclear receptor interaction domain (NRID or RID), three cysteine-histidine rich regions (C/H1 and C/H3 domains contain zinc finger transcriptional adapters (TAZ1 and TAZ2), and C/H2 contains a homeodomain (PHD)), a KIX domain, a Bromodomain, a Lysine acetyltransferase domain (KAT) and an interferon-binding transactivation domain (IBiD). The position of the different domains is indicated relative to the position in the amino acid sequence. The catalytic domain has been highly conserved during evolution with 86% of similarity between CBP and p300 including the KAT domain and flanking regions.
These two proteins are able to interact with the basic transcription factors, TATA-binding protein (TBP) and TFIIB, and can form a complex with RNApolII [114,115,116]. These interactions allow KAT3 enzymes to play a crucial role in transcription initiation. They are also cofactors for oncoproteins, for viral protein processing (e.g., E1A), or for tumor suppressor proteins (e.g., p53 or BRCA1) [117]. Thus, CBP and p300 promote transcription in two ways: on one hand, they act as a bridge, linking transcription factors binding DNA to the transcription machinery, and on the other hand, by acetylation of histones, they create a chromatin environment favoring gene expression (Figure 4). This histone acetylation will play a key role in transcriptional activation by two distinct molecular mechanisms. Firstly, acetylation will partially neutralize the positive charge of histones, which will weaken their interaction with DNA. This will allow the opening of the chromatin structure and thus facilitate the access of transcription factors to their recognition elements [118]. Secondly, acetylated lysines can create a specific signal for regulatory factors or chromatin remodeling complexes to target a specific region. In contrast, histone deacetylation mediated by histone deacetylase (HDAC) will be associated with the repression of gene expression [119]. Apart from transcription, p300 and CBP act indirectly in other nuclear processes through their interaction with several proteins (which they often acetylate) involved in DNA replication and repair [120,121]. They have also been implicated in the regulation of cell cycle progression through interactions with cyclin E and cyclin-dependent kinase 260, as well as in intranuclear transport through acetylation of importin-α [122].

Figure 4. Functions of CBP/p300 as scaffold, bridge, and lysine acetyl transferase (KAT) activity. CBP and p300 act as transcriptional co-activators of target genes by different mechanisms: (1) Scaffolding function allowing the recruitment of transcription factors (TF) and in particular CREB; (2) Binding function by facilitating the physical and functional interactions of TFs; (3) KAT function by catalyzing the transfer of acetyl groups on lysine residues of both histone tails and non-histone proteins such as the RNApolIIcomplex and TFs. TBP: TATA binding protein; TF: transcription factor; Ac: acetyl group.
4. Phenotype-Genotype Correlations
Early studies of phenotype-genotype correlations, prior to the discovery of the involvement of the EP300 gene, initially compared CREBBP-mutated patients to patients with a clinical diagnosis without mutations identified in CREBBP [38,96,123,124]. The comparison of groups with and without identified mutations, across all these studies, did not reveal significant differences in phenotypic aspects, level of psychomotor or intellectual development, prevalence of organ malformations, or tumor predisposition.
Subsequently, the description of patients with EP300 mutation allowed comparisons between RTS1-related CREBBP and RSTS2-related EP300 patients. These studies have shown that the phenotype of EP300 mutation carriers is similar to those of CREBBP but in a milder form [18,19,20,22,105,106,107,125]. More recent studies on larger cohorts have confirmed these results by refining the phenotypic aspects. The facial appearance is less marked except for the protruding columella which appears equally frequent in both populations. Extremity anomalies are similar to those seen in CREBBP-mutated patients but are less frequent. The exception to this is the absence of radial deviation of the thumb in almost all EP300-mutated patients [17,21,44]. Similarly, all degrees of intellectual deficits are observed but in general, the cognitive level is higher in EP300-mutated patients. Notably, microcephaly is significantly more observed in EP300-mutated patients (83–86% of cases) compared to CREBBP-mutated patients (54% of cases). There was no significant difference in the existence of organ malformations between the two groups of patients [17,21,44]. Several studies have reported a higher rate of intra uterine growth retardation (IUGR) as well as cases of pre-eclampsia and gestational hypertension in pregnancies of children carrying a mutation in EP300 [18,19,20]. The works of Fergelot et al. and Cohen et al. tends to confirm this observation, since 42% to 50% of patients with EP300 mutations developed IUGR, compared to 25% of the CREBBP cohort [17,21]. Furthermore, in the general population, the rate of preeclampsia during pregnancy is estimated to be between 5% and 8% [23] compared with 23% to 33% of EP300 cases and 3% of CREBBP cases. The main clinical findings and their frequency in RSTS1 individuals compared to RSTS2 individuals are summarized in Table 1.
Table 1. Summary of the main phenotypic features in RSTS individuals carrying a CREBBP mutation compared to RSTS individuals with an EP300 mutation reported in the literature. According to Fergelot et al., Yu et al., Pérez-Grijalba et al., Cross et al., and Cohen et al. [17,21,37,99,126].
| Phenotypic Features | CREBBP (n = 422) | EP300 (n = 74) | ||
|---|---|---|---|---|
| Percentage | Number | Percentage | Number | |
| Intrauterine growth retardation | 25 | 55/220 | 43.1 | 25/58 |
| Preeclampsia | 3.4 | 2/59 | 25 | 16/64 |
| Postnatal growth retardation | 62.3 | 203/326 | 59.7 | 43/72 |
| Microcephaly | 52.7 | 129/245 | 82.4 | 61/74 |
| Hypertrichosis | 76.4 | 123/161 | 47.4 | 27/57 |
| Facial dysmorphism | ||||
| Arched eyebrows | 85.6 | 119/139 | 65.6 | 42/64 |
| Long eyelashes | 88.6 | 109/123 | 83.6 | 51/61 |
| Downslanted palpebral fissures | 81.1 | 258/318 | 51.6 | 33/64 |
| Beaked nose | 81.7 | 272/333 | 37.5 | 24/64 |
| Columella below alae nasi | 87.4 | 228/261 | 82.8 | 53/64 |
| Highly arched palate | 79.8 | 197/247 | 56.1 | 32/57 |
| Micrognathia | 64.2 | 149/232 | 40.6 | 26/64 |
| Grimacing smile | 94.9 | 112/118 | 36.8 | 21/57 |
| Low-set ears | 51.1 | 112/219 | 23.4 | 15/64 |
| Broad thumbs/halluces | 92.3 | 373/404 | 59.5 | 44/74 |
| Angulated thumbs | 56.4 | 184/326 | 4.8 | 3/63 |
| Intellectual disability | 82.2 | 287/349 | 84.9 | 62/73 |
| Severe | 35.9 | 33/92 | 7.3 | 3/41 |
| Moderate | 47.8 | 44/92 | 26.8 | 11/41 |
| Mild | 14.1 | 13/92 | 65.9 | 27/41 |
| Autism/Behavioral problems | 49.4 | 78/158 | 21.3 | 13/61 |
| Cardiovascular anomalies | 34.5 | 99/287 | 29 | 20/69 |
| Urinary tract anomalies | 37.4 | 61/163 | 26.3 | 15/57 |
A correlation between the severity of the phenotype and the presence of large exonic deletions or alterations in function-relevant protein domains or leading to a truncated protein before the KAT domain has been initially suggested [38,123,127]. Thanks to recent studies, no significant phenotype/genotype correlation could be shown between the phenotype and the mutation type and location or deletion size for either CREBBP or EP300 genes in RSTS patients [17,37,99,104].
However, a new clinical entity has recently emerged with the identification of missense mutations between the end of exon 30 and the beginning of exon 31 of CREBBP and EP300 related non-RSTS phenotype, referred to as Menke-Hennekam syndrome (MKHK, OMIM #618332) [128,129,130]. Patients present a different syndrome which is not RSTS with severe developmental delay, microcephaly, telecanthus, short upturned palpebral fissures, ptosis, depressed nasal bridge, short nose, short columella, anteverted nares, long deep philtrum, low-set ears with a protruding upper part, and fibular deviation of the distal phalanx. These missense variants are located at the ZNF2 (zinc finger, ZZ type) and ZNF3 (zinc finger, TAZ type) domains, which contain cysteine residues important for Zn2+ binding. These domains are involved in stabilizing a helical fold that provides binding interactions with many transcriptional regulatory proteins [131,132]. These data suggest that this group of mutations specifically affects the binding properties of the two zinc finger domains to different CREBBP partners by affecting their own folding.
5. Conclusions and Perspectives
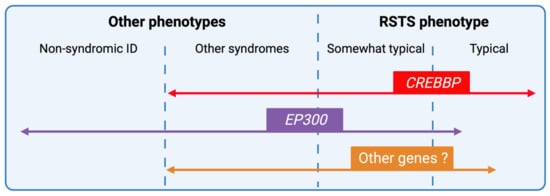
New generation sequencing techniques have improved the understanding of the genetic heterogeneity of the syndrome but also widened the phenotypic spectrum of RSTS by encompassing the broader field of chromatinopathies rendering phenotype/genotype correlations more complex (Figure 6). The emergence of multi-omics approaches, the integration of transcriptomic data coupled to DNA and histone modification profiles, and the development of patient-derived cellular models will likely contribute to a better definition of a specific epigenetic signature to the syndrome.

Figure 6. RSTS phenotypic overlap. Next-generation sequencing techniques have increased the number of genomic alterations identified and associated with RSTS phenotype and the phenotypic spectrum leading to complex phenotype/genotype correlations. CREBBP-mutated individuals present for the majority, a typical clinical diagnosis of RSTS, but the identification of missense mutations in exons 30 and 31 of the gene in patients with non-RSTS phenotype led to the definition of a new clinical entity: the Menke-Hennekam syndrome. EP300-mutated individuals display a wide clinical spectrum ranging from typical but milder RSTS phenotype to non-syndromic intellectual disability (ID), encompassing the phenotype of other chromatinopathies such as Cornelia de Lange syndrome. More recently, genes involved in others chromatinopathies (ASXL1 for Bohring-Opitz syndrome, KMT2A for Wiedemann-Steiner syndrome, and KMT2D for Kabuki syndrome) have been identified in individuals with an RSTS phenotype but in the absence of CREBBP/EP300 mutation. The definition of a specific epigenetic signature might reduce diagnostic deadlocks and open new therapeutic strategies.
Indeed, less data are available on histone acetylation marks and their targets in RSTS. This is partly due to the fact that current mapping is focused on a limited number of marks on H3 and H4 and in particular H3K27ac and H3K9ac. However, recent work by Weinert et al. on the acetylome of RSTS mouse models showed that H2B was a major target of CBP/p300 [177]. These results corroborate the results of Lopez-Atalaya et al. on lymphoblastoid cell lines derived from RSTS patients, showing a global hypoacetylation of H2A and H2B compared to controls [175]. These individual signatures will serve as the basis for the implementation of new multi-omics diagnostic tools for RSTS but will also be applicable to other chromatinopathies and, in the longer term, for rational therapeutic design.
This entry is adapted from the peer-reviewed paper 10.3390/genes12070968
This entry is offline, you can click here to edit this entry!
