SRM comprises optical imaging techniques that offer resolution beyond the diffraction limit of light (~250 nm).
- super-resolution microscopy
- advanced light microscopy
- quantitative microscopy
- live-cell mi-croscopy
- SMLM
Note:All the information in this draft can be edited by authors. And the entry will be online only after authors edit and submit it.
1. Introduction
In humans, influenza viruses cause acute infections in the respiratory tract. Every year, three to five million people develop severe seasonal influenza with up to 650,000 deaths, globally [1]. Although vaccines and some antivirals (e.g. Tamiflu) against seasonal influenza are available, the rapid antigenic drift and shift have [2], to date, made it difficult to obtain broadly neutralizing vaccines effective against multiple viral strains. Due to the alarming pandemic potential of emerging zoonotic influenza viruses [3], the WHO recently listed a ‘Global Influenza Pandemic’ as one of the top 10 threats to global health [4]. The emergence of SARS-CoV-2 and its associated pandemic [5] has greatly emphasised the need to better understand highly transmissible respiratory viruses, including influenza virus.
Influenza virions consist of an RNA genome encased in a lipoprotein membrane (the viral envelope). The viral genome is made up of eight RNA segments, wrapped by the viral nucleoproteins and the RNA polymerase (RNApol made of PB1, PB2 and PA), termed viral ribonucleoprotein complexes (vRNP). The envelope is derived from the host cell plasma membrane and contains two major glycoproteins, hemagglutinin (HA) and neuraminidase (NA), together with the proton channel M2. The M1 protein forms a proteinaceous matrix underneath the envelope, as seen in Figure 1a. HA and NA are essential for infection as they mediate the first steps of entry. HA binds directly to receptors decorated with sialic acid to promote viral entry, whereas NA is capable of cleaving sialic acid from glycoproteins, and is thus mainly involved in viral release from the plasma membrane upon budding as well as penetration of mucus on the respiratory epithelium. As a consequence, the balance between the amount of HA and NA in the viral envelope has been shown to be critical for virus fitness [6]. From a therapeutic point of view, both HA and NA are exposed on the surface of virions making them key anti-viral and vaccine targets. However, antigenic shift and drift are the main drivers for influenza virus diversity and lead to the limited efficacy of annual influenza vaccines [7].
To understand the mechanisms underlying influenza virus replication and of cell-to-cell viral transmission, with a view to developing new anti-viral strategies, one emerging requirement is to be able to directly observe virions and virus-host cell interactions. The small size of influenza virions (~120 nm diameter) has made electron microscopy (EM) the method of choice for these observations. For example, EM has revealed that influenza virus particles can be pleiomorphic, taking shapes from ~120 nm diameter spherical particles to long filamentous forms up to several µm long and ~90 nm in diameter (reviewed in [8,9]), but the relevance of this pleiomorphism to viral infection and pathogenesis in vivo is currently unclear. Cryo-EM has been instrumental in structural studies, showing, for example, that M1 forms a helical array that supports the shape of filamentous particles [10], revealing details of the structure of HA molecules [11], and that the organisation of HA is influenced by the curvature of the viral membrane. This highlights that the lateral distribution and density of HA on the virus are key for entry [12]. Although EM can resolve viral and cellular structures at near-atomic level, its use is usually limited to fixed samples, only providing a snapshot in time of specific events and no, or only low levels of, molecular identification. In contrast, while typically limited to ~250 nm resolution due to the diffraction of light, optical imaging combined with fluorescence has high molecular specificity and is compatible with live-cell imaging.
In recent years, the development of advanced and quantitative fluorescence microscopy and, importantly, that of super-resolution microscopy (SRM) [13] has opened new possibilities for direct imaging of cells and for understanding host-pathogen interactions by providing a powerful combination of enhanced spatial resolution, very high molecular specificity and practical compatibility with live-cell imaging [14]. As an example of the potential of SRM to reveal new insights to viral biology, its application to studies of human immunodeficiency virus (HIV) (reviewed in [15,16]) has revealed new insights into the nanoscale distribution of the viral envelope protein (Env) on the surface of virions [17] and the role of ESCRT complexes in HIV egress [18].
We identified three key opportunities for advanced fluorescence microscopy techniques to provide novel insights into influenza virus biology, as highlighted in Figure 1b–d: (i) Understanding virus structures and associated host cell components at the nanoscale [17–20], (ii) resolving individual viruses among large populations of viruses [21,22] and (iii) observing dynamic processes in real-time [23,24].
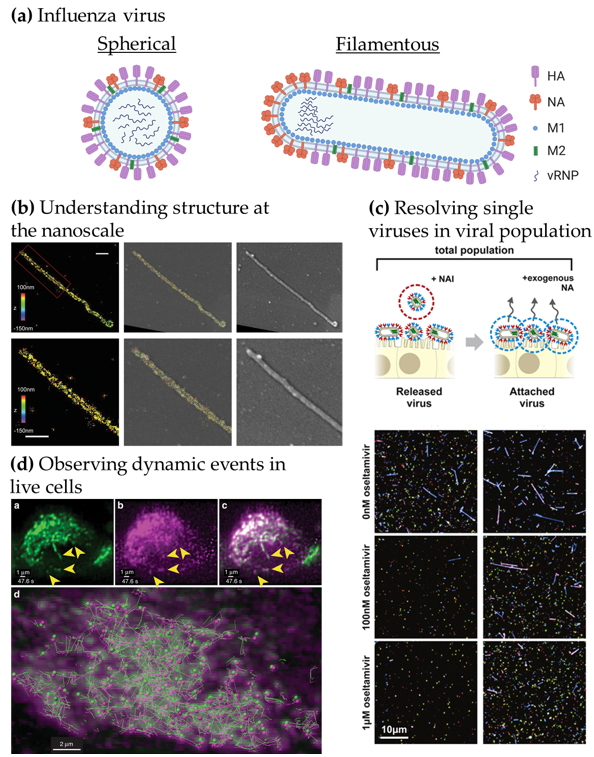
Figure 1. Advanced microscopy gives structural and functional insights into influenza virus replication. (a) Structure of influenza virions. Spherical particles diameter ~120 nm; filamentous particles length up to 20 µm [8,9]. (b) Understanding viral structure at the nanoscale. Correlative 3D-STORM and scanning electron microscopy (SEM) images of filamentous Udorn influenza virus immuno-labelled for HA. Left: STORM image. Right: SEM image. Middle: Overlaid image. Bottom: Magnified views of the region of interest shown on top. Scale bars: 500 nm. Adapted from [19]. (c) Resolving single viruses in viral populations. Influenza-infected cells were treated with oseltamivir, a neuraminidase inhibitor at different concentrations and the “Released” viruses and the viruses that remained “Attached” were imaged. Adapted from [22]. (d) Observing dynamic events in live cells. Live-cell light-sheet three-dimensional (3D) imaging of cells expressing GFP-Rab11A were infected with recombinant influenza expressing mRuby-PA as a marker for the vRNP. Top, left to right: GFP-Rab11A, mRuby-PA, overlay (arrows: colocalizing puncta). Bottom: colocalizing puncta of GFP-Rab11A and mRuby-PA tracks over time. Adapted from [24].
In Figure 1b, the use of correlative EM and three-dimensional (3D)-SRM allowed the distribution of HA in filamentous influenza viruses to be observed at the nanoscale [19], corroborating the structural information from EM to the chemical identity information at the single-molecule level from the SRM technique used here. The nanoscale resolution achieved by SRM is capable of giving information at the molecular organisation level, highlighting specific nanoscale assemblies both in the viral structure [17,25] and in the infected cell [26]. Observing large virus populations at the single-virus level can also be used to directly investigate the diversity of structures within pleiomorphic virus population [21] or the functional effects of drugs, as seen in Figure 1c. Adding the NA inhibitor oseltamivir reduces the release of filamentous viral particles, thus, highlighting a virus shape-specific effect of the drug [22]. Live-cell imaging can offer a wide range of possibilities to observe the replication cycle of influenza virus. In Figure 1d, fluorescence light-sheet microscopy in living cells combined with quantitative particle tracking in 3D showed the co-transport of Rab11A-containing recycling endosomes with influenza viral RNA (vRNA) and the exploitation of this trafficking pathway by the virus [24].
2. Overview of Super-Resolution Microscopy and Novel Imaging Methods to Study Influenza Virus Replication
SRM comprises optical imaging techniques that offer resolution beyond the diffraction limit of light (~250 nm). Figure 2 shows graphical explanations and examples of the main SRM techniques applied to the study of influenza virus replication.
SRM was developed in the mid-1990s, first with stimulated emission depletion (STED) microscopy [27]. STED is a scanning technique based on laser confocal scanning microscopy, which exploits the phenomenon of stimulated emission to quench the fluorescence signal around the excitation scanning point. This effectively reduces the volume of the fluorescence measurement and typically improves resolution down to 50–70 nm. For influenza virus, the resolution gain of STED has been used to follow, for example, vRNPs during viral trafficking along the endosomal pathway in dendritic cells (Figure 2a; [28]). By allowing nanoscale localization of structures, STED provides a powerful way to determine the identity and the structure of the organelles involved in vRNP trafficking with high spatial precision.
A second technique called structured illumination microscopy (SIM) [29] relies on the acquisition of a sequence of fluorescence images obtained under a set of structured illuminations (typically made of stripes), each creating Moiré patterns with the underlying structure of interest. The measured Moiré patterns contain information about high spatial frequencies (high-resolution information) in the sample that can be recovered by image reconstruction of the raw data, typically achieving resolution down to 150 nm. In Figure 2b, 3D SIM imaging is used to show that ubiquitin is packaged inside purified influenza virions [30]. This study showed that ubiquitin is then used during virus entry to recruit the cellular aggresome pathway to facilitate capsid disassembly and release of vRNPs. Despite the limited resolution increase of SIM, it has been successfully used to describe the substructure of viruses, such as vaccinia [31] and the heterogeneous morphology of influenza virions [21].
A third approach to SRM is to exploit the capability of certain fluorescent dyes to blink (photoswitch) under specific experimental conditions. This set of techniques, collectively called single-molecule localization microscopy (SMLM), relies on the use of fluorophores that can be effectively switched on and off in a stochastic manner. By isolating single fluorophores spatio-temporally, it is possible to precisely localize them in space despite each molecule producing a diffraction-limited spot on the camera, and to then build a nanoscale map of fluorophore distribution. SMLM techniques routinely achieve a localization precision of 10–20 nm (Figure 2c). Some of earliest described SMLM techniques, PALM (photo-activated localization microscopy) [32] and fPALM (fluorescence PALM) [33] use genetically engineered photo-activatable fluorescent proteins, whereas STORM (stochastic optical reconstruction microscopy) [34] uses conventional photo-switchable organic dyes such as Cy5. Variations on these original SMLM approaches have been developed including dSTORM (direct STORM) [13,35], PAINT (points accumulation for imaging in nanoscale topography) [36] and GSD (ground state depletion) [37].
An exciting variant of these latter techniques is single-particle tracking PALM (sptPALM), a technology capable of deciphering the spatial organisation and dynamics of individual molecules by randomly photo-activating single-molecules and tracking them in living cells. This approach was originally demonstrated by tracking individual HIV Gag proteins at the plasma membrane of Gag expressing cells [38].
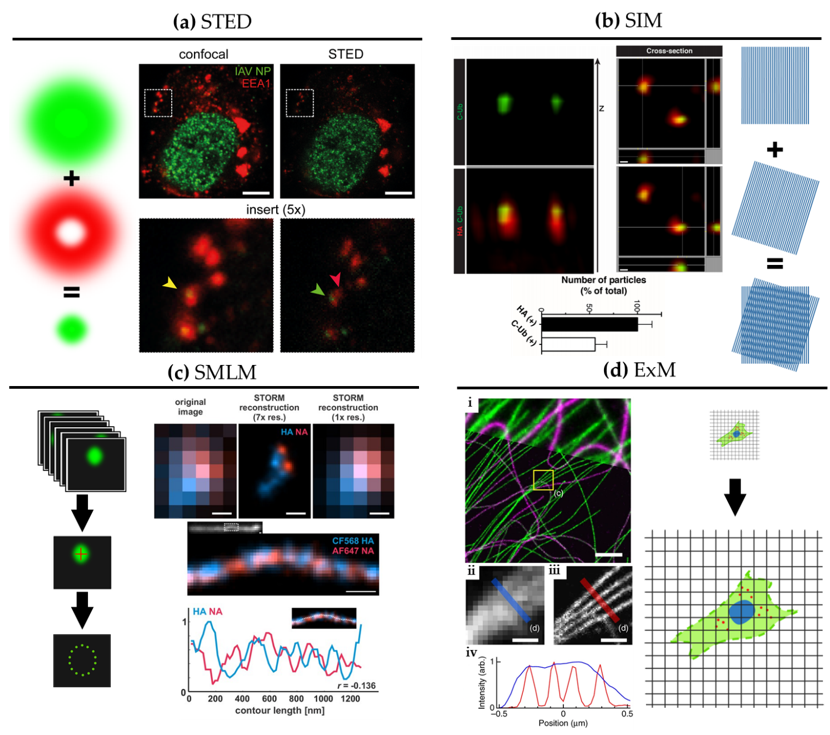
Figure 2. Super-resolution microscopy for the study of influenza virus replication. (a) STED. Confocal (left) and STED (right) images of a dendritic cell 4 hours post-infection with influenza virus vRNP (green) and the early endosomal marker EEA1 (red). Scale bar: 5 μm. Adapted from [28]. (b) SIM. 3D SIM z-stack and cross-section images of purified influenza viruses labelled for hemagglutinin (HA) (red) alongside immuno-labelling of the C-terminus of ubiquitin (C-Ub) (green). Bottom: quantification of HA and C-Ub colocalization. Scale bar: 100 nm. Adapted from [30]. (c) SMLM. Top: diffraction-limited image and dSTORM reconstructions at ~30 nm resolution of influenza viruses labelled for NA (red) and HA (blue). Bottom: dSTORM reconstructions of a filamentous virion labelled for HA and NA at ~30 nm resolution with corresponding intensity profile. HA and NA are shown to exclude one another. Scale bar: 200 nm. Adapted from [39]. (d) ExM. BS-C-1 cell labelled for tyrosinated tubulin (green) and de-tyrosinated tubulin (magenta). (i): Comparison of ExM image (bottom) with corresponding pre-expansion image (top). Scale bars: 2 µm. Insert, pre-(ii) and post-expansion (iii) with corresponding intensity profiles (iv). Scale bars: 500 nm. Adapted from [40].
During influenza virus assembly, it was shown using a biochemistry approach that HA preferentially accumulates in so-called lipid rafts [41,42], mediated through its transmembrane domain [43]. Some of the earliest fPALM experiments, which looked at this association at the plasma membrane of HA-expressing fibroblasts [44], could visualize that HA forms irregular, lipid raft-associated clusters with a similar size range to that of budding virions. The high-resolution of live-cell fPALM enabled different models of membrane organisation to be discerned and revealed the molecular dynamics within the clusters. Further, an early form of SMLM called ‘Blink’ [45] showed that HA at the plasma membrane of infected cells forms dynamic nanodomains of around 80 nm [46]. The small size of these microdomains would be challenging to observe with conventional fluorescence imaging techniques.
Figure 2c shows a filamentous influenza virus imaged with dSTORM. The nanoscale resolution achieved by dSTORM reveals the spatially alternating distribution of HA and NA-rich regions along a filamentous influenza virion.
A newcomer in the SRM field is expansion microscopy (ExM) [47]. This method turns the diffraction limit problem on its head by expanding the sample isotropically in a hydrogel, practically improving the resolution of images by the expansion factor, typically of ~4× [47] and up to ~20× with iterative ExM (iExM) [48]. The approach can even preserve and resolve the integrity of bio-macromolecular assemblies, as successfully demonstrated by visualizing the molecular organisation of the centrosome [49]. In Figure 2d, we show an example of ExM used to study the spatial organisation of cytoskeletal structures in cells. Although some early studies show that ExM can be used to study viral infection and viral assembly [50–52], including for bacteriophage T5 [53], ExM remains under-used in the context of virology despite its potential versatility and ease of use.
Although each of these techniques provides nanoscale imaging, they also have their own advantages and drawbacks which need to be considered when choosing a method. If maximum resolution is required and the imaging is performed on fixed cells, then SMLM can provide an optimal solution. On the other hand, when imaging tissue or thick samples, STED can be an effective method due to its inherent optical sectioning capabilities. SIM, on the other hand, provides an easy and fast solution for live-cell imaging at medium resolution. ExM is not compatible with live sample imaging but constitutes a sample-based approach to SRM that can easily be combined with the other SRM techniques, and thus, provides a novel way to enhance resolution in tissue in 3D.
Beyond SRM, quantitative long-term live-cell imaging has great promise for the study of host-pathogen interactions at relevant temporal and spatial scales. For instance, by being able to visualize viruses and their components interacting with host cells, quantitative live-cell fluorescence microscopy can be used to study the cellular pathways exploited by viruses at the single-cell and single-virion level [8,9,22]. SRM and quantitative live-cell fluorescence microscopy was used to study the uncoating of HIV in living cells with a high temporal resolution providing evidence that the HIV capsid can remain intact while entering the cell nucleus [23]. The study of live-cell dynamics has been further enhanced through light-sheet microscopy, which allows high speed, long-term imaging in 3D with low phototoxicity [54], but this method remains largely underexploited in the context of viral replication, potentially due to the lack of availability of such tools in appropriate containment conditions for live virus imaging.
Further, recent advances in microscopy sensitivity for the detection of single molecules, and the introduction of new and non-invasive labelling strategies such as FlAsH [55], Sfp [56], transglutaminase 2 [57], sortase A [58] with bright fluorescent markers, offer new opportunities for improved live-cell imaging. These new technologies enable the behaviours of viral and cellular components to be mapped dynamically in super-resolution [14], multi-label structural studies using intact viruses [22] and single-particle tracking (SPT) to follow individual virus particles during infection and individual viral components during replication [59–61]. In the context of SPT, a powerful approach has been to use quantum dots (QDs) [62–64], for long-term imaging, but with limitations due to the relative complexity of labelling steps.
Single-molecule Förster Resonance Energy Transfer (smFRET) [65] constitutes a powerful optical method to observe nanoscale changes in conformations within biomolecules, especially when using small peptide labels and quantitative analysis. In the context of influenza, this approach has been used to study the dynamics of fusion-associated low pH-induced HA conformational changes [66]. The direct spatial localization of individual RNA transcripts can be performed by single-molecule fluorescence using in situ hybridization (FISH) [67]. FISH is also well-suited to studies of the assembly of influenza virions and has been used to observe vRNPs in the cytoplasm en route to budding sites [68,69].
We note that these imaging approaches can also benefit from quantitative approaches such as single-particle averaging [21,25,31], machine learning [70,71] and modelling [21,25,72], in order to tease out the most informative features from the imaging data.
References
- Influenza (Seasonal). Available online: https://www.who.int/news-room/fact-sheets/detail/influenza-(seasonal) (accessed on 22 June 2020).
- Houser, K.; Subbarao, K. Influenza Vaccines: Challenges and Solutions. Cell Host Microbe 2015, 17, 295–300, doi:10.1016/j.chom.2015.02.012.
- Mostafa, A.; Abdelwhab, E.M.; Mettenleiter, T.C.; Pleschka, S. Zoonotic Potential of Influenza A Viruses: A Comprehensive Overview. Viruses 2018, 10, 497, doi:10.3390/v10090497.
- World Health Organization. Ten threats to global health in 2019. 2019. Available online: https://www.who.int/news-room/feature-stories/ten-threats-to-global-health-in-2019 (accessed on 29 June 2020).
- Wu, F.; Zhao, S.; Yu, B.; Chen, Y.-M.; Wang, W.; Song, Z.-G.; Hu, Y.; Tao, Z.-W.; Tian, J.-H.; Pei, Y.-Y.; et al. A new coronavirus associated with human respiratory disease in China. Nature 2020, 579, 265–269 doi:10.1038/s41586-020-2008-3.
- Wagner, R.; Matrosovich, M.; Klenk, H.-D. Functional balance between haemagglutinin and neuraminidase in influenza virus infections. Med. Virol. 2002, 12, 159–166, doi:10.1002/rmv.352.
- Gamblin, S.; Skehel, J.J. Influenza Hemagglutinin and Neuraminidase Membrane Glycoproteins. Biol. Chem. 2010, 285, 28403–28409, doi:10.1074/jbc.r110.129809.
- Badham, M.D.; Rossman, J.S. Filamentous Influenza Viruses. Clin. Microbiol. Rep. 2016, 3, 155–161, doi:10.1007/s40588-016-0041-7.
- Dadonaite, B.; Vijayakrishnan, S.; Fodor, E.; Bhella, D.; Hutchinson, E.C. Filamentous influenza viruses. Gen. Virol. 2016, 97, 1755–1764, doi:10.1099/jgv.0.000535.
- Calder, L.J.; Wasilewski, S.; Berriman, J.A.; Rosenthal, P.B. Structural organization of a filamentous influenza A virus. Natl. Acad. Sci. USA 2010, 107, 10685–10690, doi:10.1073/pnas.1002123107.
- Benton, D.J.; Gamblin, S.J.; Rosenthal, P.B.; Skehel, J.J. Structural transitions in influenza haemagglutinin at membrane fusion pH. Cell Biol. 2020, 583, 150–153, doi:10.1038/s41586-020-2333-6.
- Wasilewski, S.; Calder, L.J.; Grant, T.; Rosenthal, P.B. Distribution of surface glycoproteins on influenza A virus determined by electron cryotomography. Vaccine 2012, 30, 7368–7373, doi:10.1016/j.vaccine.2012.09.082.
- Huang, B.; Babcock, H.; Zhuang, X. Breaking the Diffraction Barrier: Super-Resolution Imaging of Cells. Cell 2010, 143, 1047–1058, doi:10.1016/j.cell.2010.12.002.
- Lelek, M.; Di Nunzio, F.; Henriques, R.; Charneau, P.; Arhel, N.J.; Zimmer, C. Superresolution imaging of HIV in infected cells with FlAsH-PALM. Natl. Acad. Sci. USA 2012, 109, 8564–8569, doi:10.1073/pnas.1013267109.
- Müller, B.; Heilemann, M. Shedding new light on viruses: Super-resolution microscopy for studying human immunodeficiency virus. Trends Microbiol. 2013, 21, 522–533, doi:10.1016/j.tim.2013.06.010.
- Chojnacki, J.; Eggeling, C. Super-resolution fluorescence microscopy studies of human immunodeficiency virus. Retrovirology 2018, 15, 1–16, doi:10.1186/s12977-018-0424-3.
- Chojnacki, J.; Staudt, T.; Glass, B.; Bingen, P.; Engelhardt, J.; Anders, M.; Schneider, J.; Müller, B.; Hell, S.W.; Kräusslich, H.-G. Maturation-Dependent HIV-1 Surface Protein Redistribution Revealed by Fluorescence Nanoscopy. Science 2012, 338, 524–528, doi:10.1126/science.1226359.
- Van Engelenburg, S.B.; Shtengel, G.; Sengupta, P.; Waki, K.; Jarnik, M.; Ablan, S.D.; Freed, E.O.; Hess, H.F.; Lippincott-Schwartz, J. Distribution of ESCRT Machinery at HIV Assembly Sites Reveals Virus Scaffolding of ESCRT Subunits. Science 2014, 343, 653–656, doi:10.1126/science.1247786.
- Kim, D.; Deerinck, T.J.; Sigal, Y.M.; Babcock, H.; Ellisman, M.H.; Zhuang, X. Correlative Stochastic Optical Reconstruction Microscopy and Electron Microscopy. PLoS ONE 2015, 10, e0124581, doi:10.1371/journal.pone.0124581.
- Buttler, C.A.; Pezeshkian, N.; Fernandez, M.V.; Aaron, J.; Norman, S.; Freed, E.O.; Van Engelenburg, S.B. Single molecule fate of HIV-1 envelope reveals late-stage viral lattice incorporation. Commun. 2018, 9, 1–15, doi:10.1038/s41467-018-04220-w.
- Laine, R.F.; Goodfellow, G.; Young, L.J.; Travers, J.; Carroll, D.; Dibben, O.; Bright, H.; Kaminski, C.F. Structured illumination microscopy combined with machine learning enables the high throughput analysis and classification of virus structure. eLife 2018, 7, doi:10.7554/eLife.40183.
- Vahey, M.D.; Fletcher, D.A. Low-Fidelity Assembly of Influenza A Virus Promotes Escape from Host Cells. Cell 2019, 176, 281–294.e19, doi:10.1016/j.cell.2018.10.056.
- Burdick, R.C.; Li, C.; Munshi, M.; Rawson, J.M.O.; Nagashima, K.; Hu, W.-S.; Pathak, V.K. HIV-1 uncoats in the nucleus near sites of integration. Natl. Acad. Sci. USA 2020, 117, 5486–5493, doi:10.1073/pnas.1920631117.
- Bhagwat, A.R.; Le Sage, V.; Nturibi, E.; Kulej, K.; Jones, J.E.; Guo, M.; Kim, E.T.; Garcia, B.A.; Weitzman, M.D.; Shroff, H.; et al. Quantitative live cell imaging reveals influenza virus manipulation of Rab11A transport through reduced dynein association. Commun. 2020, 11, 1–14, doi:10.1038/s41467-019-13838-3.
- Laine, R.F.; Albecka, A.; Van De Linde, S.; Rees, E.J.; Crump, C.M.; Kaminski, C.F. Structural analysis of herpes simplex virus by optical super-resolution imaging. Commun. 2015, 6, 5980, doi:10.1038/ncomms6980.
- Sieben, C.; Sezgin, E.; Eggeling, C.; Manley, S. Influenza A viruses use multivalent sialic acid clusters for cell binding and receptor activation. PLoS Pathog. 2020, 16, e1008656, doi:10.1371/journal.ppat.1008656.
- Hell, S.W.; Wichmann, J. Breaking the diffraction resolution limit by stimulated emission: Stimulated-emission-depletion fluorescence microscopy. Lett. 1994, 19, 780–782, doi:10.1364/ol.19.000780.
- Baharom, F.; Thomas, O.S.; Lepzien, R.; Mellman, I.; Chalouni, C.; Smed-Sörensen, A. Visualization of early influenza A virus trafficking in human dendritic cells using STED microscopy. PLoS ONE 2017, 12, e0177920, doi:10.1371/journal.pone.0177920.
- Gustafsson, M.G.L. Surpassing the lateral resolution limit by a factor of two using structured illumination microscopy. SHORT COMMUNICATION. Microsc. 2000, 198, 82–87, doi:10.1046/j.1365-2818.2000.00710.x.
- Banerjee, I.; Miyake, Y.; Nobs, S.P.; Schneider, C.; Horvath, P.; Kopf, M.; Matthias, P.; Helenius, A.; Yamauchi, Y. Influenza A virus uses the aggresome processing machinery for host cell entry. Science 2014, 346, 473–477, doi:10.1126/science.1257037.
- Gray, R.D.M.; Albrecht, D.; Beerli, C.; Huttunen, M.; Cohen, G.H.; White, I.J.; Burden, J.J.; Henriques, R.; Mercer, J. Nanoscale polarization of the entry fusion complex of vaccinia virus drives efficient fusion. Microbiol. 2019, 4, 1636–1644, doi:10.1038/s41564-019-0488-4.
- Betzig, E.; Patterson, G.H.; Sougrat, R.; Lindwasser, O.W.; Olenych, S.; Bonifacino, J.S.; Davidson, M.W.; Lippincott-Schwartz, J.; Hess, H.F. Imaging Intracellular Fluorescent Proteins at Nanometer Resolution. Science 2006, 313, 1642–1645, doi:10.1126/science.1127344.
- Hess, S.T.; Girirajan, T.P.K.; Mason, M.D. Ultra-High Resolution Imaging by Fluorescence Photoactivation Localization Microscopy. J. 2006, 91, 4258–4272, doi:10.1529/biophysj.106.091116.
- Rust, M.J.; Bates, M.; Zhuang, X. Sub-diffraction-limit imaging by stochastic optical reconstruction microscopy (STORM). Methods 2006, 3, 793–796, doi:10.1038/nmeth929.
- Heilemann, M.; Van De Linde, S.; Schüttpelz, M.; Kasper, R.; Seefeldt, B.; Mukherjee, A.; Tinnefeld, P.; Sauer, M. Subdiffraction-Resolution Fluorescence Imaging with Conventional Fluorescent Probes. Chem. Int. Ed. 2008, 47, 6172–6176, doi:10.1002/anie.200802376.
- Sharonov, A.; Hochstrasser, R.M. Wide-field subdiffraction imaging by accumulated binding of diffusing probes. Natl. Acad. Sci. USA 2006, 103, 18911–18916, doi:10.1073/pnas.0609643104.
- Fölling, J.; Bossi, M.; Bock, H.; Medda, R.; A Wurm, C.; Hein, B.; Jakobs, S.; Eggeling, C.; Hell, S.W. Fluorescence nanoscopy by ground-state depletion and single-molecule return. Methods 2008, 5, 943–945, doi:10.1038/nmeth.1257.
- Manley, S.; Gillette, J.M.; Patterson, G.H.; Shroff, H.; Hess, H.F.; Betzig, E.; Lippincott-Schwartz, J. High-density mapping of single-molecule trajectories with photoactivated localization microscopy. Methods 2008, 5, 155–157, doi:10.1038/nmeth.1176.
- Vahey, M.D.; A Fletcher, D. Influenza A virus surface proteins are organized to help penetrate host mucus. eLife 2019, 8, doi:10.7554/elife.43764.
- Chozinski, T.J.; Halpern, A.R.; Okawa, H.; Kim, H.-J.; Tremel, G.J.; Wong, R.O.; Vaughan, J.C. Expansion microscopy with conventional antibodies and fluorescent proteins. Methods 2016, 13, 485–488, doi:10.1038/nmeth.3833.
- Takeda, M.; Leser, G.P.; Russell, C.J.; Lamb, R.A. Influenza virus hemagglutinin concentrates in lipid raft microdomains for efficient viral fusion. Natl. Acad. Sci. USA 2003, 100, 14610–14617, doi:10.1073/pnas.2235620100.
- Simons, K.; Ikonen, E. Functional rafts in cell membranes. Nature 1997, 387, 569–572, doi:10.1038/42408.
- Barman, S.; Nayak, D.P. Analysis of the Transmembrane Domain of Influenza Virus Neuraminidase, a Type II Transmembrane Glycoprotein, for Apical Sorting and Raft Association. Virol. 2000, 74, 6538–6545, doi:10.1128/jvi.74.14.6538-6545.2000.
- Hess, S.T.; Gould, T.J.; Gudheti, M.V.; Maas, S.A.; Mills, K.D.; Zimmerberg, J. Dynamic clustered distribution of hemagglutinin resolved at 40 nm in living cell membranes discriminates between raft theories. Natl. Acad. Sci. USA 2007, 104, 17370–17375, doi:10.1073/pnas.0708066104.
- Steinhauer, C.; Forthmann, C.; Vogelsang, J.; Tinnefeld, P. Superresolution Microscopy on the Basis of Engineered Dark States. Am. Chem. Soc. 2008, 130, 16840–16841, doi:10.1021/ja806590m.
- Itano, M.S.; Steinhauer, C.; Schmied, J.J.; Forthmann, C.; Liu, P.; Neumann, A.K.; Thompson, N.L.; Tinnefeld, P.; Jacobson, K. Super-Resolution Imaging of C-Type Lectin and Influenza Hemagglutinin Nanodomains on Plasma Membranes Using Blink Microscopy. J. 2012, 102, 1534–1542, doi:10.1016/j.bpj.2012.02.022.
- Chen, F.; Tillberg, P.W.; Boyden, E.S. Expansion microscopy. Science 2015, 347, 543–548, doi:10.1126/science.1260088.
- Chang, J.-B.; Chen, F.; Yoon, Y.-G.; Jung, E.E.; Babcock, H.; Kang, J.S.; Asano, S.; Suk, H.-J.; Pak, N.; Tillberg, P.W.; et al. Iterative expansion microscopy. Methods 2017, 14, 593–599, doi:10.1038/nmeth.4261.
- Gambarotto, D.; Zwettler, F.U.; Le Guennec, M.; Schmidt-Cernohorska, M.; Fortun, D.; Borgers, S.; Heine, J.; Schloetel, J.-G.; Reuss, M.; Unser, M.; et al. Imaging cellular ultrastructures using expansion microscopy (U-ExM). Methods 2018, 16, 71–74, doi:10.1038/s41592-018-0238-1.
- Mascheroni, L.; Scherer, K.M.; Manton, J.D.; Ward, E.; Dibben, O.; Kaminski, C.F. Combining sample expansion and light sheet microscopy for the volumetric imaging of virus-infected cells with optical super-resolution. bioRxiv 2020, doi:10.1101/2020.04.10.035378.
- Aho, V.; Mäntylä, E.; Ekman, A.; Hakanen, S.; Mattola, S.; Chen, J.-H.; Weinhardt, V.; Ruokolainen, V.; Sodeik, B.; Larabell, C.; et al. Quantitative Microscopy Reveals Stepwise Alteration of Chromatin Structure during Herpesvirus Infection. Viruses 2019, 11, 935, doi:10.3390/v11100935.
- Gao, R.; Yu, C.C. (Jay); Gao, L.; Piatkevich, K.D.; Neve, R.L.; Upadhyayula, S.; Boyden, E.S. A highly homogeneous expansion microscopy polymer composed of tetrahedron-like monomers. bioRxiv 2019, 1, 814111.
- Gambarotto, D.; Hamel, V.; Guichard, P. Ultrastructure expansion microscopy (U-ExM). In Methods in Cell Biology; Elsevier Inc: Amsterdam, Netherlands 2020; pp. 1–25.
- Power, R.M.; Huisken, J. A guide to light-sheet fluorescence microscopy for multiscale imaging. Methods 2017, 14, 360–373, doi:10.1038/nmeth.4224.
- Griffin, B.A. Specific Covalent Labeling of Recombinant Protein Molecules Inside Live Cells. 1998, 281, 269–272, doi:10.1126/science.281.5374.269.
- Yin, J.; Lin, A.J.; E Golan, D.; Walsh, C.T. Site-specific protein labeling by Sfp phosphopantetheinyl transferase. Protoc. 2006, 1, 280–285, doi:10.1038/nprot.2006.43.
- Lin, C.-W.; Ting, A.Y. Transglutaminase-Catalyzed Site-Specific Conjugation of Small-Molecule Probes to Proteins in Vitro and on the Surface of Living Cells. Am. Chem. Soc. 2006, 128, 4542–4543, doi:10.1021/ja0604111.
- Theile, C.S.; Witte, M.D.; Blom, A.E.M.; Kundrat, L.; Ploegh, H.L.; Guimaraes, C.P. Site-specific N-terminal labeling of proteins using sortase-mediated reactions. Protoc. 2013, 8, 1800–1807, doi:10.1038/nprot.2013.102.
- Lakadamyali, M.; Rust, M.J.; Babcock, H.P.; Zhuang, X. Visualizing infection of individual influenza viruses. Natl. Acad. Sci. USA 2003, 100, 9280–9285, doi:10.1073/pnas.0832269100.
- Brandenburg, B.; Zhuang, X. Virus trafficking—learning from single-virus tracking. Rev. Genet. 2007, 5, 197–208, doi:10.1038/nrmicro1615.
- Liu, S.-L.; Wang, Z.-G.; Xie, H.; Liu, A.-A.; Lamb, D.C.; Pang, D.-W. Single-Virus Tracking: From Imaging Methodologies to Virological Applications. Rev. 2020, 120, 1936–1979, doi:10.1021/acs.chemrev.9b00692.
- Liu, S.-L.; Zhang, Z.-L.; Tian, Z.-Q.; Zhao, H.-S.; Liu, H.; Sun, E.-Z.; Xiao, G.F.; Zhang, W.; Wang, H.-Z.; Pang, D.-W. Effectively and Efficiently Dissecting the Infection of Influenza Virus by Quantum-Dot-Based Single-Particle Tracking. ACS Nano 2011, 6, 141–150, doi:10.1021/nn2031353.
- Liu, S.-L.; Zhang, L.-J.; Wang, Z.-G.; Zhang, Z.-L.; Wu, Q.-M.; Sun, E.-Z.; Shi, Y.-B.; Pang, D.-W. Globally Visualizing the Microtubule-Dependent Transport Behaviors of Influenza Virus in Live Cells. Chem. 2014, 86, 3902–3908, doi:10.1021/ac500640u.
- Qin, C.; Li, W.; Li, Q.; Yin, W.; Zhang, X.; Zhang, Z.; Zhang, X.-E.; Zhang, M. Real-time dissection of dynamic uncoating of individual influenza viruses. Natl. Acad. Sci. USA 2019, 116, 2577–2582, doi:10.1073/pnas.1812632116.
- Weiss, S. Fluorescence Spectroscopy of Single Biomolecules. 1999, 283, 1676–1683, doi:10.1126/science.283.5408.1676.
- Das, D.K.; Govindan, R.; Nikić-Spiegel, I.; Krammer, F.; Lemke, E.A.; Munro, J.B. Direct Visualization of the Conformational Dynamics of Single Influenza Hemagglutinin Trimers. Cell 2018, 174, 926–937.e12, doi:10.1016/j.cell.2018.05.050.
- Femino, A.M. Visualization of Single RNA Transcripts in Situ. Science 1998, 280, 585–590, doi:10.1126/science.280.5363.585.
- Chou, Y.-Y.; Vafabakhsh, R.; Doğanay, S.; Gao, Q.; Ha, T.; Palese, P. One influenza virus particle packages eight unique viral RNAs as shown by FISH analysis. Natl. Acad. Sci. USA 2012, 109, 9101–9106, doi:10.1073/pnas.1206069109.
- Chou, Y.-Y.; Heaton, N.S.; Gao, Q.; Palese, P.; Singer, R.H.; Lionnet, T. Colocalization of Different Influenza Viral RNA Segments in the Cytoplasm before Viral Budding as Shown by Single-molecule Sensitivity FISH Analysis. PLoS Pathog. 2013, 9, e1003358, doi:10.1371/journal.ppat.1003358.
- Von Chamier, L.; Laine, R.F.; Henriques, R. Artificial intelligence for microscopy: What you should know. Soc. Trans. 2019, 47, 1029–1040, doi:10.1042/bst20180391.
- Belthangady, C.; Royer, L.A. Applications, promises, and pitfalls of deep learning for fluorescence image reconstruction. Methods 2019, 16, 1215–1225, doi:10.1038/s41592-019-0458-z.
- Schelker, M.; Mair, C.M.; Jolmes, F.; Welke, R.-W.; Klipp, E.; Herrmann, A.; Flöttmann, M.; Sieben, C. Viral RNA Degradation and Diffusion Act as a Bottleneck for the Influenza A Virus Infection Efficiency. PLoS Comput. Biol. 2016, 12, e1005075, doi:10.1371/journal.pcbi.1005075.
This entry is adapted from the peer-reviewed paper 10.3390/v13020233