The green development of electric power is a key measure to alleviate the shortage of energy supply, adjust the energy structure, reduce environmental pollution and improve energy efficiency.
- power industry
- green development
1. Introduction
Energy is an essential material foundation for the human to achieve economic development and improve living standards [1][2], which is particularly important for modern economy [3]. In the face of growing energy shortages and environmental problems, the main strategies of most countries in the world are to develop and utilize renewable energy, promote the construction of a clean, low-carbon, safe, and efficient energy system dominated by renewable energy [4], adopt energy-saving and emission reduction strategies [5], and develop renewable energy technologies [6]. The existing energy system in China has provided the inexhaustible impetus for its economic rise [7]. According to OECD (Organization for economic cooperation and development) statistics; China has become the largest primary energy consumer and greenhouse gas emitter in the world. With the ever-increasing constraints on energy resources, the contradiction between extensive use of energy and ecological civilization’s construction has become increasingly irrational [8]. Resource and environmental problems have become the key to restrict China’s social development, so it is urgent to control greenhouse gas emissions [9]. Green and low-carbon development has become a significant strategy for China’s economic and social development and a critical approach to ecological civilization construction [10]. The power industry is at the core position in the modern energy system. As a significant industry of energy consumption and pollutant emissions, it needs transformation and upgrading and plays a vital role in reducing greenhouse gas emissions [11]. Efforts should be made to develop green power [8] (refers to renewable energy power supply, which is easier to obtain than traditional power [12], with wind power, solar energy, and biomass energy as the core). However, due to the randomness, volatility, intermittency, and uncertainty of renewable energy power generation, large-scale access brings severe challenges to the stable and safe operation of the power system [13][14], which restricts the green development of China’s power industry. Therefore, it is urgent to study the weak links in the green development path of China’s electric power, promote the transformation and upgrading of China’s power green, and make remarkable contributions to building a beautiful China and promoting the construction of a community of shared future for humanity.
2. Green Development Status of Electric Power in China
2.1. Brief Description of China’s Electric Power
2.1.1. The Proportion of Clean Energy Consumption Is Increasing
During the “13th Five-Year Plan” period, China’s energy consumption growth has gradually slowed down, and the overall consumption structure has been optimized. China is on the road to “building a clean, low-carbon, safe, and efficient energy system” and gradually promotes a clean and low-carbon consumption model.
2.1.2. The Green Transformation of the Power Supply Structure Continued
To prevent and resolve the risk of coal-fired power overcapacity and accelerate the green development of electric power, the growth rate of the new installed capacity of China has gradually slowed down, and the power structure has been continuously optimized. Wind power and photovoltaic power generation (PV) have gradually become an important part of renewable energy [15][16][17]. Since 2010, the ratio of installed thermal power in China has been gradually decreasing and the proportion of installed non-fossil energy has been increasing gradually. Installed wind power, photovoltaic, and other new energy power generation have been multiplying, becoming the new main force of power supply, and the installed structure of power supply has been constantly optimized. The form of China’s installed generating capacity from 2010 to 2018 is shown in Figure 1 [18].
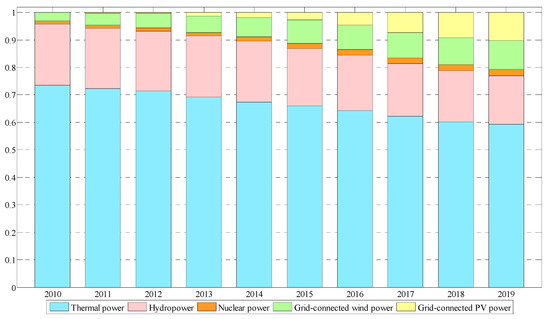
Figure 1. The installed power-generating capacity structure 2010–2019 in China.
2.1.3. The Electricity Consumption Structure Presents a Clean and Low-Carbon Trend
As a clean and efficient final energy, electric energy will play an essential role in China’s future energy structure. The proportion of electricity in the final energy consumption is a vital indicator to measure a country’s final energy consumption structure and degree of electrification. Increasing the proportion of electric energy in final energy consumption is a vital measure to optimize China’s energy consumption structure. In 2019, the electricity consumption of the whole society in China was 7225.5 billion kWh. In terms of industry types, the primary industry’s electricity consumption is 78 billion kWh, and the electricity consumption of the secondary sector is 4936.2 billion kWh. The electricity consumption of the tertiary industry and residents’ daily life is an essential driving force for the continuous and rapid growth of the whole society’s electricity consumption, which will still maintain double-digit growth in 2019. According to the trend of China’s energy policy, it is the primary trend of future energy development to improve the level of final energy electrification. Electric energy substitution measures can be implemented to replace coal and oil with electricity to increase the proportion of electricity in final energy consumption.
2.1.4. Power Consumption and Environmental Indicators Are Gradually Optimized
The power industry actively responds to climate change and adopts various effective measures to reduce energy consumption and line loss rate [19]. In 2018, the national average standard coal consumption of thermal power plants of 6000 kilowatts and above was 307.6 g/kWh, and the coal consumption of coal-fired power generation units remained advanced in the world; the plant power consumption rate is 4.70% (including hydropower 0.26% and thermal power 5.81%); the national line loss rate is 6.21%; the hydro consumption per unit power generation of thermal power plants in China is 1.23 kg/kWh; the comprehensive utilization rate of fly ash and desulfurization gypsum is 71% and 74% respectively, and the total utilization capacity continues to increase. The emission of pollutants was further reduced. The emissions of soot, sulfur dioxide, and nitrogen oxides in China were about 210,000 tons, 990,000 tons, and 960,000 tons respectively, which were 19.2%, 17.5%, and 15.8% lower than that of the previous year; the emissions of soot, sulfur dioxide, and nitrogen oxides per kilowatt-hour of thermal power generation are about 0.04 g, 0.20 g, and 0.19 g; the waste water discharge per unit of thermal power generation is 0.06 kg/kWh. The carbon dioxide emission per unit of thermal power generation is about 841 g/kWh, a decrease of 19.4% compared to 2005, which has contributed to China’s early realization of its carbon emission commitments.
2.2. Necessity of Green Power Development
2.2.1. The Embodiment of Active International Responsibility
As the largest developing country globally, China has pledged to reduce its carbon emission intensity by 40–45% by 2020 compared with 2005, and by 2030 it will reduce its carbon intensity by 60–65% compared with 2005. To realize its carbon emission commitment, China has made great efforts to develop an economic model with efficient use of resources and environment friendly as the core and the principle of “3R” (reduce, reuse, resources), actively promote energy substitution and optimize energy consumption structure to improve the increasingly severe environmental problems [20]; meanwhile, China will improve the policies of energy policy including energy tax policy, energy investment policy, industrial policy and energy consumption policy, and propose quota, and emission trading plan. In December 2017, taking the power generation industry as a breakthrough point, the national carbon emission trading system was officially launched by the national development and Reform Commission. Other high energy consuming and high emission industries were gradually having to expand the market coverage [21]. This system is expected to include more than 3 billion tons of carbon emissions, surpassing the EU carbon emissions trading system, and becoming the world’s largest carbon market [22]. Whether China can achieve the goal of carbon emission intensity by 2030 has been highly concerned. Relevant scholars make reasonable predictions based on China’s national conditions, and the prediction of carbon emission intensity target is relatively ideal [23][24][25]. However, to achieve the goal of carbon emission intensity smoothly, China still needs to play the role of government supervision and policy guidance [26].
2.2.2. A Vital Measure to Achieve National Macro-Strategic Goals
The energy white paper published in 2007, “China’s Energy Situation and Policy” started China’s energy change [27]. At present, China’s energy strategy is to promote the transformation of the energy development mode. By 2020, a “safe, green, and efficient” energy system should be initially constructed and formed by 2030. There are many macro development strategic plans in China have put forward explicit constraints on energy structure and consumption, as shown in Table 1. The implementation of the first energy law is accelerating, and renewable energy is about to become a priority area for energy development.
Table 1. National macroscopic strategy planning.
| China’s Economy Has Entered a Period of New Normal | The Growth Rate of Primary Energy Demand Remains at a Single-Digit Percentage Level. |
|---|---|
| The 13th Five-Year Plan for Energy Development, Strategic Action Plan for Energy Development (2014–2020) | During the 13th Five-Year Plan period, the proportion of non-fossil energy power generation will reach 31%; during the 13th five-year plan and the medium and long term, the growth rate of China’s energy consumption will further slowdown, and it will get the peak of energy consumption in 2040. |
| Energy Production and Consumption Revolution Strategy (2016–2030) | In 2020, the balance of non-fossil energy will reach 15%; from 2021 to 2030, the proportion of non-fossil energy consumption will reach20%; in 2050, the ratio of non-fossil energy will exceed 50% |
| Medium and Long Term Development Plan of Renewable Energy (2007–2020) | By 2020, the proportion of non-fossil energy in primary energy consumption will reach 15%. |
| 13th Five Year Plan for Renewable Energy Development | By 2020 and 2030, the proportion of non-fossil energy in primary energy consumption will reach 15% and 20%. |
3. Challenges of Green Development of Electric Power in China
3.1. Resource Endowment Restricts the Space for Carbon Emission Reduction
Under the influence of the resource endowment characteristics of “rich coal, lack of oil, and less gas” in China, thermal power will still be a primary supporting power source for a long period and the rapid development of wind power and solar energy will not be enough to change this power generation pattern. After 2020, China’s renewable energy will have market competitiveness [28][29], and after 2030, China’s thermal power industry will gradually enter into a recession [30]. At present, China’s power supply structure is dominated by thermal power generation. Coal accounts for a relatively large proportion of energy consumption [31], accounting for 57.7% [32]. The study confirms that increased energy consumption is the main cause of increased carbon emissions [33][34][35]. To realize the promise of carbon emission reduction in 2030, it is urgent to change the current coal-based energy consumption structure through the green transformation of electricity.
3.2. Energy Efficiency Still Needs to Be Improved
During the “13th five-year plan” period, China implemented the “double control” action of total energy consumption and intensity, requiring that the energy consumption per unit GDP by 2020 be reduced by 15% compared with that in 2015, and the total energy consumption should be controlled within 5 billion tons of standard coal. In 2018, China’s energy consumption per unit GDP was 2.41 tons of oil equivalent/10,000 US dollars [31]. Compared with the average world and developed countries, China’s energy consumption intensity is still on the high side, as shown in Figure 2. Moreover, the primary energy consumption is highly dependent on coal, and there is much room for improvement. Energy efficiency has become a significant challenge for the green transformation of electric power.
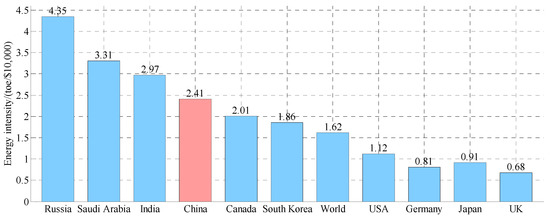
Figure 2. Energy consumption per unit GDP of major countries in the world in 2018.
3.3. The Contradiction between the Development and Utilization of New Energy
In 2019, the national average abandonment rate of wind and solar was 4% and 2%, respectively, and the phenomenon of abandoning wind and solar still exists. By 2020, China aims to install 350 million kilowatt-hours of hydropower, 200 million kilowatt-hours of wind power, and 110 million kilowatt-hours of solar power, respectively. It is urgent to solve the contradiction between the development and consumption of new energy. Otherwise, the phenomenon of energy abandonment will be further aggravated. For many years, to promote the development of the renewable energy industry, China has been adopting the mode of “benchmarking electricity price + government financial subsidy.” The subsidy fund comes from the renewable energy price surcharge, which is charged with the electricity fee. With the rapid growth of wind power and photovoltaic installed capacity, the subsidy gap continues to expand. The existing pricing mechanism of new energy products has defects and the evaluation mechanism is not perfect, which is not conducive to the balanced development of the new energy industry [36]. The “Notice on Matters Related to Photovoltaic Power Generation in 2018” (Fagai Energy [2018] No. 823) stated that the principle of “reduction of both ordinary photovoltaic and distributed photovoltaic” was determined in the electricity price, and the scale of photovoltaic construction was reduced. The decline of new energy subsidies has brought great difficulties and uncertainties to the development of wind power and photovoltaic industries. The reduction of new energy subsidies has brought more significant problems and tension to the development of wind power and photovoltaic industries.
The distribution of renewable energy such as hydro energy, wind energy, and solar energy is highly concentrated in China and the resource-rich areas are in reverse distribution with the load centers; 60% of China’s hydro energy resources are concentrated in the southwest, and the areas with better development conditions such as wind power and photovoltaic power are concentrated in the West and North. However, the eastern coastal areas, where the power load accounts for more than 2/3 of the total load in China, are economically developed, but energy resources are relatively scarce. It is difficult to flexibly dispatch thermal power generation [37]. There is a lack of gas turbine power station with fast-tracking load adjustment and pumped storage power station (PSPS) with flexible peak regulation and frequency modulation in resource-rich areas. The overall accommodation conditions are insufficient, which restricts the utilization of renewable energy.
This entry is adapted from the peer-reviewed paper 10.3390/su13020708
References
- Qu, H.; Huang, X.; Xu, T.; Guo, P.; Zhang, M.; Yang, X. The Analysis of Current Implementation Mechanism of Green Power. Adv. Mater. Res. 2013, 860–863, 784–790.
- Wang, T.; Gong, Y.; Jiang, C. A review on promoting share of renewable energy by green-trading mechanisms in power system. Renew. Sustain. Energy Rev. 2014, 40, 923–929.
- Sun, W.; Ye, Y.; Zhang, C.; Baleentis, T.; Treimikien, D. Sustainable energy development in the major power-generating countries of the European Union: The Pinch Analysis. J. Clean. Prod. 2020, 256, 120696.
- Zhang, J.; Zheng, Y. The flexibility pathways for integrating renewable energy into China's coal dominated power system: The case of Beijing-Tianjin-Hebei Region, J. Clean. Prod. 2020, 245, 118925.
- Ren, Y.; Suganthan, P.N.; Srikanth, N. A novel empirical mode decomposition with support vector regression for wind speed forecasting. IEEE Trans. Neur. Net. Lear. Syst. 2016, 27, 1793–1798.
- Kumar, N.; Pal, N. The existence of barriers and proposed recommendations for the development of renewable energy in Indian perspective. Environ. Dev. Sustain. 2018, 22, 2187–2205.
- Wang, W.; Chen, Z. The phasic features and development strategies of China's energy industry over 40 years of reform and opening-up. Reform 2018, 9, 55–65.
- Demirbas, A. Electrical power production facilities from green energy sources. Energy Sources Part B 2006, 1, 291–301.
- Chen, J.; Yuan, H.; Tian, X.; Zhang, Y.; Shi, F. What determines the diversity of CO2 emission patterns in the Bei-jing-Tianjin-Hebei region of China? An analysis focusing on industrial structure change. J. Clean. Prod. 2019, 228, 1088–1098.
- The State Council of the People’s Republic of China. Notice on Issuing the Work Plan for Controlling Greenhouse Gas Emissions during the 13th Five-Year Plan; The State Council of the People’s Republic of China: Beijing, China, 2016. Available online: http://www.gov.cn/zhengce/content/2016-11/04/content_ 5128619.htm (accessed on 23 May 2020).
- Mewton, R.T.; Cacho, O.J. Green power voluntary purchases: Price elasticity and policy analysis. Energy Policy 2011, 39, 377–385.
- Balat, H. Contribution of green energy sources to electrical power production of Turkey: A review. Renew. Sustain. Energy Rev. 2008, 12, 1652–1666.
- Zhang, C.; Zhou, J.; Li, C.; Fu, W.; Peng, T. A compound structure of ELM based on feature selection and parameter optimi-zation using hybrid backtracking search algorithm for wind speed forecasting. Energy Convers. Manag. 2017, 143, 360–376.
- Tasnim, S.; Rahman, A.; Oo, A.M.T.; Haque, M. E. Wind power prediction in new stations based on knowledge of existing Stations: A cluster based multi-source domain adaptation approach. Knowl. Based Syst. 2018, 145, 15–24.
- Mathiesen, B.V.; Lund, H.; Hansen, K.; Ridjan, I.; Djørup, S. R.; Nielsen, S.; Sorknæs, P.; Thellufsen, J. Z.; Grundahl, L.; Lund, R. S. et al. IDA’s Energy Vision 2050; Aalborg University: Copenhagen, Denmark, 2015.
- European Commission. In-Depth Analysis in Support of the Commission Communication COM 773 A Clean Planet for All; European Commission: Brussels, Belgium, 2018.
- Sorkæs, P.; Lund, H.; Skov, I.R.; Djorup, S.; Skytte, K.; Morthorst, P. E.; Fausto, F. Smart energy markets—Future electricity, gas and heating markets. Renew. Sustain. Energy Rev. 2020, 119, 109655.
- National Energy Administration. National Electric Power Industry Statistics in 2019. Available online: http://www.nea.gov.cn/2020-01/20/c_138720881.html (accessed on 23 May 2020).
- China Electricity Council. Annual Development Report of China’s Electricity Industry; China Electricity Council: Beijing, China, 2019.
- Order of the President of the People’s Republic of China. Law of the People’s Republic of China on the Promotion of Circu-lar Economy. Available online: http://www.gov.cn/flfg/2008-08/29/content_1084355.htm (accessed on 30 May 2020).
- Zhang, Y.; Zhang, J. Estimating the impacts of emissions trading scheme on low-carbon development. J. Clean. Prod. 2019, 238, 117913.
- Yu, X.; Wu, Z.; Wang, Q.; Sang, X.; Zhou, D. Exploring the investment strategy of power enterprises under the nationwide carbon emissions trading mechanism: A scenario-based system dynamics approach. Energy Policy 2020, 140, 111409.
- Xiao, B.; Niu, D.; Guo, X. Can China achieve its 2020 carbon intensity target? A scenario analysis based on system dynamics approach. Ecol. Indic. 2016, 71, 99–112.
- Xu, L.; Chen, N.; Chen, Z. Will China make a difference in its carbon intensity reduction targets by 2020 and 2030? Appl. Energy 2018, 203, 874–882.
- Zhu, B.; Ye, S.; Jiang, M.; Wang, P.; Wu, Z.; Xie, R., Achieving the carbon intensity target of China: A least squares support vector machine with mixture kernel function approach. Appl. Energy 2019, 2331, 196–207.
- Niu, D.; Wang, K.; Wu, J.; Sun, L.; Liang, Y.; Xu, X.; Yang, X. Can China achieve its 2030 carbon emissions commitment? Scenario analysis based on an improved general regression neural network. J. Clean Prod. 2019, 243, 118558.
- Xu, S. The paradox of the energy revolution in China: A socio-technical transition perspective. Renew. Sustain. Energy Rev. 2020, 137, 110469, doi:10.1016/j.rser.2020.110469.
- International Energy Agency. Renewables 2018: Analysis and Forecasts to 2023; IEA: Paris, France, 2018.
- International Renewable Energy Agency. People, Planet and Prosperity; IRENA: Abu Dhabi, UAE, 2019.
- Liu, H.; Yan, S.; Zhang, P.; Zeng, M. Overall review of the overcapacity situation of China’s thermal power industry: Status quo, policy analysis and suggestions. Renew. Sustain. Energy Rev. 2017, 37, 136–145.
- BP. BP Statistical Review of World Energy 2020; BP: London, UK, 2020.
- National Bureau of Statistics. The People’s Republic of China 2019 National Economic and Social Development Statistical Bulletin. Available online: http://www.stats.gov.cn/tjsj/zxfb/202002/t20200228_ 1728913.html (accessed on 23 May 2020).
- Lv, Z.; Xu, T. Trade openness, urbanization and CO2 emissions: Dynamic panel data analysis of middle-income countries. J. Int. Trade Econ. Dev. 2019, 28, 1–14.
- Acheampong, A.O. Economic growth, CO2 emissions and energy consumption: What causes what and where? Energy Econ. 2018, 74, 677–692.
- Nathaniel, S.P.; Iheonu, C.O. Carbon dioxide abatement in Africa: The role of renewable and non-renewable energy con-sumption. Sci. Total Environ. 2019, 679, 337–345.
- Dong, C.; Zhou, R.; Li, J. Rushing for subsidies: The impact of feed-in tariffs on solar photovoltaic capacity development in China. Appl. Energy. 2018, 281, 116007.
- Liu, Z. Ultra-High Voltage AC/DC Grids; Academic Press: Cambridge, MA, USA, 2015; pp. 533–585.