Your browser does not fully support modern features. Please upgrade for a smoother experience.
Please note this is an old version of this entry, which may differ significantly from the current revision.
Subjects:
Others
Carbon formation on steel has recently become an active research area with several important applications, using either carbon nanotubes (CNTs) or graphene structures. The production of vertically aligned CNT (VACNT) forests with combined metals has been explored with important results. Detailed kinetics is the best approach to understand a mechanism. The growth behavior seems complex but can be simplified through the knowledge of the three more common alternative reaction mechanisms/routes.
- CNTs growth
- Fe-steel catalysis
- Carbon nanotubes
1. Introduction
Epitaxial growth on solid surfaces has been studied in some detail. Three growth modes are known: Island, layer-plus-island, and layer-by-layer [46]. However, nucleation of graphene on Ni, Fe, and Cu at low temperatures (300–550 °C) occurs through C atoms bulk diffusion supplied by gas decomposition (Mechanism/Route I) or carbon black C atoms (Mechanism/Route II), that dissolve and keep their individuality, moving interstitially in the metal catalyst. Layer-by-layer growth occurs only in the pyrolytic route (Figure 3). The Tammann temperature of Cu (406 °C) is much lower than Ni, Co, and Fe [47]. Route I operates with Fe, Co, Ni, and Cu only, using C2H2 or low olefins [5].
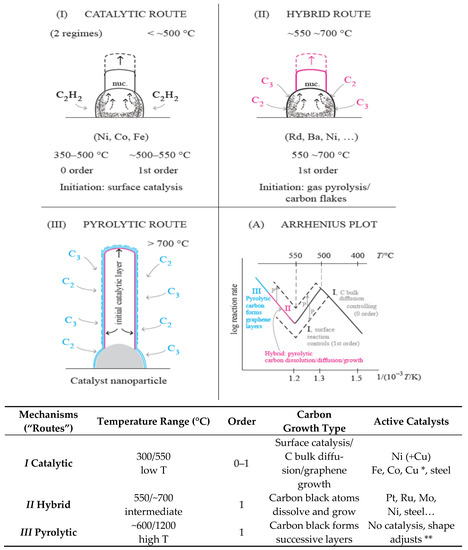
Figure 3. Explanation of the three alternative catalytic mechanisms/routes of carbon formation from hydrocarbons over different temperature/pressure ranges. When more than one mechanism may operate, the faster one prevails (adapted from [51] with permission from MDPI). * With Cu: at 250 °C. ** Graphene functionalization properties are extensively studied today.
As mentioned above, detailed kinetics is the best approach to prove which mechanism is operating. The detailed research work on diffusion of atoms in and through solids published from 1920 to 1960 should be used, particularly to get data on H, C, N, and O bulk diffusion in transition and noble metals [48,49]. Diffusion in solids is a complex process, but diffusion of C, N, and O in transition metals is interstitial: The atomic radius of solute C and solvent (transition metal) is below 0.59, the usual condition for that type of diffusion to occur [48,49].
It is essential to perform the experimental work under steady-state deposition rates (initial solid-state adjustments have finished). When the flux is constant, the first Fick’s law applies:
where J is the flux and dC/dx is the concentration gradient. Two different phases may operate in the catalyst nanoparticle (gas side vs. CNT growth side), adjusting the solid-state geometry to a C flux steady-state operating regime [50].
J = −D dC/dx
The Arrhenius plots shown in Figure 1 evidence the change of rate determining step at about 700 °C. Explanation of that change has been recently reminded [51]. Every point in the Arrhenius plot is a register of a steady-state deposition rate experiment (kinetic linearity observed) [5], that is, a full steady state C formation experiment, lasting 2 or 3 h. The volcano shape maximum with Fe and steel occurs at higher temperatures than with Ni and Co. This is due to the lower rate of the 1st reaction step (catalytic surface reaction), so that the prevalence of a lower 2nd step (C bulk diffusion through the solid catalyst) only occurs at higher temperatures. The dependence of temperature of the reaction rate observed in the lower temperature side of the volcano plot with Ni was ~33 kcal/mole. This is the activation energy of C atoms bulk diffusion in Ni. That value and zero order gas pressure dependence of the C formation reaction rate were regarded as proof of the mechanism operating, as reported in 1971 [7,8,45]. Baker et al. described in detail the TEM in-situ growth geometry of CNTs (no kinetic experiments) [52] and followed the mechanism proposed by Lobo and Trimm based in 160 kinetic experiments, using a CI Electronics microbalance adapted to automatically change ranges in long experiments, if required [7,8]. In 2011, Lobo, Figueiredo, and Bernardo summarized their approach to the mechanism in the early 1970s [53].
A successful kinetic study requires an initial transition: The change of weight is fast in the first few minutes and then decreases to a sustained rate (kinetic linearity, as mentioned above). Our experiments with iron and steel were initiated at a lower temperature (ex. 500 °C) for 2 h. After that the temperature was increased by stages (ex. 15 °C) allowing enough time at each stage to confirm a steady state operating (straight line in the weight register). The initial transition may include phase changes of the nanoparticle catalyst bulk [50]. At lower temperatures, the prevailing bulk phase with Ni is the metal itself, but with iron it is Fe3C. Latorre et al. proposed a phenomenological kinetic model and discussed the nucleation and growth of CNTs in some detail [54].
Ermakova et al. [55] studied carbon formation from CH4/H2 using Fe on various supports: SiO2, Al2O3, and ZrO2 in the range 650–800 °C. The maximal carbon yield was obtained with SiO2. Metal filled carbon tubes were frequently filled with Fe particles and commented: “That can be hardly explained unless the quasi-liquid state of the metal is assumed”, and concluded that a high fluidity of iron-carbon particles was observed above 640 °C. However, the explanation is the sintering-like behavior of the nanoparticles due to contact interaction [56]. The sintering temperature of Fe is 632 °C.
Puretzky et al. [14,57] studied the kinetic CNTs’ growth using acetylene/Ar/H2/in the range 550–900 °C. These authors used multilayer metal films of 10nm Al and Fe or Mo as catalysts and a flow of C2H2 (6 sccm) diluted in Ar (ex: 2000 sccm) and H2 (ex: 400 sccm) [14]. The reason for this gas dilution can be understood by our recent analysis of high temperature carbon formation kinetics [58]. Low hydrocarbon partial pressure is the key to keep Route II operating at higher temperatures with a faster rate and avoiding pyrolytic graphene layers deposition (Route III, pyrolytic). In that study, a volcano shape of the Arrhenius plots of the rates vs. temperature (check ref. [14], Figures 13, 21, and 22), but the orders of reaction were not evaluated. In our studies, the orders of reaction were always evaluated experimentally. With that information, the alternative mechanisms operating were more easily distinguished. The two sides of the volcano correspond to the same mechanism (Route I, Catalytic), but with a change of the rate-determining step from C bulk diffusion to surface reaction decomposition of the gas reactant (C2H2 and low olefins, only). The other C formation gases only operate at higher temperatures by impingement of pyrolytic formed carbon (C2,C3…), C atoms entering the bulk of the catalyst and growing catalytically on the other side of the nano-particle [51]. In the studies of Puretzky et al., the reason a volcano shape was observed in the plot of the variation of the growth rates as a function of temperature was attributed to acetylene flow rates [57]. This is not correct. They did not measure reaction orders (alternative gas pressure steady-state experiments). The reaction order changes from zero (temperatures below the volcano maximum) to one (at temperatures above the maximum) [7,8]. This is the reason for the volcano shape observed.
The activity of Cu has been studied in detail by Shaikjee et al. using C2H2 at 195 °C and 250 °C [59]. The Tammann temperature of Cu is 405 °C. The absence of data on CNTs formation using Cu via Route II may be related to the stability of the nanoparticles shape.
Overall knowledge of the CNTs and graphene alternative growth mechanisms [5,8,58] is important to optimize rate, structure, and desired properties. Route I operates with acetylene and C2 to C4 olefins and CO. At higher temperatures, CNTs can be formed by route II only.
Studies on C formation on Ni, Co, and Fe in the 70′s were mainly performed to minimize the problems in the steam-reforming industry. Ni-Cu catalysts were used to reduce the problem, but still the need to stop the production from time to time due to catalyst deactivation by carbon formation was costly. CNTs were observed to grow easily from transition metals [7,35], but their properties were not known at the time. Carneiro, Baker, and co-authors studied CNTs’ growth on Fe-Ni and Fe-Cu from CO/H2 at ~700 °C [13,25]. They studied the structure of the CNTs formed. No kinetic studies were reported. An update of the observed kinetics of CNTs growth was published by Lobo [5].
The wider use of CNTs for many purposes and industrial production started after the work of Iijima in 1991 [60]. Single layer CNTs were produced in 1993 by Iijima [61] and Bethune [62].
Roumeli recently published a study of vertically aligned CNT forests grown on stainless steel surfaces, including adhesion tests between the tubes and the steel substrate to test their adhesion performance using 4 types of steels [42].
Concerning graphene, the deposition of layers at high temperatures is a transition from the CNTs growth by the hybrid route to the pyrolytic route, but the deposition rate observed follows the same Arrhenius plot line [58]: Almost a paradox (check Figure 3, (A)). This must be understood—it is a change of mechanism with a continuous line in the Arrhenius plot: At lower temperatures, C2/C3 rate of deposition controls the rate; at higher temperatures, C2/C3 rate of deposition dominates and covers the catalyst surface with graphene layers–pyrolytic route.
Koyama and Katsuki et al. produced carbon fibers via pyrolysis of benzene and naphthalene at temperatures above 1000 °C in 1972 [63,64]. Tibbetts reported the production of carbon fibers by pyrolysis of CH4 in stainless steel tubes in the range 950–1075 °C [65]. Figueiredo and co-workers studied carbon formation from CH4 using Fe-Ni, Fe-Co, and Ni-Co in the range of temperatures 650–950 °C [66] and using Fe-Mo, in the range of temperatures 500–800 °C [67]. The carbon formation reaction using methane does not operate by the catalytic route. Only via gas pyrolysis and the hybrid route the formation of CNTs is possible. High temperatures are required.
2. CNT Forests Growth Optimization vs. Kinetics and Mechanisms
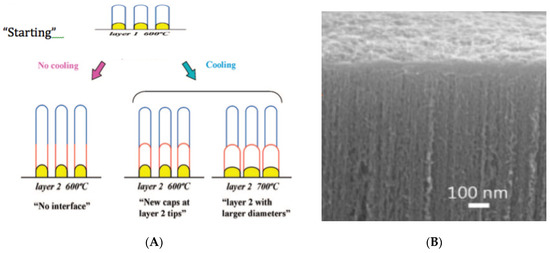
Yamazaki et al. [84], Iwasaki et al. [18], and Robertson et al. [26,72,73,74,75] studied the growth of vertically aligned CNTs in detail (check Figure 5A,B). In this case, an extra kinetic step is present: Diffusion of the reactant gas through the thin space between the CNTs. Could that step be rate-limiting when the CNTs are very long? CNT forests are sometimes grown from CH4. However, in this case, mechanism I (catalytic) is not operative. Mechanism II, operating at higher temperatures, is required (check Figure 3 and Table 2). Forests of CNTs (check Figure 5B) became recently the object of growth optimization to increase production and reduce costs. Lee et al. [85], Bedewy et al. [86], Park et al. [87], Meshot et al. [88] and Yang et al. [30,75] analyzed the CNT’s forest growth, recently.
Underlayer vs. nanoparticle size, spacing, and stability during reaction have been studied by several authors [78,79,80]. Delzeit et al. studied Fe on a thick Ir underlayer, trying also Mo added to Fe. They used CO as a reacting gas and had to use 900 °C as reaction temperature [78]. In fact, mechanism I is not active with CO, and only mechanism II operates. With Fe, that temperature is required. Burt et al. used Fe on Al2O3 grains on Si and SiO2 substrates, but used ethanol as a reacting gas [79]. So only reaction Route II is operative. The reaction was performed at 800 °C with 4% H2. Low pressures are more effective to reach higher rates when route/mechanism II is operating. This seems a paradox, but has been explained in detail, recently [58].
A good explanation for the growth of the size of the Fe nanoparticles (“larger diameter”), causing enlargement of the CNTs diameter, shown in Figure 5A at 700 °C, is sintering-like behavior of solid-solid contacts above the Tammann temperature of Fe (632 °C), as remarked above (point 5). The rates of CNTs growth from particles with different diameter d are proportional to 1/d2. The diffusion distances are proportional to 1/d, and the growth perimeter is also proportional to 1/d.
This proportionality helps us to understand that in a sample with various nanoparticle sizes, and so with different growth rates, the kinetic model applies: The effect of changing pressure and/or temperature applies overall in the system. The detailed study of Nessim et al. in 2008 tuning vertically aligned CNTs (VACNTs) diameter growth on Fe can be better understood considering that they operated at 770 °C, well above the TTa of Fe [89].
Baker proposed that C bulk diffusion through Ni particles is due to a temperature gradient [52,90]. We consider this to not be correct [5]. The fact that the growth rate on Ni below 550 °C is not due to a temperature gradient can also be avoided, knowing that the rates are exactly the same with C2, C3, and C4 olefins, and C formation from C4H4 is endothermic [5]. However, the main error is the assumption that heat, being a consequence of the reaction (exothermic), may be its cause. This infringes on the causality principle. Baker’s proposal was sustained for 20 years [90]. C bulk diffusion is due to a dissolved C concentration gradient between the two operating sides of the catalyst [7,8].
3. CNTs Application Areas
Thin graphene films can be formed following route/mechanism III (pyrolysis) but operating at the “border” of the required temperature and pressure conditions (slow deposition rates). Good graphene thin films have been formed by Sarno et al. [91], Romero et al. [34], and more recently by Um et al. [92]. Additionally, a book by Venables on “Introduction to surface and thin film processes” is available [46].
CNTs are an important basis nowadays for applications in many areas. Harris summarized those uses, covering electronic, mechanical, optical, thermal, chemical, and biology areas [3].
The studies by Treacy et al. in 1996 on the changes of mechanical properties showed that CNTs might be useful in strong, lightweight composite materials [93]. Exceptionally high young modulus were observed for individual CNTs. The very high number of citations reveals the importance of this finding. Gao et al. and Adhikary et al. recently revised the mechanical properties and microstructure of cement-based materials searching for the best structure of the CNTs to its reinforcement [82,94]. A book by Guceri and Gogotsi from an ASI NATO meeting on nanofibrous materials is available [95].
The electrical conductivity of the CNTs is important for several uses. The studies by Ebbesen et al. published in 1996 on individual electronically properties of CNTs have stimulated that study and optimization for particular applications [96]. Abrupt jumps in conductivity were observed as temperature varied. The number of citations of these articles evidences the growing use of CNTs in electronics. Increase of electrical conductivity of Fe CNT sheets. Enhancement of electrical conductivity adding Cu to Fe has been recently reported by Earp et al. [97].
CNTs have recently being tested with success in drug delivery, particularly in cancer treatment, and may progressively replace the current treatments of surgery, radiation therapy, and chemotherapy.
This entry is adapted from the peer-reviewed paper 10.3390/nano11010143
This entry is offline, you can click here to edit this entry!