The visual appearance of oil spills at sea is often used as an indicator of spilled oil properties, state and slick thickness. These appearances and the oil properties that are associated with them are reviewed in this entry. The appearance of oil spills is an estimator of thickness of thin oil slicks, thinner than a rainbow sheen (<3 µm). Rainbow sheens have a strong physical explanation. Thicker oil slicks (e.g., >3 µm) are not correlated with a given oil appearance. At one time, the appearance of surface discharges from ships was thought to be correlated with discharge rate and vessel speed; however, this approach is now known to be incorrect. Oil on the sea can sometimes form water-in-oil emulsions, dependent on the properties of the oil, and these are often reddish in color. These can be detected visually, providing useful information on the state of the oil. Oil-in-water emulsions can be seen as a coffee-colored cloud below the water surface. Other information gleaned from the oil appearance includes coverage and distribution on the surface.
- oil spill appearance
- oil color
- oil slick thickness
- Bonn code
- ASTM code
1. Introduction
When an oil spill occurs, there is a need for extensive information including the location of the oil, its distribution, its trajectory and its thickness [1][2][3]. Thickness is of particular interest because many countermeasures are dependent on oil being a minimum thickness in order to be effective. This is true for in-situ burning and chemical oil spill dispersion, and, to a certain degree, for oil removal by skimmers.
Observations in the visible spectrum, be they by human eyesight or through the use of cameras or spectrometers, have been used over the past decades to gain information about spilled oil [1][3]. The suggested uses of such observations have been used to estimate the state of the oil, the position and distribution, its condition and thickness. The primary tool for visual observation of oil is to use its color or appearance. Most crude and fuel oils are black; however, when very thin (<3 µm), oil has other appearances based on its interaction with light. These light interactions can change the color or appearance of the oil. Efforts have been made to correlate these colors and appearance with the thickness of oil. This correlation of color and thickness will be reviewed in detail below. Further, it is noted that there are variances to the appearance of oil caused by factors such as viewing angle, wind effects, solar illumination and water conditions.
Other uses of visual observations are suggested. These include observation of the formation of water-in-oil emulsions [4], indication of oil-in-water emulsions [5], measurement of subsea discharge rates [2] and the simple measurement of the oil geometry on the sea [6]. These observation uses will be reviewed in this paper.
In the past, visual observations were standardized in various codes to provide users with a standard way of interpreting appearances of oil on the sea [1]. These did not enter the broad scientific literature; rather, they became industry and government practices. This paper will examine the appearance of the oil on the sea and provide insight into those appearances that provide correct information about the state of the oil.
The appearance of oil on the sea is subject to several variances [1]. The most important variable is that of oil type. Crude oils are typically brown to black when on the sea in thicker slicks (>3 µm) [1]. Fuel oils are black. The native oil color can have an influence on the final appearance. Secondly, the viewing angle has an influence on appearance when viewing thin slicks [1]. In daylight, with the broad illumination that occurs, the viewing angle is not as important [1]. Atmospheric conditions have an effect on appearance [1]. For example, slick observations can be clearer when there is cloud cover. Atmospheric haze can affect the clarity of observations. Finally, sea conditions can have an influence [1]. Because oil slicks often cover vast areas, the effect of sea conditions on observations is minimized.
2. Rainbow Slicks
Studies have shown that rainbow sheens, a particular form of slick appearance illustrated in Figure 1, actually has different physical origins from other thickness–appearance relationships [1][7][8]. Hornstein [7][8] studied the various slick phenomena and concluded that rainbow sheen was the result of constructive and destructive interference between light reflected from the oil surface and that from the water surface. This is a unique indicator of oil thickness.
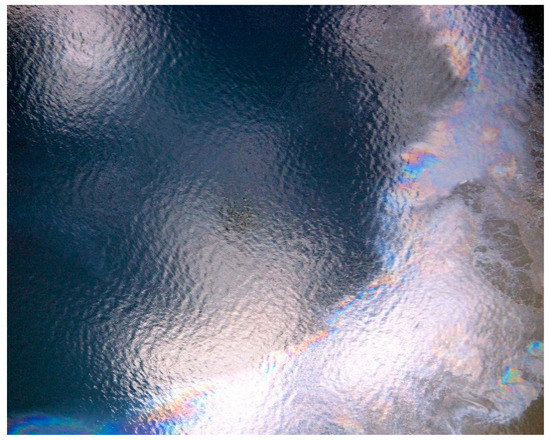
Figure 1. A photograph of a rainbow sheen taken from an aircraft at an altitude of about 300 m. This color of sheen has a strong physical relation to 1 to 1.5 µm.
3. Determination of Water-in-Oil Emulsification
Water-in-oil emulsions sometimes form in rough waters after oil products are spilled. These emulsions, often called “chocolate mousse” or “mousse” by oil spill workers, can make the cleanup of oil spills very difficult [9]. When water-in-oil emulsions form, the physical properties of oil change dramatically. As an example, stable emulsions contain from 60 to 80% water, thus expanding the spilled material from 2 to 5 times the original volume. Most importantly, the viscosity of the oil typically changes from a few hundred mPa·s to about 100,000 mPa·s, an increase by a factor of 500 to 1000. A liquid product is changed into a heavy, semi-solid material.
There are several types of emulsions, two of which are colored reddish because of the specular reflection of light from the water droplets in the oil. These colors can be seen from the air and are distinctive when most of the oil in the scene is emulsified in this manner [4]. This is shown in Figure 2. It should be noted that water-in-oil emulsions sometimes form, dependent on various conditions [10].
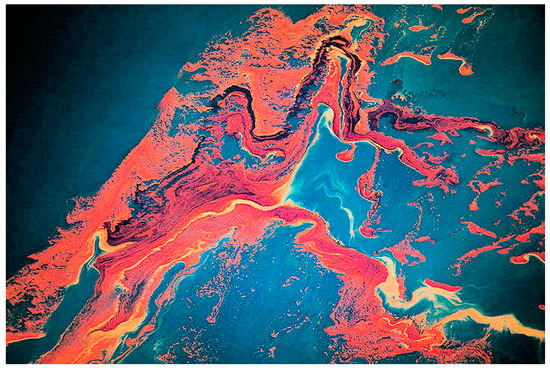
Figure 2. Emulsion shown from an aircraft from an altitude of approximately 100 m.
It is important to note that the red color of water-in-oil emulsions is caused by the specular reflection of the emulsion. Water-in-oil emulsions are opaque to light. The thickness of water-in-oil emulsions is unknown but is thought to be much greater than sheen [10].
Fingas and Fieldhouse [10] found that four clearly-defined water-in-oil types are formed by crude oil when mixed with water. The types are named stable water-in-oil emulsions, meso-stable water-in-oil emulsions, entrained water, and unstable water-in-oil types. The differences among the four types are quite large [11]. The overall properties of the water-in-oil types are shown in Table 1. Table 1 shows that the biggest difference between types are shown in the typical lifetime of the water-in-oil types. Meso-stable emulsions appear very much like stable emulsions but break down within a few days. Figure 3 shows a typical scenario where emulsions appear in streaks among sheen.
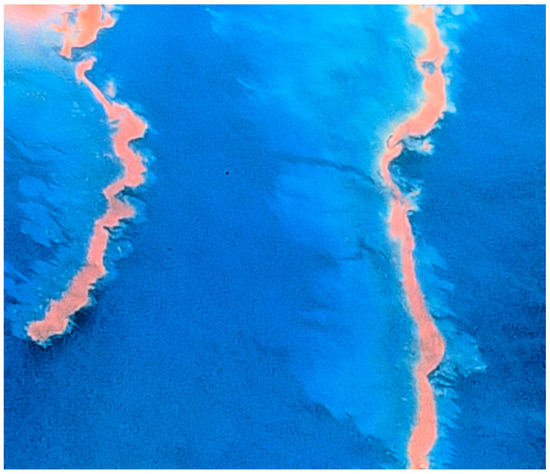
Figure 3. Photograph showing emulsion streaks surround by sheen (thin oil). This photograph was taken from an aircraft flying at about 1000 m.
Table 1. Four ways by which oil uptakes water.
| Type | Color | Typical Lifetime |
|---|---|---|
| Entrained | as oil, typically black, shiny | 2 to 7 days |
| Meso-stable | reddish until broken | 2 to 7 days |
| Stable | reddish | months |
| Unstable or does not uptake water | as oil, typically black | - |
This shows that the reddish-brown characteristic of water-in-oil emulsions, meso-stable and stable, can be visually identified. It should be noted that the presence of emulsions negates other appearance information; however, sheen or thin slicks can exist alongside emulsion, as shown in Figure 3. Emulsion does not form in thin slicks or sheen.
4. Observation of Oil-in-Water Emulsification
Spill countermeasures sometimes involve the application of chemical dispersants to the oil. The results of such activity may result in a dispersion of droplets under the oil slick. This oil-in-water emulsion is called a dispersion in the oil spill trade. If dispersion is successful, a coffee-colored plume in the water is formed, such as that shown in Figure 4 [5][12]. This is a result of the light reflection from the many 5 to 50 µm droplets in the water column [13]. The coffee-colored plume is used as a sign of dispersant effectiveness by oil spill cleanup personnel. This coffee-colored plume develops after about 20 min after the application of dispersants, slowly dissipates and is generally visible up to about 3 h after a spill dispersion. The appearance of oil-in-water emulsions is dependent on their being no oil on the water’s surface to block the transmission of light into and out of the water column.
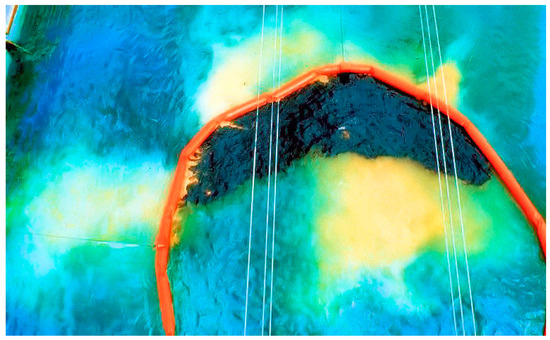
Figure 4. The appearance of a coffee-colored plume after the application of a chemical dispersant to crude oil in a test tank. This photo was taken about 20 min after the application of a dispersant. This coffee-colored plume is the result of light reflection from droplets of oil in the water in the size range of 5 to 50 µm.
This entry is adapted from the peer-reviewed paper 10.3390/jmse9010097
References
- Fingas, M.F. The Challenges of Remotely Measuring Oil Slick Thickness. Remote Sens. 2018, 10, 319.
- Fingas, M.F.; Brown, C.E.; Gamble, L. The Visibility and Detectability of Oil Slicks and Oil Discharges on Water. In Proceedings of the Twenty-Second Arctic and Marine Oil Spill Program Technical Seminar, Calgary, AB, Canada, 2–4 June 1999; pp. 865–886.
- Sicot, G.; Lennon, M.; Miegebielle, V.; Dubucq, D. Estimation of the thickness and emulsion rate of oil spilled at sea using hyperspectral remote sensing imagery in the SWIR domain. Int. Arch. Photogram. Remote Sens. Spat. Inf. Sci. ISPRS Arch. 2015, 40, 445–450.
- Lu, Y.; Shi, J.; Hu, C.; Zhang, M.; Sun, S.; Liu, Y. Optical interpretation of oil emulsions in the ocean—Part II: Applications to multi-band coarse-resolution imagery. Remote Sens. Environ. 2020, 242, 111778.
- IPECA. Dispersants: Surface Application; International Association of Oil & Gas Producers: London, UK, 2015.
- De Padova, D.; Mossa, M.; Adamo, M.; De Carolis, G.; Pasquariello, G. Synergistic use of an oil drift model and remote sensing observations for oil spill monitoring. Environ. Sci. Pollut. Res. 2017, 24, 5530–5543.
- Hornstein, B. The Appearance and Visibility of Thin Oil Films on Water; Environmental Agency Protection Report, EPA-R2-72-039; EPA: Cincinnati, OH, USA, 1972.
- Horstein, B. The Visibility of Oil-Water Discharges. In Proceedings of the 1973 International Oil Spill Conference; American Petroleum Institute: Washington, DC, USA, 1973; pp. 91–99.
- NAS. Oil in the Sea III, Inputs, Fates and Effects, National Research Council; National Academies Press: Washington, DC, USA, 2002.
- Fingas, M.; Fieldhouse, B. Studies on Crude Oil and Petroleum Product Emulsions: Water Resolution and Rheology. Colloids Surfac. A 2009, 333, 67–81.
- Fingas, M. Models for Water-in-Oil Emulsion Formation. In Oil Spill Science and Technology; Elsevier: Amsterdam, The Netherlands, 2011; Chapter 10; pp. 243–273.
- Cedre, F. (Ed.) Using Dispersants to Treat Oil Slicks at Sea: Airborne and Shipborne Treatment Response Manual; Centre for Documentation, Research and Experimentation on Accidental Water Pollution (CEDRE): Brest, France, 2005.
- Fingas, M. Oil Spill Dispersants: A Technical Summary. In Oil Spill Science and Technology; Gulf Publishing Company: Houston, TX, USA, 2011; Chapter 15; pp. 435–582.