Cell adhesive force, exerting on the local matrix or neighboring cells, plays a critical role in regulating many cell functions and physiological processes. In the past four decades, significant efforts have been dedicated to cell adhesive force detection, visualization and quantification. Traction force microscopy (TFM) pioneered the detection and visualization of cell adhesive force. A recent important methodological advancement in cell adhesive force visualization is to ultilize fluorescent tension sensor (FTS) to convert force to fluorescence onsite, thus greatly improving the sensitivity and resolution of force imaging. Here, TFM and FTS-based imaging techniques are collectively termed as Cell Adhesive Force Microscopy (CAFM).
- integrin
- cell adhesion
- cell adhesive force
- cell
1. Introduction
Cells are dynamic systems which constantly undergo biochemical and physical activities. Early cell biology studies have focused on understanding the biochemical aspects of cells, such as genetics, immunology, development, pathology, etc. The physical aspect received relatively less attention until recent decades. As cells live in a physical world, many biological motions in metazoan cells including cell adhesion, migration and division are driven by physical forces. These forces are critical for the normal functions and sustainability of cells. In particular, cell adhesive force, a result of cell–matrix and cell–cell biophysical interactions, has emerged as an important physical signal in regulating cell functions and maintaining tissue integrity. In the long term, cell adhesive force can also be converted to biochemical signals through mechanotransduction, and take effect on cell survival [1], proliferation [2], differentiation [3], cancer progression [4], biological development [5], immune response [6] and more. Hence, substantial research interests have been drawn to study cell adhesive force and its related biological functions in the recent four decades.
To study a signal, one needs first to detect and quantify the signal. As cell adhesive force is spatially distributed across the cell–matrix or cell–cell interface, visualization of the force would provide critical information about the force distribution and dynamics. Cell adhesive force visualization had not been easily accessible due to the miniscule level of force (at the piconewton (pN)–nanonewton (nN) level) produced by cells and the invisible nature of force signals. To “see” the force, one needs to find an approach to convert the invisible force to a visible signal. Retrospectively speaking, cell adhesive force sensing methods can be categorized into two types: force-to-strain conversion adopted in traction force microscopy (TFM), and force-to-fluorescence conversion adopted by fluorescent tension sensors (FTSs). The prototypes of TFM were developed in the 1980s. Cell adhesive force was first visualized by plating cells on ultrathin elastic silicone films [7]. The cells contracted and produced wrinkles on the film which can be imaged by an optical microscope. In the following decades, a series of TFMs have been developed based on this strategy of force-to-strain conversion [8][9][10][11][12][13][14][15][16]. The force–reporting substrates are generally elastic materials embedded with fluorescent markers reporting the force-induced substrate strains (Figure 1A), or with micro-patterns whose deformation can be monitored (Figure 1B). With computational modeling, the substrate strain maps are converted to cell stress maps, hence reporting the lateral distribution of cell adhesive force. TFM pioneered cell adhesive force visualization and has the unique advantages in measuring whole cell force.
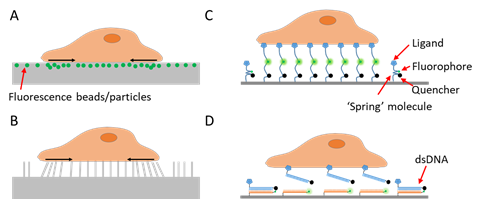
Figure 1. Schematics of techniques for cell adhesive force imaging. (A) Traction force microscopy (TFM) using an elastic polymer film doped with fluorescence beads or particles as the substrate. TFM converts cell adhesive force to substrate deformation. (B) TFM using micropillar arrays as the substrate. TFM records the bending of the micropillar arrays and computes the cell adhesive force. (C) Fluorescent tension sensor (FTS) converts cell adhesive force to fluorescence using an “entropic spring” molecule. (D) FTS based on binary material with distinct on/off states such as double-stranded DNA (dsDNA) or hairpin DNA.
However, compared to the cell structural imaging that benefits from fluorescent staining or fluorescent proteins, strain-based TFM has inferior resolution, which is usually in the range of microns [17]. As many force transmission structures in cells, such as podosomes, invadopodia, focal complexes, filopodia, etc., are in the size of microns or submicrons, new techniques were in demand to improve the resolution of cell adhesive force imaging. A new strategy for force imaging was developed in the recent decade. A number of techniques adopted force-to-fluorescence conversion to visualize cell adhesive force. Such a strategy was first adopted by tension sensors that are genetically expressed inside cells [18][19]. The strategy was then adopted by extracellular tension sensors that are immobilized on surfaces and target specific force-transmitting receptors on the cell membrane [20][21][22][23][24] (Figure 1C,D). These tension sensors are force-activatable units that emit fluorescence or alter their fluorescent properties under tension. The onsite fluorescent signal responding to local molecular force events gives rise to unprecedented spatial resolution and sensitivity in cell adhesive force imaging. Here we collectively dub these sensors as fluorescent tension sensors (FTSs). There are already several excellent reviews covering TFM and FTSs, separately [25][26][27][28]. This review compares the performance of TFM and FTSs, and focuses on the recent advances in spatial resolutions of these methods. This review also discusses biomaterial choices for constructing FTSs and highlights the performance of DNA and DNA-like materials as the FTS constructs.
Of note, there are another series of point-based single-molecule force techniques such as atomic force microscopy (AFM) [29], optical tweezers [30], magnetic tweezers [31] and biomembrane force probes [32]. These techniques proactively apply force to probe the mechanical properties of single biomolecules or molecular bonds, and are advantageous in obtaining the force spectroscopy of biomechanical events such as protein unfolding, bond dissociation, etc. Because these techniques do not image force (AFM generally does not perform imaging when used as a force probing tool) and the force is produced by the instruments as a probing signal, we do not categorize them into CAFM in this review as CAFM is developed to image cell-generated force. Readers interested in these single-molecule force techniques may refer to other review articles [33].[34][35][36][37][38][39][40][41][42][43][44][45][46][47][48][49][50][51][52][53][54][55]
2. Advances in Cell Adhesive Force Microscopy in Term of Spatial Resolution
In this review, we focus on presenting and discussing the spatial resolutions offered by the two branches of CAFMs: TFM and FTS-enabled CAFM. Table 1 summarizes their spatial resolutions.
Table 1. Force detection ranges and spatial resolutions of cell adhesive force microscopies.
|
|
Detection Range |
Spatial Resolution |
Reference |
|
|
TFM |
~1 nN |
1–5 μm |
[7, 34-38] |
|
|
Super-resolution TFM |
<1 nN |
40–80 nm * |
[15, 16] |
|
|
FTS-based cell adhesive force microcopy |
PEG |
0–20 pN |
<1 μm |
[22, 23, 39-41] |
|
peptide |
1–100 pN |
<1 μm |
[42, 43] |
|
|
DNA hairpin |
7–14 pN |
<1 μm |
[24, 40, 44, 45] |
|
|
dsDNA |
12–54 pN |
<1 μm |
[46-53] |
|
|
CFN |
12–54 pN |
50 nm |
[54] |
|
|
tPAINT |
7–14 pN |
25 nm |
[55] |
|
* Not force resolution, but accuracy of bead tracking.
2.1. Traction Force Microscopy Pioneered Cell Adhesive Force Imaging
To detect and evaluate cell adhesive force, the prototype of traction force microscopy (TFM) was developed in the 1980s [7]. Subsequently, TFM was continuously improved and the algorithm was also refined for cell adhesive force computation. In TFM, cells are cultured on deformable polymer films [34] (Figure 1A) or micropillar arrays [10, 35, 36] (Figure 1B). The deformation of the substrates caused by cells is monitored by optical microscopy. To aid the deformation monitoring, the substrates are often embedded with fluorescent beads and the micropillar tips are fluorescently stained. By converting the displacements of the elastic substrates or micropillar arrays to traction stresses, TFM quantitatively maps force distribution at the interface between a cell and the extra-cellular matrix (ECM). TFM also has wide dynamic range and is adaptive to force measurement at different force levels. This can be achieved simply by altering substrate elasticity. However, because TFM computes cellular force from a strain map in an indirect manner, it had limited spatial resolution and sensitivity as an imaging technique. It is challenging for TFM to resolve forces in micron-sized cells (e.g., the small blood cell platelets) or subcellular structures (focal complexes, podosomes, filopodia, etc.). Figure 2A–C shows the representative TFM images of fibroblasts, keratocytes and platelets.
Continuous efforts have been made to improve the resolution of TFM. A high-resolution TFM microscope compatible with spinning-disk confocal setting was developed in Waterman’s lab with a 10–20 µm thick fibronectin-coated polyacrylamide substrate [37]. The polymer substrates were embedded with a high density of fluorescent beads. By reconstructing the cell-induced bead displacements to cellular traction stress, a spatial resolution of ~1 μm was achieved using the Fourier-transform traction cytometry method. The improved spatial resolution was ascribed to high areal density (10 beads/μm2) of small-sized (40 nm) fluorescent beads in the polymer substrates. This high-resolution traction force microscopy revealed a robust biphasic relationship between F-actin polymerization speed and traction force [56], and showed force fluctuation in focal adhesions (FAs) [13].
Lately, super-resolved TFM microscopes have also been developed by increasing the accuracy in localizing fluorescent markers embedded in the substrate [15]. An improved fluctuation-based super-resolution (FBSR) traction force microscopy was reported by further increasing the bead density and only embedding fluorescent beads on the topmost layer of the gel [16]. Moreover, the FBSR algorithm and two-step deconvolution led to a better localization of the fluorescent beads. These methods further improved the accuracy in producing the strain map that is important for the reconstruction of the cell adhesive force map with higher resolution. However, of note, the accuracy of bead tracking is different from the resolution of cell adhesive force imaging. Although these methods gained higher accuracy in tracking the beads, the cell adhesive force usually cannot be reconstructed at a resolution comparable to the accuracy level. The computation of high-resolution traction force also demands considerably higher computation power and longer calculation time.
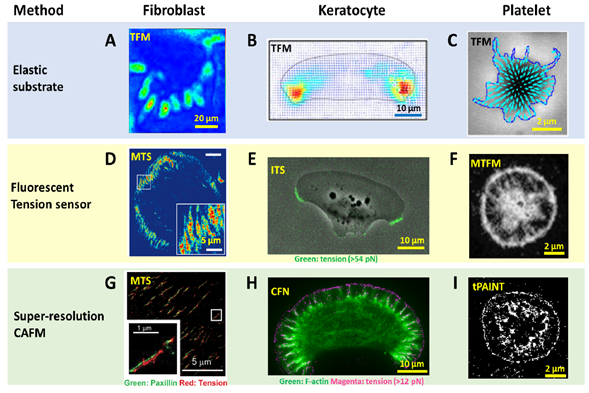
Figure 2. Advances in spatial resolution of cell adhesive force imaging techniques. (A–C) Force maps of a fibroblast [57], a migatory keratocyte [58] and a stationary platelet [59] obtained by TFM. The resolution is in the range of 1–5 µm. (D–F) Force maps of a fibroblast obtained by molecular tension sensor (MTS) [43], a keratocyte obtained by integrative tension sensor (ITS) [50] and a platelet obtained by molecular tension fluorescence microscopy (MTFM) [60], respectively. The resolutions are at the diffraction limit: 0.3–0.4 µm. (G–I) super-resolution force maps of a fibroblast obtained by MTS assisted with Bayesian computation [61], a keratocyte obtained by cellular force nanoscopy (CFN) [54] and a platelet obtained by tPAINT [55], respectively. Resolutions were reported as 50–100 nm for the live cell samples.
2.2. Fluorescent Tension Sensors Bring the Resolution of Force Imaging to Diffraction Limit
In the recent decade, FTSs have been developed to convert cell adhesive force to fluorescence onsite. Immobilized on surfaces, these sensors are equipped with ligands that bind to target force-transmitting receptors (mainly integrins) on the cell membrane. Cells are plated and cultured on sensor-grafted surfaces. The integrins bind and transmit force to the sensors, which respond with a fluorescent signal. While a variety of biomaterial molecules have been adopted to construct these sensors, as detailed in another section, these sensors share a similar force-sensing principle. The main constructs of the sensors are deformable molecules that are responsive to molecular tensions. The constructs are labeled with a dye, a dye–quencher pair or a dye–dye pair. When the construct configuration is altered by force, the fluorescent activity of the sensor is consequently changed. Thus, cell adhesive force can be reported by surface fluorescence loss, fluorescence gain or Förster resonance energy transfer (FRET) [62] efficiency change. Note that the responsivity range of the sensor constructs should match the range of the molecular force transmitted by single receptors (such as integrins). Empirically speaking, integrin tension has a broad range varying in 1–100 pN.
With force-to-fluorescence conversion, the spatial resolution of cell adhesive force imaging was immediately brought to the diffraction limit. A series of fluorescent tension sensors such as MTS [43], TGT [21], MTFM sensor [60], TP [24] and ITS [49] have been developed to image cell adhesive forces. These sensors have been routinely applied to visualize cell adhesive forces in fibroblasts, platelets, keratocytes, T cells, etc. (Figure 2D–F). With these sensors, cell adhesive force has become as visible as cell structures, making the force-structure study highly convenient. A detailed discussion about these sensors is included in next section with an emphasis on biomaterials used in the sensor construction.
Tension sensors report force with high resolution, but usually cannot measure the whole cell force. This is because tension sensor activation by force is stochastic at the molecular level, and not all cell adhesive force is transmitted onto sensors. In this regard, the tension sensor cannot replace TFM. However, the perk brought by tension sensors is not only the improved resolution, but also the capability of evaluating the force level of the molecular tension transmitted by single receptors. The molecular construct of the sensor can be tuned to be responsive to a designed force level, enabling the selective visualization of molecular tension in a certain range. Therefore, although these sensors do not evaluate bulk cell adhesive force, they have a unique advantage of assessing the cell adhesive force at the molecular tension level.
2.3. Super-Resolved Cell Adhesive Force Microscopies
With FTSs, it seems naturally feasible to enable force imaging with resolution beyond the diffraction limit by integrating the sensors with super-resolution microscopies. The term ”super-resolution” refers to the resolution beyond the diffraction limit of optical microscopy. Among the various techniques enabling super-resolution imaging, stochastic optical reconstruction microscopy (STORM) [63] and photoactivated localization microscopy (PALM) [64] are the representative ones. STORM and PALM share the similar principle of using single molecule imaging and localization to break the diffraction limit. The dyes in an ensemble are sparsely and stochastically turned on and off, to ensure the imaging of these dyes in a molecularly distinguishable manner. The center of the point-spread functions of fluorescence from each dye can be localized with ultra-high accuracy, which reaches the nanometer level. By imaging and localizing these dyes in many consecutive frames, one can assemble the frames and reconstruct the image of the dye-stained sample with a resolution beyond the diffraction limit. Since FTSs are able to convert force to fluorescence, the technical challenge to achieve super-resolution force imaging is about how to report force signals in a sparse and stochastic manner.
Computational super-resolution force microscopy. Computational super-resolution force microscopy was developed with the combination of molecular tension sensors (MTSs) [61] and Bayesian localization microscopy [65]. In this method, cell adhesive force signals are recorded by MTS immobilized on a surface. The fluorescence activated by cell adhesive force is collected in ensemble, not at the molecular tension level. By inducing bleaching and blinking of the dyes in the consecutive frame, one can apply Bayesian analysis to extract spatial information of the sensor activation sites beyond the diffraction limit. It demonstrated the visualization of traction forces within FAs with about 100 nm spatial resolution (Figure 2G). This technique is the first attempt in the field to obtain cell adhesive force in a super-resolution manner. However, Bayesian analysis is computationally demanding, and it is difficult to acquire the cell adhesive force dynamics in real time. The resulting resolution is generally inferior to that provided by super-resolution microscopies based on single molecule localization.
Super-resolution force microscopy based on single molecule imaging and localization. By the time of this review, two force microscopies based on molecule localization have emerged: cellular force nanoscopy (CFN) [54] and tPAINT [55]. Both techniques report integrin tensions in a stochastic and sparse manner, so that the fluorescent tension signals are distinguishable in each frame of imaging for the purpose of molecular localization. Single molecule localization is then performed to localize the tension events with ultra-high accuracy. By repeating this process to each frame, a force map with super-resolution is obtained. Although both CFN and tPAINT use DNA-based tension sensors, there is distinct difference between them in terms of how to achieve sparse and stochastic tension imaging. In CFN, a force-activatable emitter is used as the tension sensor. This emitter is conjugated with a quencher–dye pair, hence being dark until activated by targeted integrin tension. The dye of the emitter is bright and can be easily bleached. As a result, the fluorescence of tension events in each frame is collected and bleached, to ensure the sparsity required by single molecule imaging and localization. Although the emitters are not reusable once activated and photobleached, the high coating density of sensors (~2000/μm2) ensures sufficient sensors for cell adhesive force imaging. In tPAINT, the surface-immobilized DNA-hairpin tension sensors are not conjugated with dyes or quenchers. Instead, the sensor has a cryptic site that is openable by force and provides a docking site for complementary ssDNA-dye diffusing in the ambient solution. The sparse and stochastic tension imaging is enabled by the transient binding and dissociation between the docking site and ssDNA-dye. Both CFN and tPAINT have successfully achieved single integrin tension imaging, and demonstrated 50 nm and 25 nm resolutions, respectively, in live cell adhesive force imaging (Figure 2H,I). A potential limit of CFN originates from the irreversible dye bleaching, resulting in a gradual consumption of local sensors by cells. Still, in a practical test, CFN can provide up to 1000 frames of force images before the sensor density has an appreciable decrease. A potential limit of tPAINT could be due to the obstructed or reduced diffusion of ssDNA-dye to sensor location under cell adhesion regions at the cell–substrate interface, therefore affecting the fidelity of reporting local force density. Another technical challenge shared by both CFN and tPAINT is the spontaneous DNA dissociation due to thermal energy which yields non-specific fluorescent signals unrelated to cell adhesive force. In the future, a fluorescent tension sensor with higher thermal stability is desired to reduce or eliminate such background false signals.
This entry is adapted from the peer-reviewed paper 10.3390/s20247128
References
- Vogel, V.; Sheetz, M. Local force and geometry sensing regulate cell functions. Nat. Rev. Mol. Cell Biol. 2006, 7, 265–275.
- LeGoff, L.; Lecuit, T. Mechanical Forces and Growth in Animal Tissues. Cold Spring Harb. Perspect. Biol. 2015, 8, a019232–a019232.
- Discher, D.E.; Janmey, P.; Wang, Y.-L. Tissue Cells Feel and Respond to the Stiffness of Their Substrate. Science 2005, 310, 1139.
- Kumar, S.; Weaver, V.M. Mechanics, malignancy, and metastasis: The force journey of a tumor cell. Cancer Metastasis Rev. 2009, 28, 113–127.
- Geiger, B.; Spatz, J.P.; Bershadsky, A.D. Environmental sensing through focal adhesions. Nat. Rev. Mol. Cell Biol. 2009, 10, 21–33.
- Rossy, J.; Laufer, J.M.; Legler, D.F. Role of Mechanotransduction and Tension in T Cell Function. Front. Immunol. 2018, 9, 2638.
- Harris, A.K.; Wild, P.; Stopak, D. Silicone rubber substrata: A new wrinkle in the study of cell locomotion. Science 1980, 208, 177–179.
- Balaban, N.Q.; Schwarz, U.S.; Riveline, D.; Goichberg, P.; Tzur, G.; Sabanay, I.; Mahalu, D.; Safran, S.; Bershadsky, A.; Addadi, L.; et al. Force and focal adhesion assembly: A close relationship studied using elastic micropatterned substrates. Nat. Cell Biol. 2001, 3, 466–472.
- Beningo, K.A.; Dembo, M.; Kaverina, I.; Small, J.V.; Wang, Y.-l. Nascent Focal Adhesions Are Responsible for the Generation of Strong Propulsive Forces in Migrating Fibroblasts. J. Cell Biol. 2001, 153, 881–888.
- Tan, J.L.; Tien, J.; Pirone, D.M.; Gray, D.S.; Bhadriraju, K.; Chen, C.S. Cells lying on a bed of microneedles: An approach to isolate mechanical force. Proc. Natl. Acad. Sci. USA 2003, 100, 1484.
- Legant, W.R.; Miller, J.S.; Blakely, B.L.; Cohen, D.M.; Genin, G.M.; Chen, C.S. Measurement of mechanical tractions exerted by cells in three-dimensional matrices. Nat. Methods 2010, 7, 969.
- Franck, C.; Maskarinec, S.A.; Tirrell, D.A.; Ravichandran, G. Three-Dimensional Traction Force Microscopy: A New Tool for Quantifying Cell-Matrix Interactions. PLoS ONE 2011, 6, e17833.
- Plotnikov, S.V.; Pasapera, A.M.; Sabass, B.; Waterman, C.M. Force Fluctuations within Focal Adhesions Mediate ECM-Rigidity Sensing to Guide Directed Cell Migration. Cell 2012, 151, 1513–1527.
- del Álamo, J.C.; Meili, R.; Álvarez-González, B.; Alonso-Latorre, B.; Bastounis, E.; Firtel, R.; Lasheras, J.C. Three-Dimensional Quantification of Cellular Traction Forces and Mechanosensing of Thin Substrata by Fourier Traction Force Microscopy. PLoS ONE 2013, 8, e69850.
- Colin-York, H.; Shrestha, D.; Felce, J.H.; Waithe, D.; Moeendarbary, E.; Davis, S.J.; Eggeling, C.; Fritzsche, M. Super-Resolved Traction Force Microscopy (STFM). Nano Lett. 2016, 16, 2633–2638.
- Stubb, A.; Laine, R.F.; Miihkinen, M.; Hamidi, H.; Guzmán, C.; Henriques, R.; Jacquemet, G.; Ivaska, J. Fluctuation-Based Super-Resolution Traction Force Microscopy. Nano Lett. 2020, 20, 2230–2245.
- Polacheck, W.J.; Chen, C.S. Measuring cell-generated forces: A guide to the available tools. Nat. Methods 2016, 13, 415–423.
- Meng, F.; Suchyna, T.M.; Sachs, F. A fluorescence energy transfer-based mechanical stress sensor for specific proteins in situ. FEBS J. 2008, 275, 3072–3087.
- Grashoff, C.; Hoffman, B.D.; Brenner, M.D.; Zhou, R.; Parsons, M.; Yang, M.T.; McLean, M.A.; Sligar, S.G.; Chen, C.S.; Ha, T.; et al. Measuring mechanical tension across vinculin reveals regulation of focal adhesion dynamics. Nature 2010, 466, 263–266.
- Stabley, D.R.; Jurchenko, C.; Marshall, S.S.; Salaita, K.S. Visualizing mechanical tension across membrane receptors with a fluorescent sensor. Nat. Methods 2012, 9, 64–67.
- Wang, X.; Ha, T. Defining Single Molecular Forces Required to Activate Integrin and Notch Signaling. Science 2013, 340, 991–994.
- Liu, Y.; Yehl, K.; Narui, Y.; Salaita, K. Tension sensing nanoparticles for mechano-imaging at the living/nonliving interface. J. Am. Chem. Soc. 2013, 135, 5320–5323.
- Morimatsu, M.; Mekhdjian, A.H.; Adhikari, A.S.; Dunn, A.R. Molecular tension sensors report forces generated by single integrin molecules in living cells. Nano Lett. 2013, 13, 3985–3989.
- Blakely, B.L.; Dumelin, C.E.; Trappmann, B.; McGregor, L.M.; Choi, C.K.; Anthony, P.C.; Duesterberg, V.K.; Baker, B.M.; Block, S.M.; Liu, D.R.; et al. A DNA-based molecular probe for optically reporting cellular traction forces. Nat. Methods 2014, 11, 1229–1232.
- Jurchenko, C.; Salaita, K.S. Lighting up the Force: Investigating Mechanisms of Mechanotransduction Using Fluorescent Tension Probes. Mol. Cell. Biol. 2015, 35, 2570–2582.
- Matellan, C.; Del Río Hernández, A.E. Where No Hand Has Gone Before: Probing Mechanobiology at the Cellular Level. ACS Biomater. Sci. Eng. 2019, 5, 3703–3719.
- Ma, V.P.-Y.; Salaita, K. DNA Nanotechnology as an Emerging Tool to Study Mechanotransduction in Living Systems. Small 2019, 15, 1900961.
- Yasunaga, A.; Murad, Y.; Li, I.T.S. Quantifying molecular tension-classifications, interpretations and limitations of force sensors. Phys. Biol. 2020, 17, 011001.
- Binnig, G.; Quate, C.F.; Gerber, C. Atomic Force Microscope. Phys. Rev. Lett. 1986, 56, 930–933.
- Ashkin, A. Optical trapping and manipulation of neutral particles using lasers. Proc. Natl. Acad. Sci. USA 1997, 94, 4853–4860.
- Smith, S.B.; Finzi, L.; Bustamante, C. Direct mechanical measurements of the elasticity of single DNA molecules by using magnetic beads. Science 1992, 258, 1122.
- Evans, E.; Ritchie, K.; Merkel, R. Sensitive force technique to probe molecular adhesion and structural linkages at biological interfaces. Biophys. J. 1995, 68, 2580–2587.
- Neuman, K.C.; Nagy, A. Single-molecule force spectroscopy: Optical tweezers, magnetic tweezers and atomic force microscopy. Nat. Methods 2008, 5, 491–505.
- Dembo, M.; Wang, Y.L. Stresses at the cell-to-substrate interface during locomotion of fibroblasts. Biophys. J. 1999, 76, 2307–2316.
- Fu, J.; Wang, Y.K.; Yang, M.T.; Desai, R.A.; Yu, X.; Liu, Z.; Chen, C.S. Mechanical regulation of cell function with geometrically modulated elastomeric substrates. Nat. Methods 2010, 7, 733–736.
- Pandey, P.; Hawkes, W.; Hu, J.; Megone, W.V.; Gautrot, J.; Anilkumar, N.; Zhang, M.; Hirvonen, L.; Cox, S.; Ehler, E.; et al. Cardiomyocytes Sense Matrix Rigidity through a Combination of Muscle and Non-muscle Myosin Contractions. Dev. Cell 2018, 44, 326–336.e323.
- Sabass, B.; Gardel, M.L.; Waterman, C.M.; Schwarz, U.S. High resolution traction force microscopy based on experimental and computational advances. Biophys. J. 2008, 94, 207–220.
- Hui, K.L.; Balagopalan, L.; Samelson, L.E.; Upadhyaya, A. Cytoskeletal forces during signaling activation in Jurkat T-cells. Mol. Biol. Cell 2015, 26, 685–695.
- Wiegand, T.; Fratini, M.; Frey, F.; Yserentant, K.; Liu, Y.; Weber, E.; Galior, K.; Ohmes, J.; Braun, F.; Herten, D.P.; et al. Forces during cellular uptake of viruses and nanoparticles at the ventral side. Nat. Commun. 2020, 11, 1–13.
- Glazier, R.; Brockman, J.M.; Bartle, E.; Mattheyses, A.L.; Destaing, O.; Salaita, K. DNA mechanotechnology reveals that integrin receptors apply pN forces in podosomes on fluid substrates. Nat. Commun. 2019, 10, 1–13.
- Liu, Y.; Medda, R.; Liu, Z.; Galior, K.; Yehl, K.; Spatz, J.P.; Cavalcanti-Adam, E.A.; Salaita, K. Nanoparticle tension probes patterned at the nanoscale: Impact of integrin clustering on force transmission. Nano Lett 2014, 14, 5539–5546.
- Tan, S.J.; Chang, A.C.; Anderson, S.M.; Miller, C.M.; Prahl, L.S.; Odde, D.J.; Dunn, A.R. Regulation and dynamics of force transmission at individual cell-matrix adhesion bonds. Sci. Adv. 2020, 6, 1–12.
- Chang, A.C.; Mekhdjian, A.H.; Morimatsu, M.; Denisin, A.K.; Pruitt, B.L.; Dunn, A.R. Single Molecule Force Measurements in Living Cells Reveal a Minimally Tensioned Integrin State. ACS Nano 2016, 10, 10745–10752.
- Zhao, B.; O’Brien, C.; Mudiyanselage, A.P.K.K.K.; Li, N.W.; Bagheri, Y.; Wu, R.; Sun, Y.B.; You, M.X. Visualizing Intercellular Tensile Forces by DNA-Based Membrane Molecular Probes. J. Am. Chem. Soc. 2017, 139, 18182–18185.
- Blanchard, A.T.; Bazrafshan, A.S.; Yi, J.; Eisman, J.T.; Yehl, K.M.; Bian, T.; Mugler, A.; Salaita, K. Highly Polyvalent DNA Motors Generate 100+ pN of Force via Autochemophoresis. Nano Lett. 2019, 19, 6977–6986.
- Wang, Y.; Wang, X. Integrins outside focal adhesions transmit tensions during stable cell adhesion. Sci. Rep. 2016, 6, 1–9.
- Jo, M.H.; Cottle, W.T.; Ha, T. Real-Time Measurement of Molecular Tension during Cell Adhesion and Migration Using Multiplexed Differential Analysis of Tension Gauge Tethers. ACS Biomater. Sci. Eng. 2019, 5, 3856–3863.
- Wang, X.; Sun, J.; Xu, Q.; Chowdhury, F.; Roein-Peikar, M.; Wang, Y.; Ha, T. Integrin Molecular Tension within Motile Focal Adhesions. Biophys. J. 2015, 109, 2259–2267.
- Wang, Y.; LeVine, D.N.; Gannon, M.; Zhao, Y.; Sarkar, A.; Hoch, B.; Wang, X. Force-activatable biosensor enables single platelet force mapping directly by fluorescence imaging. Biosens. Bioelectron. 2018, 100, 192–200.
- Zhao, Y.; Wang, Y.; Sarkar, A.; Wang, X. Keratocytes Generate High Integrin Tension at the Trailing Edge to Mediate Rear De-adhesion during Rapid Cell Migration. iScience 2018, 9, 502–512.
- Murad, Y.; Li, I.T.S. Quantifying Molecular Forces with Serially Connected Force Sensors. Biophys. J. 2019, 116, 1282–1291.
- Wang, X.; Rahil, Z.; Li, I.T.S.; Chowdhury, F.; Leckband, D.E.; Chemla, Y.R.; Ha, T. Constructing modular and universal single molecule tension sensor using protein G to study mechano-sensitive receptors. Sci. Rep. 2016, 6, 21584.
- Li, I.T.S.; Ha, T.; Chemla, Y.R. Mapping cell surface adhesion by rotation tracking and adhesion footprinting. Sci. Rep. 2017, 7, 44502.
- Zhao, Y.; Pal, K.; Tu, Y.; Wang, X. Cellular Force Nanoscopy with 50 nm Resolution Based on Integrin Molecular Tension Imaging and Localization. J. Am. Chem. Soc. 2020, 142, 6930–6934.
- Brockman, J.M.; Su, H.; Blanchard, A.T.; Duan, Y.; Meyer, T.; Quach, M.E.; Glazier, R.; Bazrafshan, A.; Bender, R.L.; Kellner, A.V.; et al. Live-cell super-resolved PAINT imaging of piconewton cellular traction forces. Nat. Methods 2020, 17, 1018–1024.