Your browser does not fully support modern features. Please upgrade for a smoother experience.
Please note this is an old version of this entry, which may differ significantly from the current revision.
Subjects:
Engineering, Industrial
As greenhouse gas (GHG) emissions continue to increase, governments throughout the world are under increasing pressure to enact legislation restricting emissions and implement environmental measures, such as the Kyoto Protocol and the European Union Emission Trading System.
- CO2 policies
- green supply chain
- closed-loop
- COVID-19 pandemic
1. Introduction
Forward and reverse flows are combined to create a closed-loop supply chain (CLSC) [1]. Considering their customers, their social duties, the environment, state and federal legislation, and waste management are the main reasons manufacturers pursue CLSC [2]. Formerly, CLSCs were an unwanted limitation, but they are now a desirable requirement and will be the only form of redress going forward. A green supply chain is an economic and environmental perspective-based supply chain (GSC). A green closed-loop supply chain (GCLSC) combines the forwarding and reverse supply chains [3]. The GSC aids in the reduction of environmental consequences and the production of eco-friendly goods. In addition to the economic benefits of product recovery, the law has elevated GCLSC’s significance. CO2, ozone, methane, and other greenhouse gases are emitted as a result of supply chain operations [4].
As greenhouse gas (GHG) emissions continue to increase, governments throughout the world are under increasing pressure to enact legislation restricting emissions and implement environmental measures, such as the Kyoto Protocol [5] and the European Union Emission Trading System [6]. As part of the 1997 United Nations Framework Convention on Climate Change, countries from all over the world negotiated the Kyoto Protocol. As of May 2008 [7], approximately 181 nationalities had confirmed, adhered to, or endorsed the protocol. COVID-19 can be transferred from one individual to another in a matter of minutes. A pandemic can create chaos in Supply Chains (SCs) [8]. To deal with environmental destruction and resource scarcity, closed-loop supply chains (CLSCs) are an alternative logistics method. Material control, emissions reduction, and cost-effective production are all characteristics of CLSC. By storing material in a CLSC, the SC activities can have a lower environmental impact. With growing concern over the environment, a Green Closed-Loop Supply Chain Network (GCLSCN) has been identified as a critical issue [9].
In addition to its continuing outbreak, COVID-19 impacts emissions fundamentally. With the development of environmental protection legislation, client awareness, and carbon policies, Supply Chain Design (SCD) has become a primary objective for reducing CO2 emissions. According to China, CO2 emissions were reduced during the COVID-19 outbreak [10].
According to Figure 1, countries have committed to achieving net zero emissions and have classified their climate change policies accordingly.
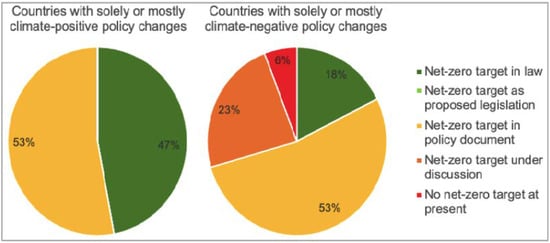
Figure 1. Country commitments to net-zero emissions and their climate change policy categories [11,12].
2. Carbon Tax
In the research of Paksoy et al., altering the severity of emissions may result in a 100–400 percent increase in emissions [13]. According to Fahimnia et al. [14], for a significant shift to occur, a high tax rate must be accompanied by fluctuating fuel costs. According to the analysis by Zakeri et al., it no longer reduces emissions compared with the 5-speed pricing [15]. If the tax rate surpasses 50 AUD/ton, it is necessary to set the correct tax rate despite the likelihood of an increase. Only by converting the SC from a high-emitting to a low-emitting technology can a carbon tax be implemented. To choose pipelines, you must pay $5.50 per kg [16] By comparing the total cost to the carbon tax rate, Peng et al. [17] observe a relationship between the two variables.
Carbon taxes impact pricing decisions and social welfare in a SC with multiple competing retailers [18]. A study on human-driven edge computing for intelligent decision-making about low-carbon SCs based on carbon tax constraints [19]. Developing a competitive SC for low-carbon products following the implementation of carbon taxes [20]. Assessment of the effects of the carbon tax on manufacturing in a CLSC [21]. Carbon tax regulation for climate change mitigation under energy performance contracting with financially asymmetric manufacturers [22]. An analysis of a manufacturer’s decisions under repurchase strategies of carbon emission permit capital constraints [23]. As a general rule, a carbon tax will lead to higher costs associated with burning fossil fuels, which will affect the cost of producing goods and services reliant on them. The impact of a carbon tax policy on SCM [24]. In the context of a carbon tax regulatory scheme, optimizing inventory choices for CLSC is important [25].
3. Carbon CAP
Carbon cap policies typically presume that carbon emissions are restricted and that this limitation must be maintained. In numerous GSCND studies, typical carbon cap strategies have been considered. Numerous authors have attempted to reduce CO2 emissions from shipping by limiting manufacturing [26,27], warehousing [26,28], and transportation [26,28,29,30,31,32].
Among the numerous CO2 emissions mentioned by Mart et al. [33] are those resulting from raw materials, production, storage, and transportation. Moreover, refs. [34,35,36,37,38] considered a serial or universal carbon cap for the GSCND. Zhang et al. [36] suggest that a worldwide carbon cap would be more advantageous. It is also feasible to employ varying emission limitations based on the policy in place. Several studies, including Tao et al. [38], have been conducted regarding this idea. In situations with a high emission limit, a global cap is preferable. Consequently, periodic caps have become prevalent. Benjaafar et al. [35] use different models for single and multiple enterprises in their research.
The impact of carbon limits on the environmental performance of SSCs [39]. Carbon-capped SCs are connected with issues [40]. A two-tier SC with two retailers and one supplier must make pricing decisions based on the carbon cap rule [41]. The various power structures in a SC with government carbon cap restrictions and attempts to decrease carbon emissions from manufacturers [42].
There is a comparison between various allocation rules for online and offline retail SCs and cap-and-trade regulations [43], including a carbon tax and the reduction in carbon emissions from a cement production facility in operation [44], which considered carbon cap-and-trade regulations, carbon market modeling, and chilled logistics services [45]. When choosing which channel will be used for the collection of carbon cap-and-trade rules, a reverse SC is recommended [46].
Combining vendor-managed inventory partnerships and carbon cap-and-trade policies to implement a low-carbon SC model [47]. Cap-and-trade methods reduce CO2 emissions while considering price policies and reciprocal preferences [48]. Through cap-and-trade regulations, carbon emissions are reduced, and goods are collected in CLSCs [49]. Green technology was re-examined in a two-tiered SC with stringent carbon-cap rules [50]. Dual-channel stochastic SC combines the preferences of clients for low-carbon consumption and cap-and-trade regulations [51]. A dual-channel SC utilizes cap-and-trade legislation to decrease carbon emissions [52]. CLSC emissions should be traded through a cap-and-trade mechanism [53]. The SC regulates waste and CO2 emissions through an eco-friendly cap-and-trade system [54].
Impact analysis of cap-and-trade regulations on SCs Regulatory authorities set a carbon cap for businesses. Maintaining a high penalty and paying for overages is an effective way to accomplish carbon emission goals. As a means of preventing growth in the economy from being impeded, implementing a carbon tax should be the main barrier. Despite appearing in scholarly journals, the strategy is rarely followed in practice [55].
According to refs. Marufuzzaman et al. and Choudhary et al. [16,30] offered that the policy is compared with others frequently. A carbon cap cannot be simply chosen due to the uncertainty of the future, although it is most likely based on existing or past emissions. The US Clean Air Act of 1970 established state and federal carbon limitations [56]. Every other study discusses at least one more source of emissions. According to Palak et al. [57], inventory levels, weights, and traveled distances are included when calculating purchasing and transportation costs. Rarely is the carbon cap determined using actual data.
The US Environmental Protection Agency (2013) [58], was acknowledged by Peng et al. as the source of pollutant indicators [17]. Xu et al. [59] studied a cap-and-trade rule for hybrid and specialized CLSCs. SCs containing two distinct polymeric products have a limit between 15,000 and 19,500. The utilization of sewage sludge biomass SCs was considered [60].
According to Rezaee et al., the stochastic model of an Australian furniture industry that has extended to five states is also employed [61]. In a policy-free SCN, a presumptive automotive products corporation’s emissions will be capped at 95, 90, 80, 70, 60, and 50% [30]. In a global cap, the global cap is divided equitably among the facilities. Mart et al. [33] utilized clothing industry data. They explored a carbon footprint cap for the whole SC as well as a cap on the number of units sold. Each fabric manufacturer is granted a different emission cap for each period, ranging from 2200 to 2350 and 2090 to 2430 t CO2 [62].
Choudhary et al. [30] designates 600 t CO2 and 700 t CO2 as distinct limitations for the forward and reverse sections of the SC, respectively. Warehousing emissions were calculated using emissions intensity, demand function mean value, reorder point, order quantity, and total lead time [20]. According to Kannegiesser and Günther [63], emission limits should be based on a percentage of the level of emissions at the outset. It is not unusual for firms to place internal limits on SCs. The complexity of a single SC necessitates the use of a limit. Centralized enforcement is still possible, for instance by a parent corporation or government body. Transport, assembly, and supplier emissions for an international computer company’s facility were capped to reduce carbon-based transit, assembly, and supplier emissions [27].
Carbon footprints are used to quantify emissions per unit. In their analysis, Baud-Lavigne et al. also included the emissions associated with component selection, production, and transportation [64]. In reverse SCs, recycling, disposal, and collection are also covered. In addition, the corporation might implement a carbon cap to address the situation. Several studies, including Choudhary et al. and Mohammed et al. [30,65], have demonstrated that product recovery, collection, and disposal facilities reduce greenhouse gas emissions. According to Fareeduddin et al., recycling activities contribute to greenhouse gas emissions.
As anticipated, stricter carbon limitations have negative consequences for the SC [31]. According to Choudhary et al. [30], a stringent carbon cap results in lower emissions and higher prices than carbon taxes or cap-and-trade. Several other scholars have made comparable observations.
The cost curve gets concave and falls as the cap is lifted [29,41,61,63,65]. By [16,41], report a step-function relationship between cost and emissions. The conversion to low-emissions technology and greener transport techniques resulted in a low-cost increase due to the SC’s redesigned efficiency. A stringent cap can alter the structure of a SC, regardless of whether it is forward or reverse.
This observation was validated by Xu et al. While carbon cap programs significantly cut emissions, their effects may not benefit all participants equally. It is crucial to impose a carbon cap at the highest level in a fair and equitable manner for all parties. In a global economy, a SC with diverse geographical criteria could drive countries to cut emissions [34,66]. To support light-emission technologies, Zhou et al. recommend reducing China’s cap to 76.2% of its basic level and Taiwan’s cap to 68.5% [27,57].
4. Cap-and-Trade
Important in a cap-and-trade system is mode selection [67]. Other carbon policies do not take income or offsets into consideration as explicitly as cap-and-trade rules. Shipping and production emissions are regulated and quantifiable. Each research paper on cap-and-trade comprises information on transportation [61,68,69,70]; extraction of raw materials [68,69,71,72], production [61,69,70], and distribution [69].
The consideration of emissions related to the supplier’s material and transportation, power consumption at plants, and power consumption at distribution centers [72]. Chaabane et al. & Rezaee et al. proposed a linear programming approach [61,70] by connecting CO2 emissions from items with their volumes. In a study conducted by He et al., a low-carbon product was designed for the life cycle of the product [73]. Kannan et al. develop a reverse logistics network design model [68] to decrease CO2 emissions from open facilities and transportation.
Cap-and-trade systems and carbon taxes can reduce emissions more efficiently. The carbon cap-and-trade model created by Wu et al. accounts for product inventory and routing considerations. The model can reduce carbon dioxide emissions and operational costs [74].
In addition to refs. [31,34,75,76], a number of other authors examine emissions using unit emission intensity. Cap-and-trade could be used to synchronize the SC with green technology [66]. The dual-channel SC requires coordination and determination in light of the cap-and-trade rule [77]. Emissions-based SCs have an impact on planning and policymaking in cap-and-trade systems [78].
The blockchain and SC operations are looked at in the context of cap-and-trade [79]. By regulating carbon emissions and collecting products in a CLSC, it is possible to achieve cap-and-trade reductions [49]. Cap-and-trade is used to analyze the influence of government subsidies to coordinate green marketing and green technology investment [80]. A SC with emission-dependent emissions is evaluated under a cap-and-trade framework [81].
Cap-and-trade rules can achieve two degrees of cooperation [1]. Different financing mechanisms and power structures have an effect on SCs under cap-and-trade regulations [48,55]. Carbon emission pricing and reduction in a dynamic SC utilizing cap-and-trade systems were researched [60]. Cap and trade regulate pricing and coordination techniques in dual-channel SCs [82].
Emissions were reduced in a cap-and-trade system by coordinating a system based on orders during SC [83]. In addition to impacting strategic decisions and collaborations, cap-and-trade policies have an impact on contract decisions and collaborations [84]. The make-to-order SC and cap-and-trade regulations [59] cause issues with production and price. Examine caps, trade mechanisms, and customer preferences for retailer-led SCs. SC members make differential game decisions to limit GHG emissions through cap-and-trade legislation [85].
According to Golpîra et al. [86], this will lead to a 15% reduction in emissions by the year 2020. If Ontario joins the Western Climate Initiative alongside California and Quebec [87], it can acquire additional credits if necessary while maintaining the collective cap. There is a linear link between emissions from manufacturing and transportation and production volume [13,61,88]. According to Abdullah et al. [71], the limit applies to the cost of raw materials, the delivery of products, and the consumption of electricity at plants and distribution hubs.
A two-echelon SSC coordination system under cap-and-trade regulation was designed by Xu et al. [89]. Choudhary et al. and Shaw et al. [30,90] have also analyzed the stationary emissions induced by open facilities. If releases are specified as flow functions, the carbon footprint may be estimated more readily.
Based on refs. [31,34,75,91], the emission severity per unit is computed. Furthermore, Abdallah et al. demonstrate how a single cap may result in variable credit prices [71]. [69,90] Using hypothetical parameters, Shaw et al. and Diabat et al. investigated the effects of SCN.
Giarola et al. [92] state that a cap-and-trade system maximizes profitability by limiting carbon emissions. Abdallah et al. [93] assert that carbon taxes greatly reduce emissions. These savings were accomplished by decentralizing and outsourcing the SC. According to Giarola et al. [92], the application of cap-and-trade in the maritime industry may cut emissions in a cost-effective manner. Similar to carbon caps, cap-and-trade pricing increases decrease SC costs.
According to Chaabane et al. [70], when the emission cap increases, the model favors cheaper alternatives with higher emissions. Thus, low-cost technologies with high emissions can be utilized, and fewer credits are required. Several studies [30,34,61,88] have demonstrated that carbon credit prices have a higher impact on SC configuration than the cap. As demonstrated by Chaabane et al. [88], a rise in the price of credit reduces recycling and credit purchases.
According to Diabat et al. [69], remanufacturing is an attractive option for carbon-intensive procurement activities. A model of biofuel SC under a carbon trading mechanism was suggested by Memari et al. [94].
As some businesses may choose not to invest in reverse logistics (RLs), authorities should provide a recovery credit to boost the incentive to create in the face of high carbon prices [28].
Abbasi et al. [95] have prioritized the development of sustainable recovery networks for COVID-19 outbreaks in recent years. During the pandemic, Abbasi et al. [96] recommended a SC to coordinate and make decisions regarding CO2 emissions. Abbasi et al. designed the GCLSCN during the COVID-19 focus on CO2 emissions [97].
In recent years, Wang, et al. [98] considered the formation of a low-carbon SC by dominant retailers and small and medium-sized manufacturers. Research on how production decisions are made, as well as how to repurchase carbon emission permits, is conducted when capital is limited [99].
In COVID-19, Abbasi et al. measured the performance of the SSC [100]. In 2023, Abbasi et al. developed the tri-Objective, SCLSC in COVID-19 [101]. They analyzed the decision-making process of manufacturers based on the repurchase strategy of carbon emission permits and capital constraints [102].
The position of the present research in relation to the previous research is shown in Table 1. The research papers in Table 1 have no carbon tax, carbon cap, cap-and-trade, and COVID-19 pandemic occurring simultaneously in the GCLSC.
Hammami et al. [37], modeled production inventories with lead time constraints to estimate carbon emissions. In their paper, Liu et al. [103] suggest that China’s special economic zones will come back a third time. A review of studies on COVID-19 epidemic estimation in Iran was presented by Pourmalek et al. [104].
Predicting COVID-19 incidence based on Google trends data in Iran: A data mining and deep learning study by Ayyoubzadeh et al. [105]. Technology-based policies for clean air were implemented by Gerard and his colleagues [106].
In a green supply chain under uncertainty, Entezaminia et al. [76], discussed robust aggregate production planning. As described by Xiao et al. [107], sewage sludge-derived biochar for resource recovery has been studied before, modified, and applied. An optimized inventory management system under controllable carbon emissions by Mishra et al. [108].
The early COVID-19 epidemic in Iran provides lessons for preparedness and causes for concern, according to Ghafari et al. [109]. A Cohort Study on the Clinical Profile, Risk Factors, and Outcomes of COVID-19 in Iran by Hatamabadi et al. [110].
Table 1. The position of the present research about the previous research.
| Author(s) | References | Year | Focused Carbon Tax | Focused Carbon Cap | Focused Cap-and-Trade | Focused COVID-19 |
|---|---|---|---|---|---|---|
| Waltho et al. | [111] | (2019) | * | * | * | |
| Zhang et al. | [42] | (2019) | * | |||
| Cadavid-Giraldo et al. | [44] | (2020) | * | * | ||
| Kuiti et al. | [84] | (2020) | * | |||
| Cao et al. | [20] | (2020) | * | |||
| Babagolzadeh et al. | [112] | (2020) | * | |||
| Bai et al. | [113] | (2020) | * | |||
| Zou et al. | [114] | (2020) | * | * | ||
| Kushwaha et al. | [46] | (2020) | * | |||
| Ghosh et al. | [50] | (2020,a) | * | |||
| Ghosh et al. | [51] | (2020,b) | * | |||
| Mishra et al. | [54] | (2020) | * | |||
| Tang & Yang | [55] | (2020) | * | |||
| Yang et al. | [67] | (2020) | * | |||
| Tong et al. | [85] | (2019) | * | |||
| Taleizadeh et al. | [82] | (2021) | * | |||
| Xu & Choi | [79] | (2021) | * | |||
| Li et al. | [80] | (2021) | * | |||
| Yang et al. | [53] | (2021) | * | |||
| Wang & Wu | [49] | (2021) | * | |||
| Lang et al. | [115] | (2021) | * | |||
| Liu et al. | [116] | (2021) | * | |||
| Zhang et al. | [117] | (2021) | * | |||
| Guo & Xi | [118] | (2022) | * | |||
| Meng et al. | [119] | (2022) | * | * | ||
| Zhu et al. | [120] | (2022) | * | |||
| Hu & Wang | [121] | (2022) | * | |||
| Zhang, Y. & Zhang, T. | [122] | (2022) | * | |||
| Paul et al. | [123] | (2022) | * | |||
| Shi & Liu | [124] | (2022) | * | |||
| Shen et al. | [125] | (2022) | * | * | ||
| Wu et al. | [74] | (2022) | * | |||
| Yu et al. | [126] | (2022) | * | |||
| Lyu et al. | [127] | (2022) | * | |||
| Cheng et al. | [21] | (2022) | * | * | ||
| Luo et al. | [102] | (2022) | * | |||
| Xu et al. | [22] | (2022) | * | |||
| Astanti et al. | [47] | (2022) | * | |||
| Wang et al. | [88] | (2022) | * | |||
| Chen et al. | [128] | (2022) | * | |||
| Wei & Huang | [129] | (2022) | * | |||
| Luo et al. | [130] | (2022) | * | |||
| Yi et al. | [131] | (2022) | * | |||
| This investigation | * | * | * | * |
This entry is adapted from the peer-reviewed paper 10.3390/su15043677
This entry is offline, you can click here to edit this entry!