Role of Metabolic Connectome in Complex Diseases: History
Please note this is an old version of this entry, which may differ significantly from the current revision.
Contributor: , , , , , , , ,

The interconnectivity of advanced biological systems is essential for their proper functioning. In modern connectomics, biological entities such as proteins, genes, RNA, DNA, and metabolites are often represented as nodes, while the physical, biochemical, or functional interactions between them are represented as edges. Among these entities, metabolites are particularly significant as they exhibit a closer relationship to an organism’s phenotype compared to genes or proteins. Moreover, the metabolome has the ability to amplify small proteomic and transcriptomic changes, even those from minor genomic changes. Metabolic networks, which consist of complex systems comprising hundreds of metabolites and their interactions, play a critical role in biological research by mediating energy conversion and chemical reactions within cells. 

  • metabolic connectome
  • network models
  • disease diagnosis
  • drug discovery

1. Introduction

Biological networks are widely used as graphical representations to describe and analyze biological systems. In these networks, graphs are used to represent biological entities, such as proteins, genes, RNA, DNA, and metabolites, as nodes. The edges of the network correspond to the physical, biochemical, or functional interactions between these entities [1]. Through analysis of these biological networks, the interrelationships between different biological entities can be revealed, including protein–protein, protein–DNA, protein–metabolite, and other associations. This allows the networks to capture the basic characteristics of biological systems and reveal the information patterns within them [2].
In order to deeply understand and quantify the characteristics and behaviors of biological networks, researchers utilize a series of evaluation indicators (Figure 1). Indicators such as node degree, clustering coefficient, average shortest path length, and centrality are widely used to measure the degree of node connection, community structure, global connectivity, and node importance in networks [3,4]. Small-world properties describe the global structure of networks [5]. Additionally, modularity identifies functional modules and subnetworks, providing comprehensive evaluation for deeper understanding of biological system structure and function [6,7,8].
Figure 1. Network properties. In this example, node ‘a’ has a degree of 3. Node ‘b’ has a clustering coefficient of 1, and node ‘c’ has a clustering coefficient of 0. The average shortest path length between nodes ‘d’ and ‘e’ is two steps, passing through one intermediate node. Node ‘f’ contributes significantly to the centrality because it has a relatively large number of edges connecting it to other nodes. The small-world properties are measured by calculating the clustering coefficient and the average shortest path length. Each module in the modularity is represented by a different color.
Currently, biological networks are classified based on different features and purposes. For example, protein–protein interaction networks describe protein interactions [9], gene regulatory networks reveal complex gene expression regulation mechanisms [10], and metabolic networks graphically represent metabolic processes [11]. Brain networks describe neuron and synapse interactions [12], while social networks represent social relationships between individuals [13]. Among these, metabolic networks have high plasticity and complexity as the basis of life activities and information transmission within organisms. They are complex network structures composed of interactions among multiple biological entities [11,14]. Metabolic networks are crucial in biological research to understand the complexity of biological systems and reveal interactions and regulatory relationships among different entities.

2. Construction Methods of Metabolic Networks

Metabolic networks can be represented by various types of relationships, including statistical correlations, causal relationships, biochemical reactions, and chemical structural similarities [14,15]. Statistical correlations and causal relationships are used to describe the relationships between molecules [16,17], while biochemical reactions and chemical structural similarities describe the interactions between molecules [18,19]. By constructing networks using these different relationship types, algorithms from network theory can be applied to metabolic networks to gain a more comprehensive understanding of metabolic processes [2]. The codes for constructing metabolic networks are provided in Table 1.
Table 1. Codes for metabolic networks.
Metabolic Network Method/Model Language Source
Correlation-based Pearson correlation And Spearman rank correlation Python https://github.com/aishapectyo/Correlations-Pearson-Spearman (accessed on 28 November 2023)
Distance correlation [20] Python https://github.com/vnmabus/dcor (accessed on 28 November 2023)
Gaussian graphical model R https://github.com/donaldRwilliams/BGGM (accessed on 28 November 2023)
Causal-based Causal inference model [21] Python https://github.com/BiomedSciAI/causallib (accessed on 28 November 2023)
Structural equation model R https://github.com/yrosseel/lavaan (accessed on 28 November 2023)
Dynamic causal model Python https://github.com/tmdemelo/pydcm (accessed on 28 November 2023)
Pathway-based Pathway Python https://github.com/iseekwonderful/PyPathway (accessed on 28 November 2023)
Chemical structure similarity-based Chemical structure similarity Python https://github.com/labsyspharm/lsp-cheminformatics (accessed on 28 November 2023)

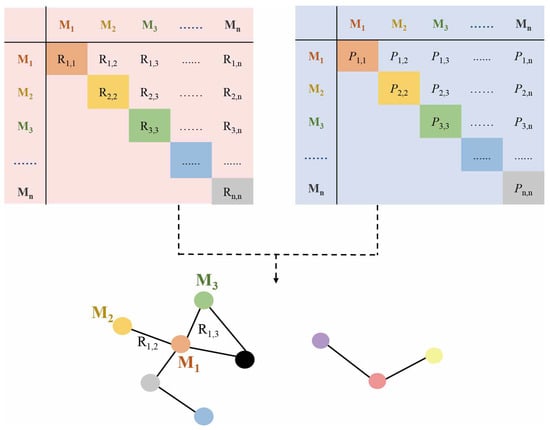
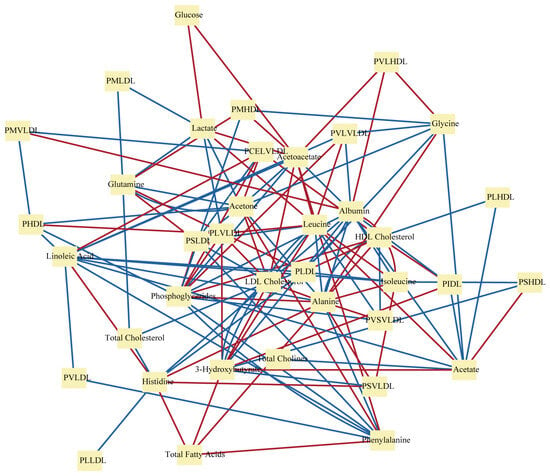
2.1. Correlation-Based Metabolic Network

Correlation-based metabolic networks are widely used in metabolic research. These networks use the correlations among metabolites to establish connectivity relationships, simplifying multidimensional data while preserving most interpretive information (Figure 2) [22]. This method reveals coordinated behaviors between biological components and allows an analysis of network properties to better understand metabolite interactions and identify key metabolites in pathways [23,24]. Furthermore, correlation-based networks can also be applied to study metabolic disease pathogenesis and discover new treatments [22,25].
Figure 2. Creating metabolic network based on correlation analysis. Correlation-based metabolic networks use correlations among metabolites to establish connectivity relationships and simplify multidimensional data. R: correlation value; P: p-value; M: metabolite.
In a correlation network, the correlation value ranges from −1 to 1, with 1 representing a positive correlation, −1 representing a negative correlation, and 0 representing no linear correlation. The closer the correlation coefficient is to −1 or 1, the stronger the correlation, while values closer to 0 indicate a weak or no linear relationship. If the correlation value of two metabolites reaches a set threshold, a connection is established between them [26]. Methods to calculate metabolite correlations include Pearson correlation, Spearman rank correlation, distance correlation, and Gaussian graphical models [27,28,29]. Pearson correlation measures linear relationships, while Spearman rank and distance correlations assess monotonic relationships [27,29,30]. The Pearson correlation coefficients are obtained by calculating the covariance between variables divided by their standard deviations. The Spearman rank correlation coefficient sorts the values of the variables, then calculates the rank difference after sorting, and obtains it by dividing the covariance of the rank difference by the standard deviation. The distance correlation is obtained by calculating the distance covariance among variables divided by their respective standard deviations. 
However, due to the stringent metabolic control and extended reaction sequences present in metabolic networks, the use of Pearson correlation and Spearman rank correlation often results in highly interconnected and dense networks, complicating network analysis and interpretation [14]. Gaussian graphical models calculate partial instead of total correlations, correcting indirect effects to better reveal correlations in complex metabolism [31,32]. Importantly, observed correlations may be due to common influencing factors and do not necessarily represent direct causal relationships.

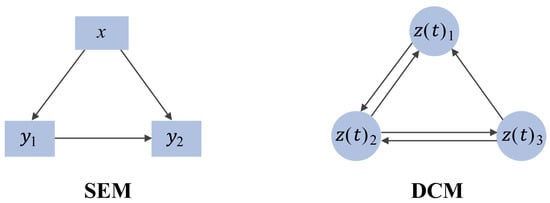
2.2. Causal-Based Metabolic Network

Causal relationship-based metabolic networks are complex biological networks that help us to understand the operating mechanisms of biological systems by revealing the interactions and effects between metabolites. Causal networks are graph models representing causal relationships, comprising variables and the causal relationships between them. The objective in constructing a causal network is to infer causal relationships between variables from observational data to better understand and predict system behavior [33,34]. The network consists of nodes, representing variables like genes, metabolites, and biological processes, and edges, representing causal relationships between variables that can be direct or indirect. A key feature of causal networks is discoverability, making them suitable for processing large-scale data with a limited understanding of interconnectivity [15].
Statistical methods using causal inference and discovery techniques are widely used in constructing causal networks to detect causal relationships between variables [35]. The causal inference model is a statistical framework used to infer causal relationships through observational data. This model applies statistical and causal inference principles, analyzing correlation, causal direction, and mechanisms to infer causal relationships [36].
In addition, structural equation modeling (SEM) and dynamic causal modeling (DCM) are also methods for causal inference (Figure 3) [35,39,40]. SEM is a multivariate statistical model that infers causal relationships among variables by modeling the relationship between observed variables and latent constructs, based on the covariance or correlation coefficient matrix [39,41]. Variables are manifest or latent. Manifest variables are directly measurable, while latent are indirect [42,43]. SEM can analyze direct and indirect effects among multiple variables, as well as relationships between variables and latent constructs [44,45].
Figure 3. Structural equation model (SEM) and dynamic causal model (DCM). Among them, 𝑥 represents the independent variable, 𝑦 represents the dependent variables, and 𝑧(𝑡) represents the concentration of metabolites at time t.

2.3. Pathway-Based Metabolic Network

Pathway-based metabolic networks describe the interactions between biochemical reactions. These enzymatic reactions form the foundation of metabolic reactions within organisms, facilitating the synthesis, decomposition, and transformation of metabolites. Metabolites, including proteins, nucleic acids, sugars, lipids, and more, are chemical substances present within an organism. The complex metabolic network is formed by the biochemical reactions between these metabolites, interacting to maintain normal life functions (Figure 4) [47]. To better understand and utilize metabolic networks, it is necessary to select appropriate databases for data, prune networks for analysis, use algorithms to identify pathways, and develop computational methods to optimize pathways.
Figure 4. The metabolic network linking metabolic pathways and metabolites. Among them, blue represents negative correlation, and red represents positive correlation.
In designing metabolic pathways, database representation methods are used to describe the relationships between chemical reactions and metabolites. The two common methods are graph and stoichiometric matrix representations. Graph representations show topological connectivity using nodes for metabolites and edges for reactions. This visual representation intuitively displays topological and pathway structure, aiding understanding and analyzing pathway composition and function. Common graph-based databases include KEGG [48] and MetaCyc [49]. Stoichiometric matrices numerically describe quantitative stoichiometries between reactions and metabolites in rows and columns. This provides comprehensive quantitative information about their design, including reaction directionality, rates, and metabolite proportions. Common matrix-based databases include BiGG [50] and ModelSEED [51].
Network pruning is a commonly used technique to simplify complex metabolic networks during pathway design. This technique reduces complexity by removing irrelevant reactions or metabolites, thereby improving computational efficiency and design accuracy [52]. The goal is to remove components that do not significantly impact overall pathway performance, reducing computational and optimization complexity.

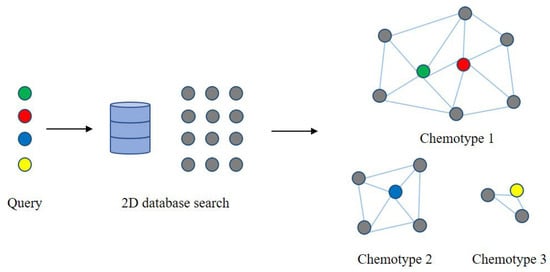
2.4. Metabolic Network Based on Chemical Structure Similarity

Chemical structural similarity is a method of comparing and matching chemical molecules based on their structural characteristics. By comparing the structural features among compounds, the degree of similarity between them can be measured [57]. Metabolites with high similarity are often linked together, indicating that they may participate in similar metabolic reactions or pathways. The chemical and structural similarities among metabolites can then be converted into edges in the network to construct a metabolic network that reflects these similarity relationships (Figure 5) [58]. This network can reveal collections of metabolites with similar chemical structures, elucidating their functions and interactions in metabolic pathways.
Figure 5. Chemical similarity networks. The reference compounds are identified from the bioactivity database using 2D similarity fingerprints of the query ligands. Then, the identified compounds are further clustered into chemical similarity subnetworks based on representative chemotypes. Among them, the colored nodes represent query ligands, and the gray nodes represent reference compounds.
Chemical structure descriptors play a key role in constructing metabolic networks. Chemical structure descriptors are numerical representation methods used to describe the structural characteristics of compounds [59]. Commonly used chemical structure descriptors include 2D and 3D chemical fingerprints [60]. Two-dimensional chemical fingerprints are feature vectors generated based on the 2D structural information of compounds, incorporating characteristics of compound connectivity, atomic type, and ring structure. These can be used to calculate the similarity among compounds and screen chemical libraries [61]. The Tanimoto index calculates shared features between 2D fingerprints to quantify similarity on a 0 to 1 scale, where values nearer 1 indicate higher similarity [61,62].
Three-dimensional chemical fingerprints are feature vectors generated based on the three-dimensional structural information of compounds, taking into account conformations, shape, charge distribution, and other 3D characteristics By calculating the 3D chemical fingerprint similarities among compounds, their structural similarity can be evaluated [63]. Euclidean distance evaluates the differences between 3D fingerprint vectors and is used to assess structural similarity, where less distance means more similarity [64].

3. Application of Metabolic Network

Metabolites are more closely related to an organism’s phenotype than genes and proteins. Moreover, the metabolome serves to amplify potentially immeasurably small changes in the proteome and transcriptome, even those derived from minor changes in the genome. The health and disease states of the body can be more meaningfully characterized by the metabolic state of the human cells, tissues, organs, and the organism as a whole [68]. Abnormal metabolism either causes or results from complex diseases like hypertension, diabetes, cancer, and heart disease. Thus, adequately understanding human metabolism and metabolic interactions is a necessary step towards efficiently treating and diagnosing these complex diseases. However, metabolism involves countless individual reactions that are highly interconnected through shared metabolites [69]. Developing and applying metabolic networks plays a significant role in medical research, especially in elucidating disease pathogenesis, prediction, diagnosis, and drug discovery.
A metabolic network is a complex system of hundreds of metabolites and their interactions involved in energy conversion and chemical reactions within cells [70]. Exploring the function and structure of metabolic networks can provide insight into metabolic abnormalities and signaling transduction disorders in disease, and further revealing the strong link between disease and metabolism [71]. Systems biology and computational biology approaches are used to construct and model metabolic networks in analyzing them [72,73]. This elucidates pathway and interaction complexity, regulatory mechanisms between metabolites, and the rapid spread of single-node perturbations across the tightly regulated, simultaneous network [74,75].

3.1. Metabolic Networks in Disease Mechanisms

Firstly, a strategy to compare metabolic networks in disease states and normal states followed by identifying changes in disease-related metabolic pathways is an essential way for discovering and confirming disease-specific metabolic abnormalities. These changes may include the depletion or accumulation of metabolites, alterations in enzyme activity, and the remodeling of metabolic pathways. Gaining a deeper understanding of these abnormalities can shed light on the pathogenesis of the disease.
Metabolic networks represent cellular metabolism through lists of reactions occurring in cells [79]. These reactions have been associated with particular cellular compartments and further grouped into pathways. Certain metabolic pathways may play crucial roles in particular diseases or physiological states, and regulating metabolic pathways is essential for maintaining normal physiological states [80]. Metabolic networks integrate metabolomics and pathway databases. Network topology and metabolite flow analysis identify pathways and regulation implicated in pathogenesis, such as abnormal glycolytic pathways in tumor cells [81,82]. 
Moreover, metabolites can be passed between compartments (e.g., mitochondria or cytoplasm) through transport reactions, thereby acting as signaling molecules involved in regulating pathological and physiological processes in cells [83]. The close interaction between metabolic networks and signal transduction networks can help reveal how metabolic abnormalities affect signal transduction and further understand the pathogenesis of diseases [84].
Metabolic network analysis also provides a considerable tool for personalized medicine. By integrating clinical, genomic, and network data, one can predict drug responses and guide individualized treatment. This improves effectiveness and reduces side effects. Type 2 diabetes mellitus (T2DM) is recognized as one of the main threats to human health in the 21st century, emerging as a complex metabolic disease [85,86,87].
The establishment and simulation of a metabolic network model can be beneficial to understand the pathogenesis of diseases. Multi-omics data integration has built dynamic models simulating pathway and metabolite changes in disease [91]. These models may predict disease progression, assess therapeutic efficacy, and further inform drug development. 

3.2. Metabolic Networks in Disease Prediction and Diagnosis

Metabolic networks have great potential in disease prediction and diagnosis. Metabolic network analysis can identify changes in metabolite concentrations, metabolic pathways, or metabolic enzymes that are associated with specific diseases. Biomarkers refer to biochemical indicators, which can signify possible changes in the function or structure of cells, tissues, organs, and systems. They are discriminant features related to the onset and progression of disease [99]. Metabolites have long been used as biomarkers in blood or urine to diagnose disease. Metabolic biomarkers refer to metabolites or combinations of metabolites associated with a particular disease. By comparing the metabolic profiles of diseased and healthy groups, metabolite pairs that change during disease onset and progression can be identified. These can elucidate pathogenesis and serve as early diagnosis biomarkers or for evaluating treatment efficacy [100].
Chang et al. [99] constructed sex-specific and apolipoprotein E (APOE)-specific metabolic networks. They proposed patient-specific biomarkers predictive of disease state and significantly associated with cognitive function. Based on computational network modeling, they integrated cognitive assessments and metabolomic profiling to confirm targeted precision therapeutics for Alzheimer’s disease (AD) patient subgroups. Recently, a bi-random walks method predicted disease–metabolite associations by executing the algorithm on reconstructed networks [101].
Furthermore, metabolic network analysis can predict disease progression. By analyzing dynamic changes in metabolic network models, researchers can simulate disease progression and predict the progression rate and possible outcomes [102]. This elucidates disease occurrence mechanisms and provides important guidance for disease treatment and intervention.
Metabolic network analysis plays an important role in cancer research. Tumors reprogram biochemical pathways to promote unregulated cell growth and survival [103]. Metabolic network facilitates the discovery of specific metabolic dependencies that arise in cancers [104]. The complex interrelationships between oncogenes, gene expression, and metabolism offer the potential to discover novel biomarkers and drug targets with therapeutic and prognostic value.

3.3. Drug Discovery and Disease Treatment

In addition, metabolic network analysis has become an invaluable tool for drug discovery and development. Studying metabolic networks allows researchers to predict a drug’s mechanism of action and metabolic fate [111]. Advances in systems biology enable the prediction of functional effects of system perturbations using large-scale network models. The topological features of metabolic networks confer flexibility and robustness to complex biosystems. And in general, they may explain why many drug candidates are ineffective and why unexpected severe side effects happen [112]. Understanding these network properties is essential for rational drug design to improve efficacy and reduce adverse effects. Metabolic network models have been applied to simulate drug treatment and predict side effects.
Another advantage of metabolic network analysis is the ability to narrow down putative drug targets for in vitro validation, reducing reliance on expensive and time-consuming experimental approaches [115]. By analyzing crucial nodes and regulatory pathways in metabolic networks, key molecules in disease processes can be identified as potential therapeutic targets or lead compounds. These may include important metabolic regulators, bottleneck enzymes, and transporters, or disease-associated metabolites. Recent years, modeling cancer metabolism has been widely used in metabolic networks [96]. Tissue-specific and generic models have allowed prediction of drug targets in cancers [116,117]. Comparing healthy metabolic networks and cancer networks reveal cancer-specific features which could be potential pan-cancer targets [76]. 

4. Conclusions

In summary, further advancement in metabolic network analysis will require a multifaceted research effort. As technology continues to progress and in-depth studies elucidate the complexities of metabolic systems, metabolic network models can be expected to improve dramatically. Ongoing refinements in areas such as individualized network construction, the integration of diverse omics data, and the elucidation of shared network dysregulation among diseases will ultimately enhance the utility of metabolic networks across a wide range of biomedical applications. The future is promising for metabolic network analysis to fulfill its potential in accelerating disease prediction, diagnosis, prognosis, and precise treatment.

This entry is adapted from the peer-reviewed paper 10.3390/metabo14020093

This entry is offline, you can click here to edit this entry!
Video Production Service