Your browser does not fully support modern features. Please upgrade for a smoother experience.
Please note this is an old version of this entry, which may differ significantly from the current revision.
Mycotoxins are toxic substances produced as secondary fungal metabolites that can cause harmful effects on humans and animals. These compounds considerably affect the food industry and public health. The occurrence and levels of many mycotoxins have been studied in the overall food system, in which such toxins are more notable in the most nutritious and largely consumed foods like cereals and nuts.
- mycotoxins
- occurrence
- food
- cereals
- nuts
- persistence
1. Introduction
More than 300 types of toxic fungal metabolites have been identified, although the most relevant and known mycotoxins include the aflatoxins (AFs) (AFB1, AFB2, AFG1, AFG2), deoxynivalenol (DON), zearalenone (ZEN), ochratoxin (OTA), and fumonisins (FBs) (FB1, FB2, FB3, among others), which are highly stable metabolites that can resist food processing [1] and therefore remain in the final products. Consequently, various strategic pre-processing methods are adopted to reduce mycotoxins in the food chain [2]. Due to their remarkable toxicity and associated health risks, the threshold levels for mycotoxins have been regulated worldwide [1][3][4]. Numerous diagnostic tools are used to discriminate fungi by their genetic details and volatile signatures and determine mycotoxins in foodstuffs [5][6], but the issues and gaps regarding mycotoxins’ persistence in the food chain remain unnoticed.
2. Mycotoxin Occurrence
The occurrence and contamination of fungi are major issues in the overall food system. A plethora of fungi occur and produce several toxins in the food and feed produced worldwide [7][8][9][10]. These toxins transfer to humans directly via the ingestion of plant-based foods of any category, as well as animal-derived food products. In the latter case, whenever animals are fed with a diet potentially contaminated with toxins, the animals biochemically transform these toxins or distribute the unmetabolized forms in various edible tissues, which can be found in their derived milk, meat, liver, heart, and eggs [11][12][13][14]. The consumption of mycotoxin-contaminated foods presents significant health risks in humans, considering the carcinogenic, immune-suppressive, estrogenic, and organ-target acute effects of these toxins [10][14].
The occurrence levels of several mycotoxins in a range of foodstuffs recently reported in some countries are displayed in Table 1. Mycotoxins occur in multiple food and feed items at varied levels, in which cereal grains and nuts are prominent. The origin of the products is diverse, where the data show that a high frequency and level of these toxins can occur regardless of the geographical location [15][16][17]. The products shown are associated with cereals (wheat, corn, oat), nuts (peanuts, hazelnuts), animal-derived products (milk, meat, eggs), mixed food, and others, e.g., cocoa and soybean meal (Table 1). These products (N = 5146) have often been analyzed by high-performance liquid chromatography (HPLC) and mass spectrometry (MS), and a predominant number (n = 4351) of the products mainly relate to cereals. This corroborates data presented in previous studies, where cereals with a widespread consumption were widely examined for mycotoxins [15][18]. In search for mycotoxins, around 28 different metabolites comprising their (less or un)familiar, emerging, and conjugated forms were evaluated, in which several have properly regulated and estimated tolerable limits, with toxicity details for the specific ingredient of interest as [19][20][21][22][23][24][25].
Table 1. Mycotoxin occurrence and levels in diverse foodstuffs recently reported in some countries.
| Country/ Sampling Year |
Type of Sample (N) | Mycotoxin | Positive Samples n (%) |
Mean (Min–Max) µg/kg |
Ref. |
|---|---|---|---|---|---|
| Nigeria | |||||
| 2018–2021 | Cereal-based infant food (63) | 3-NPA | 5 (7.9) | 4.43 (1.24–7.01) | [26] |
| AFB1 | 8 (12.7) | 2.71 (0.36–14.4) | |||
| AFB2 | 3 (4.8) | 0.42 (0.11–0.98) | |||
| AFG1 | 1 (1.6) | 0.62 (0.62–0.62) | |||
| AFs | 8 (12.7) | 2.95 (0.36–15.4) | |||
| AFM1 | 1 (1.6) | 0.57 (<LOD–0.57) | |||
| ALS | 16 (25.4) | 2.85 (1.12–5.97) | |||
| AME | 11 (17.5) | 1.49 (0.26–6.58) | |||
| ALT | 6 (9.5) | 4.71 (1.8–17.1) | |||
| BEA | 44 (69.8) | 0.29 (0.04–1.64) | |||
| Cereulide | 5 (7.9) | 1.07 (0.3–2.34) | |||
| CIT | 14 (22.2) | 106 (5.16–787) | |||
| DON | 4 (6.3) | 39.4 (3.14–110) | |||
| DHC | 7 (11.1) | 18.1 (1.88–54.5) | |||
| EnnA | 3 (4.8) | 0.24 (0.09–0.41) | |||
| EnnA1 | 7 (11.1) | 0.47 (0.1–1.62) | |||
| EnnB | 23 (36.5) | 0.91 (0.02–8.14) | |||
| EnnB1 | 17 (27) | 0.5 (0.06–2.61) | |||
| FB1 | 15 (23.8) | 35.1 (3.99–66.2) | |||
| FB2 | 13 (20.6) | 15.9 (3.54–34.9) | |||
| FB3 | 6 (9.5) | 9.62 (<LOD–9.62) | |||
| FBs | 15 (23.8) | 52.7 (3.99–98.1) | |||
| MON | 6 (9.5) | 3.14 (2.53–6.19) | |||
| OTA | 2 (3.2) | 0.76 (<LOD–0.76) | |||
| ST | 8 (12.7) | 0.29 (0.13–0.96) | |||
| TEN | 4 (6.3) | 1.63 (0.96–2.99) | |||
| ZEN | 10 (15.9) | 1 (0.32–3.22) | |||
| Mixed cereal- and nut-based foods (13) | 3-NPA | 5 (38.5) | 10.1 (4.28–28.2) | ||
| AFB1 | 7 (53.8) | 5.27 (0.36–14.3) | |||
| AFB2 | 4 (30.8) | 1.84 (0.33–3.02) | |||
| AFG1 | 3 (23.1) | 0.48 (0.27–0.89) | |||
| AFs | 7 (53.8) | 6.53 (0.36–17.4) | |||
| AFM1 | 3 (23.1) | 0.56 (0.51–0.66) | |||
| ALS | 7 (53.8) | 1.62 (1.19–3.42) | |||
| AME | 1 (7.7) | 0.26 (<LOD–0.26) | |||
| ALT | 1 (7.7) | 1.8 (<LOD–1.8) | |||
| BEA | 13 (100) | 0.3 (0.04–0.76) | |||
| CIT | 9 (69.2) | 20.1 (6.81–50.2) | |||
| DON | 0 | 0 | |||
| DHC | 4 (30.8) | 20.3 (1.88–38.2) | |||
| EnnA | 0 | 0 | |||
| EnnA1 | 2 (15.4) | 0.26 (0.1–0.43) | |||
| EnnB | 5 (38.5) | 0.46 (0.06–1.13) | |||
| EnnB1 | 3 (23.1) | 0.3 (0.06–0.51) | |||
| FB1 | 9 (69.2) | 27.2 (14.3–60.3) | |||
| FB2 | 9 (69.2) | 6.7 (3.54–15.3) | |||
| FB3 | 1 (7.7) | 9.62 (<LOD–9.62) | |||
| FBs | 10 (76.9) | 31.5 (10.6–85.2) | |||
| MON | 8 (61.5) | 6.72 (2.53–28.6) | |||
| OTA | 1 (7.7) | 2.65 (<LOD–2.65) | |||
| ST | 2 (15.4) | 0.85 (0.73–0.97) | |||
| TEN | 1 (7.7) | 0.4 (<LOD–0.4) | |||
| ZEN | 1 (7.7) | 0.8 (0.8–0.8) | |||
| Chile | |||||
| 2018–2020 | Cocoa (22) | AFs | 0 | ND | [27] |
| OTA | 7 (31.8) | N.I. (ND–4.77) | |||
| Oat (50) | AFs | 0 | ND | ||
| OTA | 1 (2) | N.I. (ND–1.74) | |||
| Cereals (60) | AFs | 0 | ND | ||
| OTA | 1 (1.6) | N.I. (ND–2.51) | |||
| Peanuts (35) | AFs | 0 | ND | ||
| OTA | 0 | ND | |||
| Hazelnut (7) | AFs | 0 | ND | ||
| OTA | 0 | ND | |||
| 2022 | Milk formula (24) | AFM1 | 15 (62.5) | 0.0038 (0.006–0.0117) | [28] |
| Fluid milk (26) | AFM1 | 6 (23.1) | 0.0069 (0.0063–0.0075) | ||
| Chicken meat (115) | AFs | 40 (34.8) | 2.4 (<LOD–8.01) | [13] | |
| OTA | 47 (40.9) | 1.14 (<LOD–4.7) | |||
| ZEN | 60 (52,2) | 2.01 (<LOD–5.01) | |||
| Eggs (80) | AFs | 22 (27.5) | 1.97 (<LOD–4.46) | ||
| OTA | 28 (35) | 1.17 (<LOD–2.98) | |||
| ZEN | 26 (32.5) | 1.58 (<LOD–3.6) | |||
| China | |||||
| 2017–2021 | Corn as feed (2873) | AFs | 474 (16.5) | 63.28 (N.I.–773) | [12] |
| TTB | 2513 (87.47) | 871.28 (N.I.–12,808) | |||
| FBs | 2343 (81.55) | 2618.81 (N.I.–40,090) | |||
| ZEN | 1479 (51.51) | 176.79 (N.I.–4686) | |||
| Wheat (411) | AFs | 5 (1.22) | 2.6 (N.I.–5) | ||
| TTB | 290 (70.56) | 2129.29 (N.I.–59,325) | |||
| FBs | 88 (21.41) | 332.31 (N.I.–910) | |||
| ZEN | 192 (48.18) | 105.5 (N.I.–1205) | |||
| Soybean meal (257) | AFs | 20 (7.78) | 4.65 (N.I.–35) | ||
| TTB | 38 (14.79) | 171.5 (N.I.–597) | |||
| FBs | 17 (6.61) | 760.24 (N.I.–6932) | |||
| ZEN | 102 (39.69) | 45.26 (N.I.–237) | |||
| Peanut meal (69) | AFs | 69 (100) | 417.72 (N.I.–10,091) | ||
| TTB | 3 (4.35) | 77.67 (N.I.–139) | |||
| FBs | 5 (7.25) | 50.4 (N.I.–120) | |||
| ZEN | 3 (4.35) | 37.33 (N.I.–61) | |||
| Oat grass (124) | AFs | 0 (0) | - | ||
| TTB | 66 (53.23) | 1,728.85 (N.I.–9363) | |||
| FBs | 48 (38.68) | 381.76 (N.I.–1986) | |||
| ZEN | 45 (36.29) | 484.53 (N.I.–2622) | |||
| Serbia | |||||
| 2018 | Corn (100) | AFs | 8 (8) | 3.6 (0.8–8.3) | [29] |
| 2019 | Corn (100) | AFs | 11 (11) | 3 (0.6–10.9) | |
| 2020 | Corn (100) | AFs | 5 (5) | 2.1 (1.1–3.0) | |
| 2021 | Corn (100) | AFs | 84 (84) | 38.8 (0.5–246.3) | |
| Croatia | |||||
| 2018 | Corn (110) | AFs | 15 (13.6) | 6.2 (1.6–75.1) | |
| 2019 | Corn (109) | AFs | 17 (15.6) | 2.5 (1.5–26.9) | |
| 2020 | Corn (103) | AFs | 20 (19.4) | 1.6 (1.5–3.3) | |
| 2021 | Corn (111) | AFs | 44 (39.6) | 34.1 (1.5–422.2) | |
| Island of São Miguel (Portugal) | |||||
| 2020 | Dairy milk (22) | ZEN | 22 (100) | 3.53 (1.23–>4.46) | [30] |
| Dairy milk (10) | ZEN | 10 (100) | 1.15 (0.48–2.15) | ||
| Dairy milk (27) | ZEN | 26 (96.3) | 0.48 (<LOD–1.37) | ||
| Dairy milk (25) | ZEN | 25 (100) | 1.15 (0.31–2.43) |
ND, not detected; N.I., not informed; LOD, limit of detection; 3-NPA, 3-nitropropionic acid; AFB1, aflatoxin B1; AFG1, aflatoxin G1; AFs, aflatoxins; AFM1, aflatoxin M1; ALS, altenuisol; AME, alternariol monomethyl ether; ALT, altersetin; CIT, citrinin; DON, deoxynivalenol; DHC, dihydrocitrinone; EnnA, enniatin A; EnnA1, enniatin A1; EnnB, enniatin B; EnnB1, enniatin B1; FBs, fumonisins; FB1, fumonisin B1; FB2, fumonisin B2; FB3, fumonisin B3; MON, moniliformin; OTA, ochratoxin A; ST, sterigmastocystin; TEN, tentoxin; TTB, trichothecene type B; ZEN, zearalenone.
Regarding the overall samples evaluated in studies conducted between 2017 and 2022 and detailed in Table 1, higher contamination rates were observed for trichothecene type B (TTB) toxins (58.53%), FBs (51.19%), ZEN (40.25%), and AFs (17%), as depicted in Figure 1. Importantly, trichothecene type B includes DON as a major toxin, and FBs were more notable in cereal products, while ZEN was more likely mainly in animal products (chicken and dairy) when compared with its low level in other items. Relevant to the sample positivity for the occurrence of one or more toxins, TTB appeared in 87.47% of the corn-based feed, 70.56% of the wheat as food, and 53.10% of oat grass. Mixed products associated with cereals and nuts, as well as corn, exhibited the highest percentage of contamination by FBs (77.35–81.55%). For ZEN, samples that exhibited high positivity were from dairy milk (99%), chicken meat (52.17%), and corn feed (51.48%). Concerning the contamination by AFs, all peanut meal (100%), 62.5% of milk formula, and 54.29% of mixed cereal- or nut-based foods showed positivity for AFs (Figure 1).
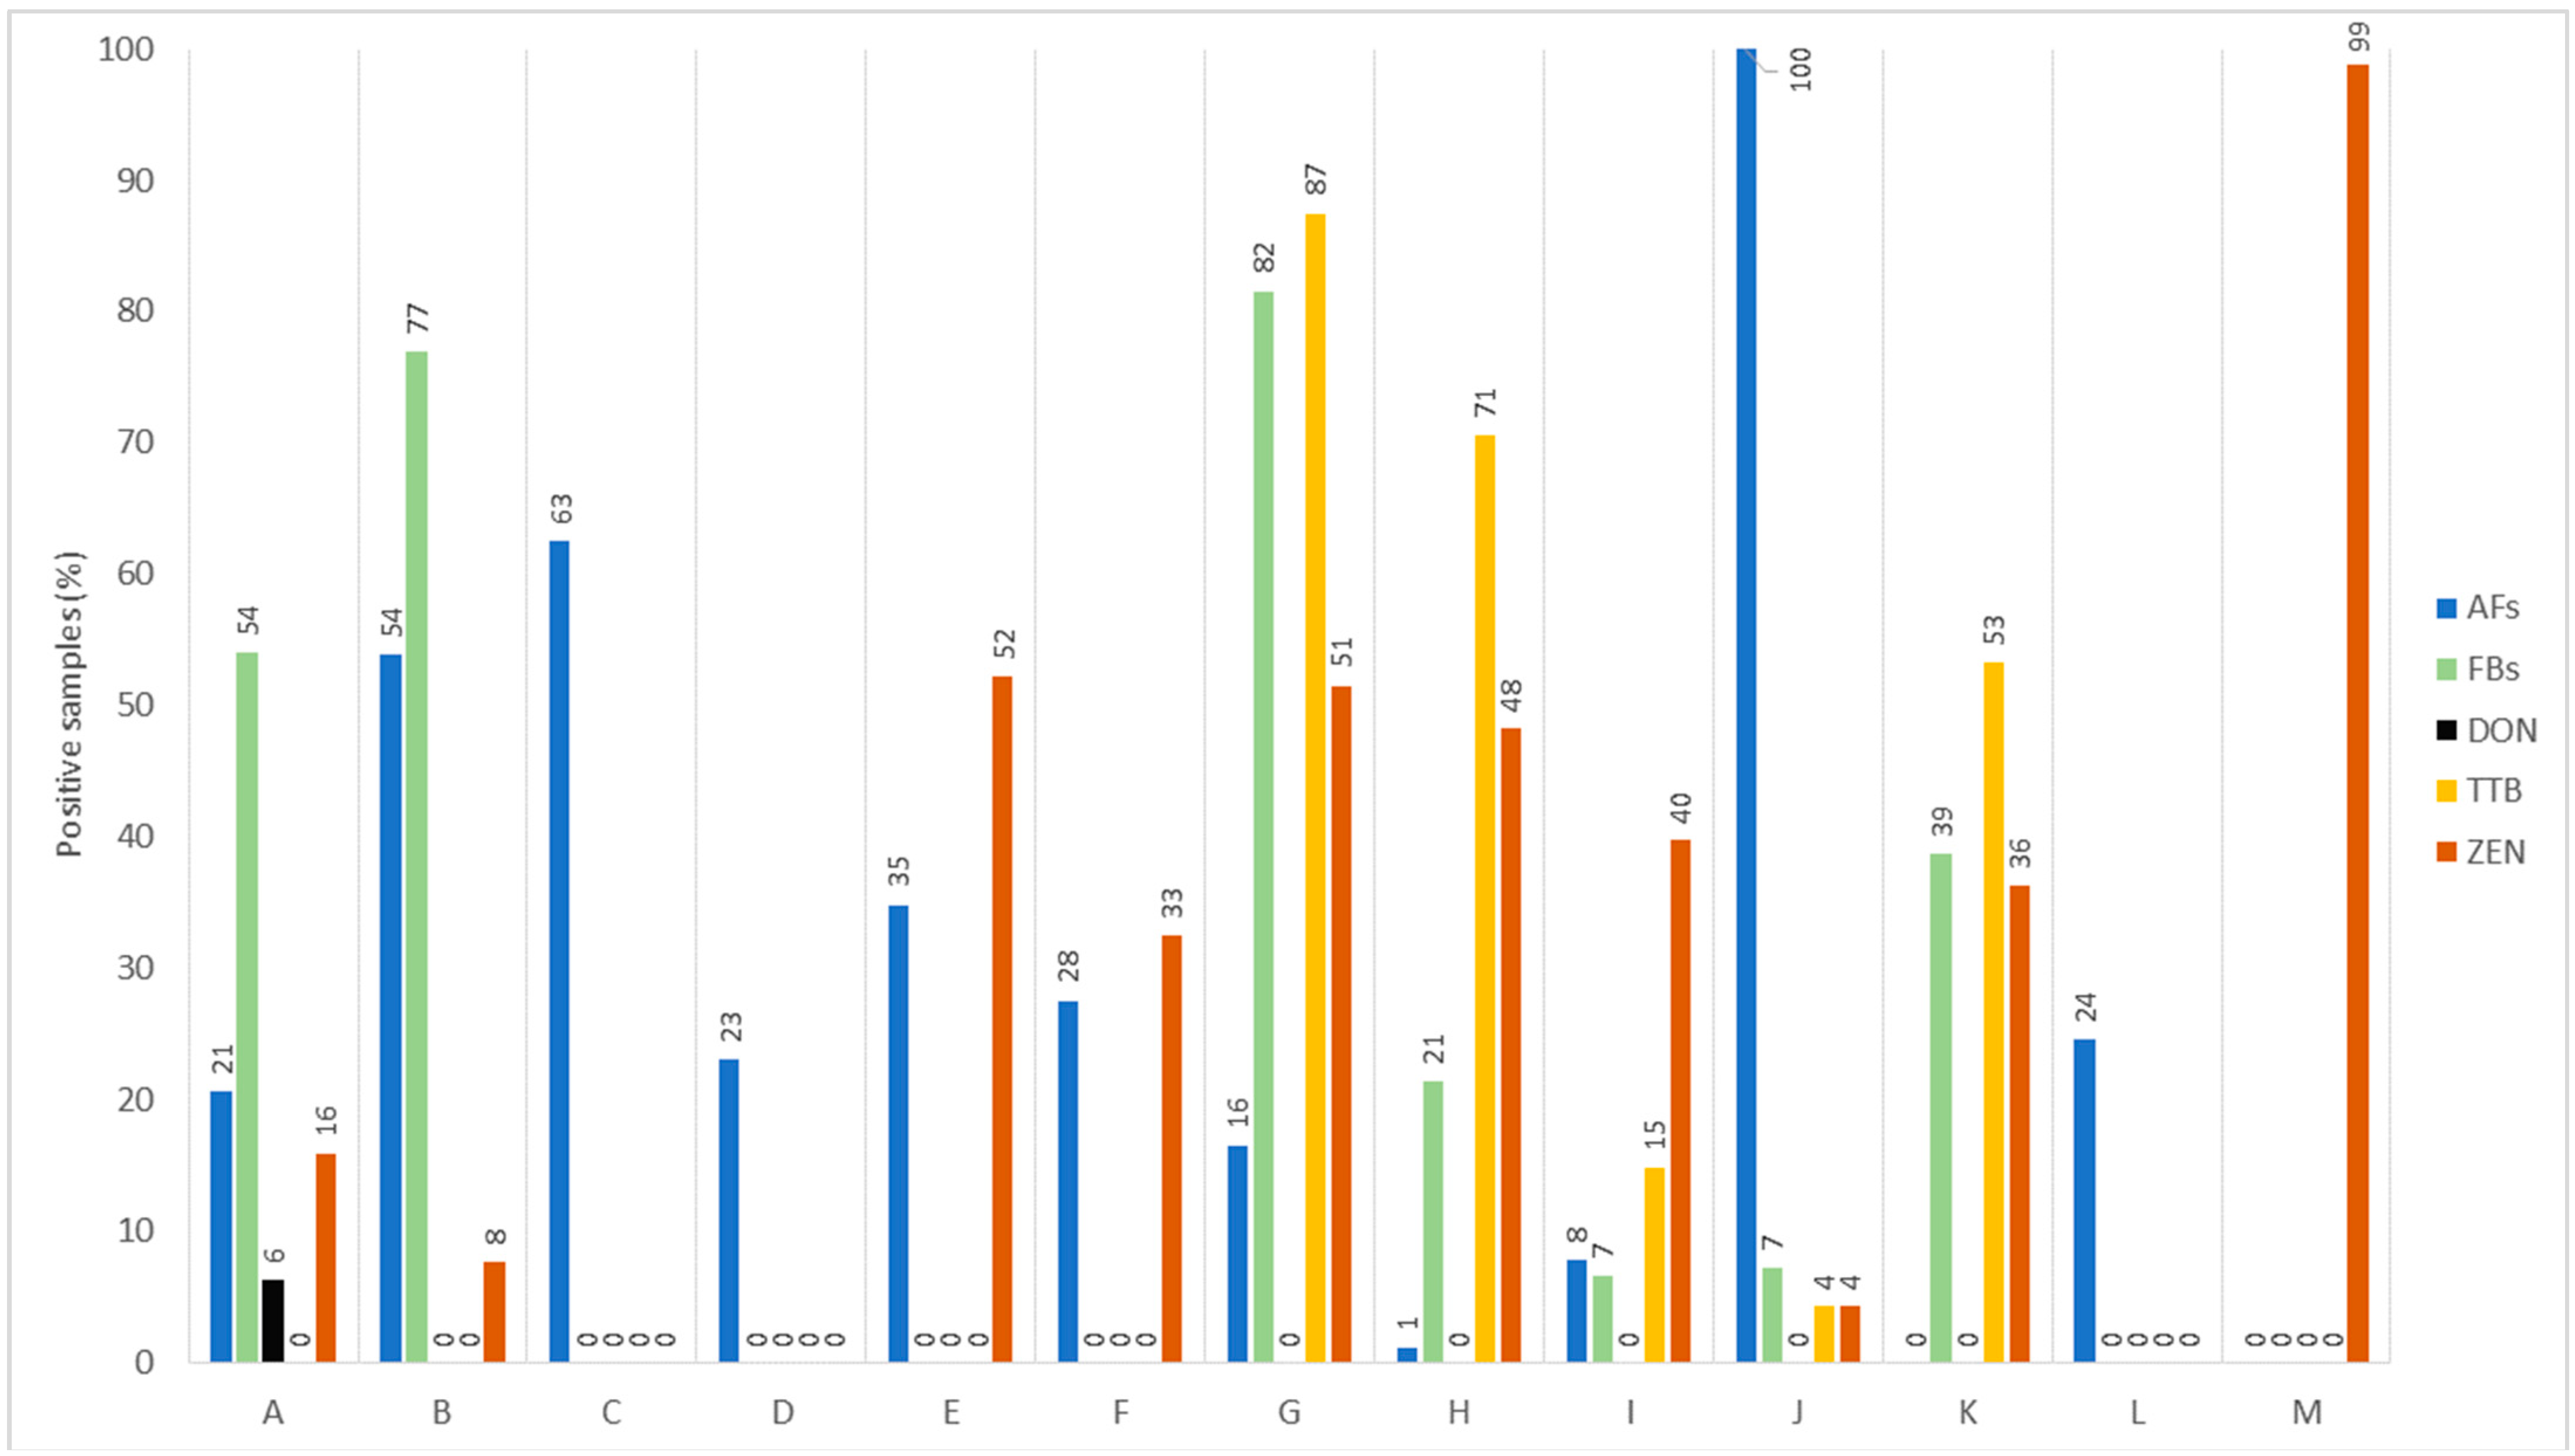
Figure 1. Overall percentage of positive samples of foods for mycotoxins recently reported (2017–2022). A, cereal-based infant foods; B, mix cereals and nut-based food; C, milk formula; D, fluid milk; E, chicken meat; F, eggs; G, corn as feed; H, wheat; I, soybean meal; J, peanut meal; K, oat grass; L, corn; M, dairy milk. AFs, aflatoxins; FBs, fumonisins; DON, deoxynivalenol; TTB, trichothecene type B; ZEN, zearalenone.
When it comes to TTB having DON as a key toxin, its prevalence and level in cereals and cereal-derived products appear to show consistency across different regions. This corroborates Khaneghah et al. [31], who pointed out a higher occurrence and concentration of DON in cereal products worldwide. This observation is corroborated by additional studies. For instance, research from Algeria found that 33.3% of barley, corn, rice, and wheat samples had elevated levels of DON (ranging from 15–4569 µg/kg) [32] In Egypt, approximately 70.2% of the wheat and corn products had high contamination by DON (ranging up to 853 µg/kg) [33] A study in Brazil highlights widespread DON in various food items like rice (median 13.2 µg/kg), beans (51.3 µg/kg), wheat flour (408.2 µg/kg), corn flour (56.7 µg/kg), and cornmeal (51.8 µg/kg) [9]. In line with FBs, this group of toxins show maximum probability with cereal products. For example, barley, corn, rice, and wheat from Algeria presented surprisingly higher incidence and levels of FBs (up to 48,878.00 µg/kg) in 21 samples that exceeded the maximum permitted limit (MPL, 1000 µg/kg) in these foodstuffs according to the European Union (EU) [20][32] Regarding ZEN, it occurred in almost 100% of animal products while little in cereal commodities, indicating sample size variations (Figure 1). However, further studies have shown ZEN occurrence with higher rates in cereal commodities. For example, in the cereal group, rice wheat, and corn products are likely to be more contaminated with maximum incidence of ZEN. This likelihood aligns with a higher ZEN level (8–474 µg/kg) in rice, wheat bread, and pasta, as well as in corn-based cake or meal from Brazil [34]. Higher ZEN (median levels 57.9–70.9 µg/kg) occurrence was found in wheat grains, with varying frequencies (12–84%) in Brazil, where ZEN was above the MPL of the EU in numerous samples [35]. In similar cereal products from Pakistan, 57% of the samples had ZEN positivity, with 31% of samples above the MPL (50 µg/kg) [36]. The occurrence frequency of AFs was also high in the remaining products (Table 1, Figure 1). The data can be reinforced with the results from research describing the AFs most frequently occurring in these products [15]. High positivity rates were recorded for milk products (63%) and peanut meal (100%). In general, it can be noted that the contamination levels of various toxins surveyed within five years were high in many products, mainly in China [12], and in this case, a large variability may indicate the sample size. Compared to the established limits by the European Union, for example, the mean levels in 96 and 108 samples of corn from Croatia and Serbia during a four-year survey presented 11.87 µg/kg and 11.1 µg/kg of AFs that are above the established MPL for cereals [21][29]. Contrarily, a survey in Chile using 24 to 26 samples of milk formulas and fluid milk presented a percent rate for AFM1 positivity of 62.5% and 23.1%, respectively. The mean levels were 0.0038 and 0.0069 µg/kg, below the EU thresholds [29][37]. These details shed light on the prevalence of multi-mycotoxin contamination with varied levels in numerous products, which can be a matter of exposure that causes health issues in humans and animals [20][21][22][23][24][25].
Human exposure to these toxins based on their biomarkers in bodily fluids, e.g., urine, blood, and serum, has also been described [37][38][39]. Exposure to these toxins can demonstrate high levels of positivity compared to non-exposed volunteers. In addition, the exposed group can present biomarkers with average levels higher than non-exposed ones [40]. In epidemiological investigations, in non-occupational exposure, sample positivity percentages vary. This is in line with a study by Šarkanj et al. [41] from Nigeria, where urine samples were evaluated for AFM1, FB1, OTA, DON, ZEN, and other less usual biomarkers, highlighting sample positivity of 72%, 71%, 78%, 19%, and 82%. Contrarily, Njumbe Ediage et al. [40] found lower frequencies of biomarkers in human urine collected in Belgium, with 13%, 7%, 3%, 10%, 10%, and 10% for DON, OTα, CIT, β-ZEL, ZEN, and OTA, respectively. These results indicate that mycotoxin exposure frequency can differ according to several factors, including occupation, origin, biomarker monitoring, and exposure to toxins, mainly by ingesting contaminated food, inhalation, or other routes of exposure [38]. These details indicate mycotoxins’ persistence and interactions in the foods, which should be concisely underlined. Such effort could be emphasized mainly in the cereals and nuts industry, with some possible biochemistry discussion regarding toxins’ occurrence, persistence, and interaction issues that can be relevant to the food industry and public health.
This entry is adapted from the peer-reviewed paper 10.3390/foods12234314
References
- Alshannaq, A.; Yu, J.-H. Occurrence, Toxicity, and Analysis of Major Mycotoxins in Food. Int. J. Environ. Res. Public Health 2017, 14, 632.
- Rashid Hudu, A.; Gustav Komla, M.; Opoku, N. Influence of Indigenous Processing Methods on Aflatoxin Occurrence in Africa. In Aflatoxins—Occurrence, Detoxification, Determination and Health Risks; IntechOpen: London, UK, 2022.
- Ostry, V.; Malir, F.; Toman, J.; Grosse, Y. Mycotoxins as Human Carcinogens—The IARC Monographs Classification. Mycotoxin Res. 2017, 33, 65–73.
- EFSA. Opinion of the Scientific Panel on Contaminants in the Food Chain Related to Aflatoxin B1 as Undesirable Substance in Animal Feed. EFSA J. 2004, 2, 39.
- Sadhasivam, S.; Britzi, M.; Zakin, V.; Kostyukovsky, M.; Trostanetsky, A.; Quinn, E.; Sionov, E. Rapid Detection and Identification of Mycotoxigenic Fungi and Mycotoxins in Stored Wheat Grain. Toxins 2017, 9, 302.
- Buśko, M.; Jeleń, H.; Góral, T.; Chmielewski, J.; Stuper, K.; Szwajkowska-Michałek, L.; Tyrakowska, B.; Perkowski, J. Volatile Metabolites in Various Cereal Grains. Food Addit. Contam. Part A 2010, 27, 1574–1581.
- Bouelet Ntsama, I.; Frazzoli, C.; Pouokam, G.; Colizzi, V. Occurrence and Dietary Risk Assessment of Mycotoxins in Most Consumed Foods in Cameroon: Exploring Current Data to Understand Futures Challenges. Foods 2023, 12, 1713.
- Streit, E.; Naehrer, K.; Rodrigues, I.; Schatzmayr, G. Mycotoxin Occurrence in Feed and Feed Raw Materials Worldwide: Long-Term Analysis with Special Focus on Europe and Asia. J. Sci. Food Agric. 2013, 93, 2892–2899.
- Franco, L.T.; Petta, T.; Rottinghaus, G.E.; Bordin, K.; Gomes, G.A.; Oliveira, C.A.F. Co-Occurrence of Mycotoxins in Maize Food and Maize-Based Feed from Small-Scale Farms in Brazil: A Pilot Study. Mycotoxin Res. 2019, 35, 65–73.
- Shi, H.; Li, S.; Bai, Y.; Prates, L.L.; Lei, Y.; Yu, P. Mycotoxin Contamination of Food and Feed in China: Occurrence, Detection Techniques, Toxicological Effects and Advances in Mitigation Technologies. Food Control 2018, 91, 202–215.
- Holanda, D.M.; Kim, S.W. Mycotoxin Occurrence, Toxicity, and Detoxifying Agents in Pig Production with an Emphasis on Deoxynivalenol. Toxins 2021, 13, 171.
- Hao, W.; Guan, S.; Li, A.; Wang, J.; An, G.; Hofstetter, U.; Schatzmayr, G. Mycotoxin Occurrence in Feeds and Raw Materials in China: A Five-Year Investigation. Toxins 2023, 15, 63.
- Iqbal, S.Z.; Nisar, S.; Asi, M.R.; Jinap, S. Natural Incidence of Aflatoxins, Ochratoxin A and Zearalenone in Chicken Meat and Eggs. Food Control 2014, 43, 98–103.
- Adegbeye, M.J.; Reddy, P.R.K.; Chilaka, C.A.; Balogun, O.B.; Elghandour, M.M.M.Y.; Rivas-Caceres, R.R.; Salem, A.Z.M. Mycotoxin Toxicity and Residue in Animal Products: Prevalence, Consumer Exposure and Reduction Strategies—A Review. Toxicon 2020, 177, 96–108.
- Gruber-Dorninger, C.; Jenkins, T.; Schatzmayr, G. Global Mycotoxin Occurrence in Feed: A Ten-Year Survey. Toxins 2019, 11, 375.
- Pereira, V.L.; Fernandes, J.O.; Cunha, S.C. Mycotoxins in Cereals and Related Foodstuffs: A Review on Occurrence and Recent Methods of Analysis. Trends Food Sci. Technol. 2014, 36, 96–136.
- Marin, S.; Ramos, A.J.; Cano-Sancho, G.; Sanchis, V. Mycotoxins: Occurrence, Toxicology, and Exposure Assessment. Food Chem. Toxicol. 2013, 60, 218–237.
- Leite, M.; Freitas, A.; Silva, A.S.; Barbosa, J.; Ramos, F. Maize Food Chain and Mycotoxins: A Review on Occurrence Studies. Trends Food Sci. Technol. 2021, 115, 307–331.
- Schrenk, D.; Bignami, M.; Bodin, L.; Chipman, J.K.; del Mazo, J.; Grasl-Kraupp, B.; Hogstrand, C.; Hoogenboom, L.; Leblanc, J.; Nebbia, C.S.; et al. Risk Assessment of Aflatoxins in Food. EFSA J. 2020, 18, e06040.
- EU Commission Regulation (EC) No 1126/2007 of 28 September 2007 Amending Regulation (EC) No 1881/2006 Setting Maximum Levels for Certain Contaminants in Foodstuffs as Regards Fusarium Toxins in Maize and Maize Products. Available online: https://eur-lex.europa.eu/eli/reg/2007/1126/oj (accessed on 24 July 2023).
- Commission Regulation (EU) 2023/915 of 25 April 2023 on maximum levels for certain contaminants in food and repealing Regulation (EC) No 1881/2006. Available online: https://eur-lex.europa.eu/legal-content/EN/TXT/?uri=CELEX%3A32023R0915 (accessed on 24 July 2023).
- EU Commission Regulation (EC) No 165/2010 of 26 February 2010 Amending Regulation (EC) No 1881/2006 Setting Maximum Levels for Certain Contaminants in Foodstuffs as Regards Aflatoxins. Available online: https://www.legislation.gov.uk/eur/2010/165/contents# (accessed on 22 July 2023).
- FAO/WHO Evaluation of Certain Contaminants in Food: Eighty-Third Report of the Joint FAO/WHO Expert Committee on Food Additives. Available online: https://apps.who.int/iris/handle/10665/254893?show=full (accessed on 25 July 2023).
- Schrenk, D.; Bignami, M.; Bodin, L.; Chipman, J.K.; del Mazo, J.; Grasl-Kraupp, B.; Hogstrand, C.; Leblanc, J.; Nielsen, E.; Ntzani, E.; et al. Assessment of Information as Regards the Toxicity of Fumonisins for Pigs, Poultry and Horses. EFSA J. 2022, 20, e07534.
- EFSA. Evaluation of the Increase of Risk for Public Health Related to a Possible Temporary Derogation from the Maximum Level of Deoxynivalenol, Zearalenone and Fumonisins for Maize and Maize Products. EFSA J. 2014, 12, 3699.
- Ayeni, K.I.; Sulyok, M.; Krska, R.; Warth, B.; Ezekiel, C.N. Mycotoxins in Complementary Foods Consumed by Infants and Young Children within the First 18 Months of Life. Food Control 2023, 144, 109328.
- Calderón, R.; Palma, P.; Godoy, M.; Vidal, M.; Rivera, A. Co-Occurrence and Estimation of the Risk of Total Aflatoxins (B1, B2, G1, and G2) and Ochratoxin A in Agri-Food Products Consumed in Chile. Food Control 2023, 146, 109493.
- Foerster, C.; Monsalve, L.; Ríos- Gajardo, G. Occurrence of Aflatoxin M1 in Milk and Exposure Estimation for Its Consumption in the Chilean Population. Food Control 2023, 148, 109677.
- Pleadin, J.; Kos, J.; Radić, B.; Vulić, A.; Kudumija, N.; Radović, R.; Janić Hajnal, E.; Mandić, A.; Anić, M. Aflatoxins in Maize from Serbia and Croatia: Implications of Climate Change. Foods 2023, 12, 548.
- Garcia, I.; Valente, D.; Carolino, N.; Dinis, H.; Sousa, R.; Duarte, S.C.; Silva, L.J.G.; Pereira, A.M.P.T.; Pena, A. Occurrence of Zearalenone in Dairy Farms-A Study on the Determinants of Exposure and Risk Assessment. Toxicon 2023, 225, 107051.
- Mousavi Khaneghah, A.; Fakhri, Y.; Raeisi, S.; Armoon, B.; Sant’Ana, A.S. Prevalence and Concentration of Ochratoxin A, Zearalenone, Deoxynivalenol and Total Aflatoxin in Cereal-Based Products: A Systematic Review and Meta-Analysis. Food Chem. Toxicol. 2018, 118, 830–848.
- Mahdjoubi, C.K.; Arroyo-Manzanares, N.; Hamini-Kadar, N.; García-Campaña, A.M.; Mebrouk, K.; Gámiz-Gracia, L. Multi-Mycotoxin Occurrence and Exposure Assessment Approach in Foodstuffs from Algeria. Toxins 2020, 12, 194.
- Gab-Allah, M.A.; Tahoun, I.F.; Yamani, R.N.; Rend, E.A.; Shehata, A.B. Natural Occurrence of Deoxynivalenol, Nivalenol and Deoxynivalenol-3-Glucoside in Cereal-Derived Products from Egypt. Food Control 2022, 137, 108974.
- Coppa, C.F.S.C.; Cirelli, A.C.; Gonçalves, B.L.; Barnabé, E.M.B.; Mousavi Khaneghah, A.; Corassin, C.H.; Oliveira, C.A.F. Dietary Exposure Assessment and Risk Characterization of Mycotoxins in Lactating Women: Case Study of São Paulo State, Brazil. Food Res. Int. 2020, 134, 109272.
- Tralamazza, S.M.; Bemvenuti, R.H.; Zorzete, P.; de Souza Garcia, F.; Corrêa, B. Fungal Diversity and Natural Occurrence of Deoxynivalenol and Zearalenone in Freshly Harvested Wheat Grains from Brazil. Food Chem. 2016, 196, 445–450.
- Alim, M.; Iqbal, S.Z.; Mehmood, Z.; Asi, M.R.; Zikar, H.; Chanda, H.; Malik, N. Survey of Mycotoxins in Retail Market Cereals, Derived Products and Evaluation of Their Dietary Intake. Food Control 2018, 84, 471–477.
- Jager, A.V.; Tonin, F.G.; Baptista, G.Z.; Souto, P.C.M.C.; Oliveira, C.A.F. Assessment of Aflatoxin Exposure Using Serum and Urinary Biomarkers in São Paulo, Brazil: A Pilot Study. Int. J. Hydrog. Environ. Health 2016, 219, 294–300.
- Franco, L.T.; Mousavi Khaneghah, A.; In Lee, S.H.; Fernandes Oliveira, C.A. Biomonitoring of Mycotoxin Exposure Using Urinary Biomarker Approaches: A Review. Toxin Rev. 2021, 40, 383–403.
- Franco, L.T.; Ismail, A.; Amjad, A.; Oliveira, C.A.F. de Occurrence of Toxigenic Fungi and Mycotoxins in Workplaces and Human Biomonitoring of Mycotoxins in Exposed Workers: A Systematic Review. Toxin Rev. 2021, 40, 576–591.
- Njumbe Ediage, E.; Diana Di Mavungu, J.; Song, S.; Wu, A.; Van Peteghem, C.; De Saeger, S. A Direct Assessment of Mycotoxin Biomarkers in Human Urine Samples by Liquid Chromatography Tandem Mass Spectrometry. Anal. Chim. Acta 2012, 741, 58–69.
- Šarkanj, B.; Ezekiel, C.N.; Turner, P.C.; Abia, W.A.; Rychlik, M.; Krska, R.; Sulyok, M.; Warth, B. Ultra-Sensitive, Stable Isotope Assisted Quantification of Multiple Urinary Mycotoxin Exposure Biomarkers. Anal. Chim. Acta 2018, 1019, 84–92.
This entry is offline, you can click here to edit this entry!