Citral is a monoterpene constituted by two isomers known as neral and geranial. It is present in different plant sources and recognized as safe (GRAS) by the Food and Drug Administration (FDA). Investigations have demonstrated that this compound exhibited several biological activities, such as antibacterial, antifungal, antibiofilm, antiparasitic, antiproliferative, anti-inflammatory, and antioxidant properties, by in vitro and in vivo assays. Additionally, when incorporated into different food matrices, citral can reduce the microbial load of pathogenic microorganisms and extend the shelf life.
- citral
- biological activities
- food additive
- pharmaceuticals
1. Introduction
2. Biological Activities
2.1. Antibacterial Activity
| Microorganism | Dose (MIC) | Effect | Ref. |
|---|---|---|---|
| Bacteria | |||
| V. parahaemolyticus | 0.125 mg/mL | Inhibited bacterial growth, causing damage to bacterial membrane and cell wall. | [20] |
| S. aureus DMST 4745 S. aureus S. agalactiae B. cereus E. coli |
0.62–1.25 μL/mL 0.62–1.25 μL/mL 0.31–0.62 μL/mL 0.15 μL/mL 1.25–2.5 μL/mL |
Citral possessed bacteriostatic and bactericidal actions at different concentrations. | [21] |
| E. coli MG1655 | 300 μL/L | It inactivated at least 2.5 log10 cycles of exponentially growing cells in 3 h under aerobic conditions. | [22] |
| L. monocytogenes S. aureus E. coli |
200 µL/mL 500 µL/mL 500 µL/mL |
Growth inhibition. | [23] |
| L. monocytogenes L. innocua |
0.125 mL/mL 0.125 mL/mL |
Microbial growth of both Listeria species was reduced by almost 2 log10 CFU/mL. | [24] |
| L. innocua L. monocytogenes |
100 µL/mL | Citral in the culture medium of both bacteria provided a reduction of bacitracin from 32 µg/mL to 4 µg/mL, and the colistin changed from 96 and 128 µg/mL for L. monocytogenes and L. innocua, respectively, to 16 µg/mL, for both species. | [25] |
| Salmonella Typhimurium | 3.1 mM | Citral at subinhibitory concentrations (1, 2, and 3 mM) could induce bacterial adaptation and acquire tolerance to inactivation processes. | [26] |
| Fungi | |||
| B. dothidea P. macrospore B. cinerea |
0.2 μL/mL 0.2 μL/mL 0.4 μL/mL |
At 0.4 μL/mL, citral entirely inhibited the growth of all the tested fungi. When concentration reached 0.2 μL/mL, citral inhibited the growth of B. dothidea best, followed by P. macrospore and B. cinerea. | [27] |
| C. sakazakii | 0.8 mg/mL | Growth inhibition and cell damage. | [28] |
| 3600 μM | Concentrations below 225 μM (1/16 MIC) exhibited no inhibition against C. sakazakii ATCC 29544. | ||
| Penicillium roqueforti | 0.17 mg/mL | Citral combination with eugenol damaged the cell membrane, caused a collapse of mitochondria, and inhibited energy production. | [16] |
| Penicillium digitatum | 2.0 or 4.0 μL/mL | Citral altered the mitochondrial morphology, led to the leakage of ATP, and showed an inhibition of the TCA pathway of P. digitatum cells. | [29] |
| S. cerevisiae | 2.0 mM | MIC: Results showed that yeast cells treated with 2 mM citral reached a 95% reduction in CFU/mL. | [30] |
| Zygosaccharomyces rouxii. | 0.188 μL/mL | The minimum fungicidal concentration was 0.375 μL/mL. | [31] |
| Candida albicans | 64 µg/mL | The minimum fungicidal concentration was 256 µg/mL. The MIC and the MFC of citral required only 4 h of exposure to effectively inhibit 99.9% of the inoculum. | [32] |
| Aspegillus niger | 0.23 mg/mL | The combination of citral and eugenol had a synergistic inhibitory effect on A. niger. | [16] |
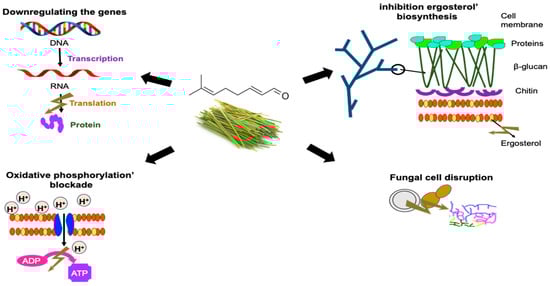
2.2. Antifungal Activity
| Microorganism | Mechanism | Ref. |
|---|---|---|
| Saccharomyces cerevisiae BY4741 | Loss of membrane and cell wall integrity results in a typical apoptotic/necrotic cell death. However, yeast cells that escape this first cell membrane disruption, particularly evident in sub-lethal concentration, die by metacaspase-mediated apoptosis induced by the accumulation of intracellular ROS. | [30] |
| B. dothidea | Changes in the morphological characteristics of fungal hyphae, resulting in loss of cell content and distortion of the mycelium. Increase in membrane permeability, with increases in extracellular electrical conductivity and a decrease in soluble protein content. A decrease in the range of ergosterol levels showed that citral altered the physiology of the cell membrane. Reduction in the level of enzymes associated with respiration, resulting in the disruption of energy metabolism. | [27] |
| Aspegillus ochraceus | Citral downregulated ochratoxin biosynthetic genes, including pks and nrps, but slightly upregulated global regulatory factors veA, velB, and laeA. | [27] |
| Aspegillus niger | Direct damage to the cell membranes of A. niger may explain the antimicrobial activity of citral combined with eugenol. Among the two components, eugenol is mainly responsible for the permeability of damaged cell membranes, whereas citral mainly causes membrane lipid peroxidation, which leads to a burst in ROS. | [16] |
| Penicillium roqueforti. |
The combination of citral and eugenol destroyed the integrity of the cell membrane and internal structures and degraded the cell content. The combination induced membrane lipid peroxidation and promoted the ability to destroy the cell membrane. The combined agents eventually caused leakage of cell contents and, ultimately, cell death. | [16] |
| Penicillium digitatum |
Citral can affect the mitochondrial morphology and function of P. digitatum, inhibiting the respiratory metabolism, decreasing the activities of TCA-related enzymes, and changing the TCA metabolic abilities. | [29] |
| Zigosachamomyces rouxii | The antifungal effect can be attributed to the alteration of the integrity and permeability of the cell membrane, which can cause irreversible damage to the cell wall and membrane. They can also destroy yeast proteins and inhibit their synthesis. | [31] |
2.3. Antiproliferative Effect against Cancer Cells
| Compound/ Extract |
Doses | Effect | Ref. |
|---|---|---|---|
| Citral | 145.32 µg/mL 85.47 µg/mL 52.63 µg/mL |
Inhibition of HCT116 cell proliferation (IC50: 24, 48, and 72 h) | [37] |
| Citral | 181.21 µg/mL 143.61 µg/mL 91.5 µg/mL |
Inhibition of HT29 cell proliferation (IC50: 24, 48, and 72 h) | [37] |
| Citral | 3.125–200 µM | Inhibition of CCD841-CoN cell (IC50 not detected at 200 μM) | [37] |
| Citral | 3.7 µg/mL | Inhibition of Caco-2 cell proliferation (IC50: 72 h) | [38] |
| CIT-SNEDDS | 38.50 µg/mL 23.75 µg/mL 16.50 µg/mL |
Inhibition of SW620 cell proliferation (IC50: 24, 48, and 72 h) | [36] |
| CIT-SNEDDS | 44.10 µg/mL 36.60 µg/mL 34.10 µg/mL |
Inhibition of HT29 cell proliferation (IC50: 24, 48, and 72 h) | [36] |
| Citral | 31.25 µg/mL 23.30 µg/mL 22.50 µg/mL |
Inhibition of SW620 cell proliferation (IC50: 24, 48, and 72 h) | [36] |
| Citral | 28.33 µg/mL 22.00 µg/mL 21.77 µg/mL |
Inhibition of HT29 cell proliferation (IC50: 24, 48, and 72 h) | [36] |
| Citral | <25 µg/mL | Inhibition of AGS cell proliferation (IC50: 48 h) | [39] |
| Citral | >75 µg/mL | Inhibition of MRC-5 cell proliferation (IC50: 48 h) | |
| Citral | 1.04 µM | Inhibition of B16F10 cell proliferation (IC50: 24 h) | [40] |
| Citral | 11.7 µM | Inhibition of SK-MEL-147 cell proliferation (IC50: 24 h) | |
| Citral | 13.4 µM | Inhibition of UACC-257 cell proliferation (IC50: 24 h) | |
| Citral | 50.3 µM | Inhibition of HaCaT cell proliferation (IC50: 24 h) | |
| Citral | 2.5 µM | Inhibition of NIH-3T3 cell proliferation (IC50: 72 h) | |
| Citral | 7 µg/mL | Inhibition of HepG2 cell proliferation (IC50: 72 h) | [38] |
| Citral | 1.3 µg/mL | Inhibition of MCF-7 cell proliferation (IC50: 72 h) | |
| Citral | 71.90 µM 57.11 µM 50.20 µM |
Inhibition of KKU-M213 cell proliferation (IC50: 24, 48, and 72 h) | [41] |
| Citral | 94.43 µM 75.06 µM 58.92 µM |
Inhibition of HuCCA-1 cell proliferation (IC50: 24, 48, and 72 h) | [41] |
| Citral | 87.53 72.17 69.22 |
Inhibition of MMNK-1 cell proliferation (IC50: 24, 48, and 72 h) | [41] |
| Citral | 10 µg/mL | Inhibition of PC-3 cell proliferation (IC50: 72 h) | [42] |
| Citral | 12.5 µg/mL | Inhibition of PC-3M cell proliferation (IC50: 72 h) | [42] |
| Citral | >75 µg/mL | Inhibition of MRC-5 cell proliferation (IC50: 72 h) | [42] |
| Citral | 238 µM | Inhibition of PaCa-2 cell proliferation (IC50: 72 h) | [43] |
| Citral | 300 µM | Inhibition of DeFew cell proliferation (IC50: 72 h) | [43] |
| Citral | 5, 10, 20, 40 µg/mL | Inhibit colony formation and migration of AGS (96 h) | [39] |
| Citral | 5, 10, 20, 30, 40 µg/mL | Inhibit colony formation and migration PC-3 (96 h) | [42] |
| Citral | 17.5 and 35 µM | Increase the surviving fraction of KKU-M213 in 106.75 and 115.64% (168 h) | [41] |
| Citral | 23.5 and 47 µM | Decrease the surviving fraction of HU-CCA-1 in 76.35 and 57.71% (168 h) | [41] |
| Citral | 24 and 48 µM | Decrease the surviving fraction of MMNK-1 in 98.46 and 85.26% (168 h) | [41] |
| Citral | 0.25, 0.375, 0.50 mM 0.25, 0.375, 0.50 mM |
Decrease the clonogenicity of HaCaT in 0.3, 4, and 7% (3 h) Decrease the clonogenicity of HaCaT in 22, 28, and 30% (8 h) |
[44] |
| Citral | Decrease the clonogenicity of M624 in 20, 38, and 50% (3 h) | [44] | |
| Citral | 50 µM 100 µM 200 µM |
Early apoptosis (17.1%), late apoptosis (3.1%) in HCT116 (24 h) Early apoptosis (14.2%), late apoptosis (15.1%) in HCT116 (24 h) Early apoptosis (26.2%), late apoptosis (25.8%) in HCT116 (24 h) |
[37] |
| Citral | 50 µM 100 µM 200 µM |
Early apoptosis (22.3%), late apoptosis (16.1%) in HCT116 (48 h) Early apoptosis (26.2%), late apoptosis (24.6%) in HCT116 (48 h) Early apoptosis (32.1%), late apoptosis (37.5%) in HCT116 (48 h) |
[37] |
| Citral | 50 µM 100 µM 200 µM |
Early apoptosis (6.5%), late apoptosis (3.9%) in HT29 (24 h) Early apoptosis (8.5%), late apoptosis (14.2%) in HT29 (24 h) Early apoptosis (8.4%), late apoptosis (24.9%) in HT29 (24 h) |
[37] |
| Citral | 50 µM 100 µM 200 µM |
Early apoptosis (14.5%), late apoptosis (7.1%) in HT29 (48 h) Early apoptosis (22.7%), late apoptosis (17.8%) in HT29 (48 h) Early apoptosis (30.5%), late apoptosis (23.5%) in HT29 (48 h) |
[37] |
| Citral | 10 and 20 µg/mL | Induce early and late apoptosis in AGS | [39] |
| Citral | 1 µM | Apoptosis induction by annexin V-FITC/PI staining in B16F10 (24 h) |
[40] |
| Citral | 0.5, 1, and 2 µM | Apoptosis induction by TUNEL assay in B16F10 (24 h) | [40] |
| Citral | 10 µg/mL 20 µg/mL |
Early apoptosis (44.1%), late apoptosis (52.6%) in PC-3 (48 h) Early apoptosis (62.2%), late apoptosis (38.4%) in PC-3 (48 h) |
[42] |
| Citral | 50, 100, and 200 µM | Disruption of MMP (19.5, 38.8 and 60.9%) in HCT116 (24 h) | [37] |
| Citral | 50, 100, and 200 µM | Disruption of MMP (34.9, 56.4 and 77.3%) in HCT116 (48 h) | [37] |
| Citral | 50, 100, and 200 µM | Disruption of MMP (20.4, 28.2 and 41.9%) in HT29 (24 h) | [37] |
| Citral | 50, 100, and 200 µM | Disruption of MMP (24.5, 43.9 and 59.9%) in HT29 (24 h) | [37] |
| Citral | 50, 100, and 200 µM | Increase intracellular ROS level (1.26, 2.07, and 3.19 folds) in HCT116 (4 h) | [37] |
| Citral | 50, 100, and 200 µM | Increase intracellular ROS level (1.21, 1.39, and 2.25 folds) in HC29 (4 h) | [37] |
| Citral | 50, 100, and 200 µM | Decrease intracellular GSH level in HCT116 (4 h) | [37] |
| Citral | 50, 100, and 200 µM | Decrease intracellular GSH level in HT29 (4 h) | [37] |
| Citral | 1 µM | Autophagic vacuole induction formation in B16F10 (24 h) | [37] |
| Citral | 0.5, 1, and 2 µM | DNA damage in B16F10 (24 h) | [40] |
| Citral | 2.5 µM | Reduction of malondialdehyde level in B16F10 (24 h) | [40] |
| Citral | 10 and 20 µg/mL | Inhibition of lipid droplet accumulation in PC-3 (48 h) | [42] |
| Citral | 50, 100, and 200 µM | Down-expression of Bcl-2 and Bcl-xL proteins in HCT116 (24 h) High expression of Bax, p53, and caspase-3 proteins in HCT116 (24 h) |
[37] |
| Citral | 50, 100, and 200 µM | Down-expression of Bcl-2 and Bcl-xL proteins in HT29 (24 h) High expression of Bax, p53, and caspase-3 proteins in HT29 (24 h) |
[37] |
| Citral | 0.5 and 1 µM | Down-expression of ERK1/2, PI3K, AkT in HCT116 (24 h) High expression of p53 in HCT116 (24 h) |
[40] |
| Citral | 1 µM | Increase cytoplasmatic NF-κB in B16F10 (24 h) | [40] |
| Citral | 1 µM | Decrease nuclear translocation of NF-κB in B16F10 (24 h) | [40] |
| Citral | 0.25, 0.375, 0.5 mM | Caspase-3 activation in M624 (3 h) | [44] |
| Citral | 0.25, 0.375, 0.5 mM | Caspase-3 activation in HaCaT (3 h) | [44] |
| Citral | 20 µg/mL | Down-expression of HMGR, SREPB1, and ACC proteins in PC-3 (48 h) Up-expression of AMPαK in PC-3 (48 h) |
[44] |
| Citral | 5, 10, and 20 µg/mL | Down-expression of BCl-2 in PC-3 (48 h) and high expression of BAX proteins in PC-3 (48 h) |
[44] |
| Citral | Not reported | mRNA upregulate in AGS (48 h): MAPK, Nf-κB, PI3K-Akt, p53, and other signaling pathways. Spliceosoma, apoptosis, and prostate cancer, among others. | [39] |
| Not reported | mRNA downregulate in AGS: NF-κB, PI3K-Akt, p53, PPAR, among other signaling pathways. Cell cycle, fatty acid metabolism, and proteoglycans in cancer, among others. | [39] | |
| Citral | 5, 10, and 20 µg/mL | Down-expression of HMCR, ACC, FASN, and SREPB1 mRNAs in PC-3 (48 h) | [42] |
2.4. Anti-Inflammatory
| Citral/EO Citral Rich/Constituent | Concentration | Animal/Cell Line Tested | Results | Ref. |
|---|---|---|---|---|
| Citral | 5–100 μg/well | Peritoneal macrophage of male BALB/c mice | 50 and 100 μg of citral significantly inhibited IL-1β and IL-10 release and LPS activation. IL-6 production by macrophages significantly decreased at citral concentrations of 5, 10, 25, 50, and 100 μg/well). |
[46] |
| Citral | 0.36, 0.15, and 0.06 g/kg |
MRSA-infected mice | Citral significantly reduced the levels of TNF-α, IL-6, IL-1β, malondialdehyde, and hydroxyl radicals. Increased superoxide dismutase and glutathione enzyme levels. Reduced the lung inflammatory infiltrates infected by MRSA. |
[47] |
| Citral | 300 mg/kg | Diabetes-induced rats | Gene expression of IL-6 and TNF-α in the liver were significantly downregulated. | [48] |
| Citral | 50–300 mg/kg | Paw edema-induced mice | Reversed paw edema formation in mice induced by LPS and zymosan, inducers of TLR4 and TLR2 signaling. | [49] |
| Citral | 300 mg/kg | Eutrophic and obese mice | Citral reduced TNF-α and serum leptin concentration after the LPS challenge. IL6 levels in the hypothalamus of obese mice were reduced. |
[50] |
| Citral | 125, 250, and 500 mg/kg | Male Swiss mice | Citral reduced NO production and inhibited neutrophil migration in liver. | [51] |
| Citral | 10, 20, and 40 mg/kg 3, 6, and 12 µg/mL |
Mice with LPS-induced acute lung injury Alveolar macrophages |
On in vivo LPS-induced acute lung injury, citral reduced TNF-α, IL-6, and IL-1β production. In vitro, citral inhibited the production of TNF-α, IL-6, and IL-1β in alveolar macrophages. The mechanism was associated with PPAR-γ activation. |
[52] |
| Citral, neral, and geranial | 66 µM | Murine J774A.1 macrophages | Citral inhibited TNF-α and IL-6. Pure neral inhibited TNF-α secretion by 60–80%, whereas geranial 57–75%. Both neral and geranial reduced IL-6 secretion of LPS-stimulated macrophages and the expression of inflammatory mediators IL-1β, iNOS, COX-2, and NLRP-3. |
[53] |
| Citral-rich fractions of Citrus lemon EO | 0.005, 0.01, and 0.02% | Murine macrophage RAW264.7 cell line | Reduced the expression of the pro-inflammatory cytokines TNF-α, IL-1β, and IL-6 in LPS-induced macrophages. | [54] |
| Cymbopogon citratus EO | 0.1% | Pre-inflamed human dermal fibroblasts | Significantly inhibited the production of the inflammatory biomarkers: vascular cell adhesion molecule 1 (VCAM-1), interferon gamma-induced protein 10 (IP-10), interferon-inducible T-cell alpha chemoattractant (I-TAC), and monokine induced by gamma interferon (MIG). | [55] |
| Myrcia ovata EO | 200 and 300 mg/kg | Male Swiss mice with induced acute inflammation | Reduced leukocyte extravasation and inhibited TNF-α production by 50% and 69% at both concentrations, as well as IL-1β production by 47%. | [56] |
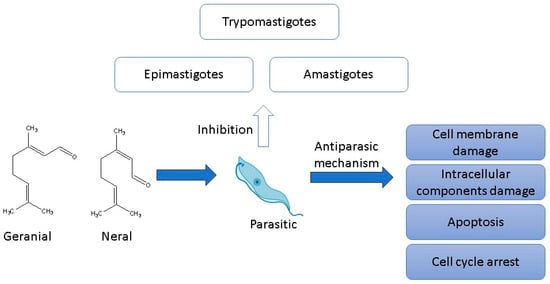
2.5. Antiparasitic
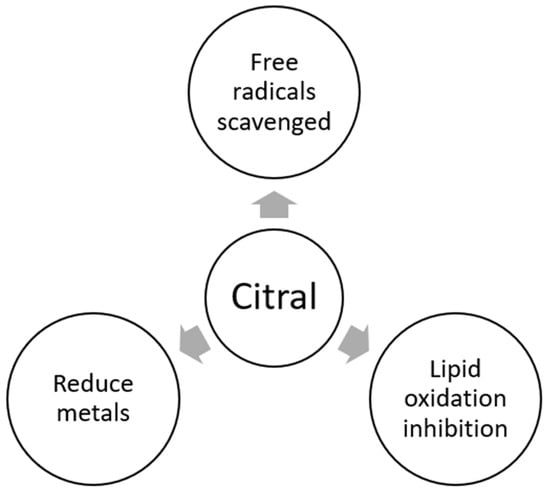
2.6. Antioxidant
3. Use as Possible Food Additive and Pharmaceutical
Citral’s inclusion in the US Environmental Protection Agency (EPA)’s GRAS list as a biopesticide has made it a versatile natural preservative for various food products. This not only extends shelf life but also aligns with consumer demand for healthier, eco-friendly, and clean-label options. hen et al. [68] reported that liposome–citral nanoencapsulates (105.7–238.0 nm) significantly improved the quality of fresh Shatangju mandarins compared to free citral-treated samples by reducing their weight loss and microbial spoilage after storage at 25 °C and 60–70% relative humidity (RH) for 26 d. Nanoemulsions containing citral have also shown outstanding effects when incorporated into coatings as vehicles, such as the case of the study reported by Machado [69], where alginate-based coatings that include citral nanoemulsions, in an optimal concentration between 0.1–0.5%, were a good barrier against microbial attack, while the quality parameters of the fruit were positively affected (e.g., color and respiration rate) during storage for 12 d at 4 °C and 90% RH.
Furthermore, citral’s antifungal activity has been potentiated when combined with other EOs. For example, a nanoemulsion blending clove (CO) and lemongrass (LGO) oils as eugenol and citral sources effectively disrupted the membrane of the highly invasive Fusarium oxysporum f.sp. lycopersici fungus. When tested individually, this combination exhibited the lowest MIC value at 3.9 mg/L, compared to 31.3 for CO and 62.5 mg/L for LGO [70]. Similarly, combining citral and eugenol at concentrations of 60 and 170 mg/L resulted in more substantial damage to P. roqueforti than when these compounds were used separately, leading to the cell content destruction and, consequently, the death of the fungus [16]. The combination of EOs proves to be a cost-effective strategy, achieving superior results with lower component concentrations. Furthermore, developing nanosystems, such as nanoemulsions and nanoencapsulates, facilitates their incorporation into food products, ensuring prolonged bioactivity.
In vitro and in vivo studies have shown that citral is a potent agent with many biological activities. However, citral’s ADME-Tox properties (absorption, distribution, metabolism, excretion, and toxicity) have been poorly understood. An in silico study showed that citral isomers (cis-citral and trans-citral) have acceptable drug-likeness properties and do not present any violations of Lipinski’s rules (molecular weight <500 daltons, LogPo/w value <5, <5 hydrogen bond donors, <10 hydrogen bond acceptors) which guarantees their high absorption when administered orally, however, their low solubility in water limits its distribution. Another important factor to consider is that the plasmatic concentration of citral isomers can be reduced due to the high capacity of both compounds to bind to plasmatic proteins [42]. On the other hand, citral isomers could present a high plasma half-life (T1/2) because both compounds do not show an inhibitory effect on CYP2D6. Citral isomers have an acceptable partition coefficient (cis-citral Log Po/w = 2.74, trans-citral Log Po/w = 2.71), suggesting both compounds can enter the cell and recognize their therapeutic targets. In addition, the predictive carcinogenicity effect in rodents is variable for the citral isomers (cis-citral toxicity (R) = negative, trans-citral toxicity (R) = positive); therefore, it is important to consider the concentration of individual isomers during the preclinical evaluations [9].
These results suggest that citral isomers have an acceptable capacity to be absorbed through the gastrointestinal tract and enter the target cells. However, several research studies do not consider the low distribution and bioavailability of this compound, so it is necessary to focus on the design of formulations that guarantee the compound´s good distribution and bioavailability.
This entry is adapted from the peer-reviewed paper 10.3390/antibiotics12111608
References
- Silva, C.d.B.d.; Guterres, S.S.; Weisheimer, V.; Schapoval, E.E. Antifungal activity of the lemongrass oil and citral against Candida spp. J. Braz. J. Infect. Dis. 2008, 12, 63–66.
- Wolken, W.A.; ten Have, R.; van der Werf, M. Amino acid-catalyzed conversion of citral: Cis-trans isomerization and its conversion into 6-methyl-5-hepten-2-one and acetaldehyde. J. Agric. Food Chem. 2000, 48, 5401–5405.
- Ress, N.; Hailey, J.; Maronpot, R.; Bucher, J.; Travlos, G.; Haseman, J.; Orzech, D.; Johnson, J.; Hejtmancik, M. Toxicology and carcinogenesis studies of microencapsulated citral in rats and mice. Toxicol. Sci. 2003, 71, 198–206.
- Gao, S.; Liu, G.; Li, J.; Chen, J.; Li, L.; Li, Z.; Zhang, X.; Zhang, S.; Thorne, R.F.; Zhang, S. Antimicrobial Activity of Lemongrass Essential Oil (Cymbopogon flexuosus) and Its Active Component Citral Against Dual-Species Biofilms of Staphylococcus aureus and Candida Species. Front. Cell. Infect. Microbiol. 2020, 10, 603858.
- Viktorová, J.; Stupák, M.; Řehořová, K.; Dobiasová, S.; Hoang, L.; Hajšlová, J.; Van Thanh, T.; Van Tri, L.; Van Tuan, N.; Ruml, T. Lemon Grass Essential Oil does not Modulate Cancer Cells Multidrug Resistance by Citral—Its Dominant and Strongly Antimicrobial Compound. Foods 2020, 9, 585.
- Ortega-Ramirez, L.A.; Gutiérrez-Pacheco, M.M.; Vargas-Arispuro, I.; González-Aguilar, G.A.; Martínez-Téllez, M.A.; Ayala-Zavala, J.F.J.A. Inhibition of Glucosyltransferase Activity and Glucan Production as an Antibiofilm Mechanism of Lemongrass Essential Oil against Escherichia coli O157: H7. Antibiotics 2020, 9, 102.
- Valliammai, A.; Sethupathy, S.; Ananthi, S.; Priya, A.; Selvaraj, A.; Nivetha, V.; Aravindraja, C.; Mahalingam, S.; Pandian, S.K. Proteomic profiling unveils citral modulating expression of IsaA, CodY and SaeS to inhibit biofilm and virulence in Methicillin-resistant Staphylococcus aureus. Int. J. Biol. Macromol. 2020, 158, 208–221.
- Santoro, G.; Cardoso, M.; Guimarães, L.; Freire, J.; Soares, M. Anti-proliferative effect of the essential oil of Cymbopogon citratus (DC) Stapf (lemongrass) on intracellular amastigotes, bloodstream trypomastigotes and culture epimastigotes of Trypanosoma cruzi (Protozoa: Kinetoplastida). Parasitology 2007, 134, 1649–1656.
- Ruiz-Bustos, E.; Velazquez, C.; Garibay-Escobar, A.; Garcia, Z.; Plascencia-Jatomea, M.; Cortez-Rocha, M.O.; Hernandez-Martinez, J.; Robles-Zepeda, R.E. Antibacterial and antifungal activities of some Mexican medicinal plants. J. Med. Food 2009, 12, 1398–1402.
- Martins, H.B.; das Neves Selis, N.; Silva e Souza, C.L.; Nascimento, F.S.; de Carvalho, S.P.; D’Oliveira Gusmão, L.; dos Santos Nascimento, J.; Brito, A.K.P.; Sde Souza, S.I.; de Oliveira, M.V.; et al. Anti-Inflammatory Activity of the Essential Oil Citral in Experimental Infection with Staphylococcus aureus in a Model Air Pouch. Evid.-Based Complement. Altern. Med. 2017, 2017, 2505610.
- Habib, S.; Gupta, P.; Bhat, S.S.; Gupta, J. In silico, in-vitro and in-vivo screening of biological activities of citral. Int. J. Vitam. Nutr. Res. 2020, 91, 251–260.
- Wang, Y.; Jiang, Z.-T.; Li, R. Antioxidant activity, free radical scavenging potential and chemical composition of Litsea cubeba essential oil. J. Essent. Oil Bear. Plants 2012, 15, 134–143.
- Kim, J.; Marshall, M.; Cornell, J.; III, J.P.; Wei, C. Antibacterial activity of carvacrol, citral, and geraniol against Salmonella typhimurium in culture medium and on fish cubes. J. Food Sci. 1995, 60, 1364–1368.
- Guerreiro, A.C.; Gago, C.M.; Faleiro, M.L.; Miguel, M.G.; Antunes, M.D. Edible coatings enriched with essential oils for extending the shelf-life of ‘Bravo de Esmolfe’fresh-cut apples. Int. J. Food Sci. Technol. 2016, 51, 87–95.
- Chien, S.-Y.; Sheen, S.; Sommers, C.; Sheen, L.-Y. Modeling the inactivation of Escherichia coli O157: H7 and uropathogenic E. coli in ground beef by high pressure processing and citral. Food Control 2017, 73, 672–680.
- Ju, J.; Xie, Y.; Yu, H.; Guo, Y.; Cheng, Y.; Zhang, R.; Yao, W. Synergistic inhibition effect of citral and eugenol against Aspergillus niger and their application in bread preservation. Food Chem. 2020, 310, 125974.
- López-Romero, J.C.; García-Dávila, J.; Peña-Ramos, E.A.; González-Ríos, H.; Valenzuela-Melendres, M.; Osoria, M.; Juneja, V.K. Effect of Citral on the Thermal Inactivation of Escherichia coli O104: H4 in Ground Beef. J. Food Prot. 2022, 85, 1635–1639.
- Nordin, N.; Yeap, S.K.; Rahman, H.S.; Zamberi, N.R.; Abu, N.; Mohamad, N.E.; How, C.W.; Masarudin, M.J.; Abdullah, R.; Alitheen, N.B. In vitro cytotoxicity and anticancer effects of citral nanostructured lipid carrier on MDA MBA-231 human breast cancer cells. Sci. Rep. 2019, 9, 1614.
- Thielmann, J.; Theobald, M.; Wutz, A.; Krolo, T.; Buergy, A.; Niederhofer, J.; Welle, F.; Muranyi, P. Litsea cubeba fruit essential oil and its major constituent citral as volatile agents in an antimicrobial packaging material. Food Microbiol. 2021, 96, 103725.
- Cao, J.; Liu, H.; Wang, Y.; He, X.; Jiang, H.; Yao, J.; Xia, F.; Zhao, Y.; Chen, X. Antimicrobial and antivirulence efficacies of citral against foodborne pathogen Vibrio parahaemolyticus RIMD2210633. Food Control 2021, 120, 107507.
- Aiemsaard, J.; Aiumlamai, S.; Aromdee, C.; Taweechaisupapong, S.; Khunkitti, W. The effect of lemongrass oil and its major components on clinical isolate mastitis pathogens and their mechanisms of action on Staphylococcus aureus DMST 4745. Res. Vet. Sci. 2011, 91, e31–e37.
- Chueca, B.; Pagán, R.; García-Gonzalo, D. Oxygenated monoterpenes citral and carvacrol cause oxidative damage in Escherichia coli without the involvement of tricarboxylic acid cycle and Fenton reaction. Int. J. Food Microbiol. 2014, 189, 126–131.
- Espina, L.; Berdejo, D.; Alfonso, P.; García-Gonzalo, D.; Pagán, R. Potential use of carvacrol and citral to inactivate biofilm cells and eliminate biofouling. Food Control 2017, 82, 256–265.
- Silva-Angulo, A.; Zanini, S.; Rosenthal, A.; Rodrigo, D.; Klein, G.; Martínez, A. Combined effect of carvacrol and citral on the growth of Listeria monocytogenes and Listeria innocua and on the occurrence of damaged cells. Food Control 2015, 53, 156–162.
- Zanini, S.; Silva-Angulo, A.; Rosenthal, A.; Rodrigo, D.; Martínez, A. Effect of citral and carvacrol on the susceptibility of Listeria monocytogenes and Listeria innocua to antibiotics. Lett. Appl. Microbiol. 2014, 58, 486–492.
- Dubois-Brissonnet, F.; Naïtali, M.; Mafu, A.A.; Briandet, R.J.A.; Microbiology, E. Induction of fatty acid composition modifications and tolerance to biocides in Salmonella enterica serovar Typhimurium by plant-derived terpenes. Appl. Environ. Microbiol. 2011, 77, 906–910.
- Wang, Y.; Lin, W.; Yan, H.; Neng, J.; Zheng, Y.; Yang, K.; Xing, F.; Sun, P. iTRAQ proteome analysis of the antifungal mechanism of citral on mycelial growth and OTA production in Aspergillus ochraceus. J. Sci. Food 2021, 101, 4969–4979.
- Cao, Y.; Zhou, D.; Zhang, X.; Xiao, X.; Yu, Y.; Li, X. Synergistic effect of citral and carvacrol and their combination with mild heat against Cronobacter sakazakii CICC 21544 in reconstituted infant formula. LWT 2021, 138, 110617.
- Zheng, S.; Jing, G.; Wang, X.; Ouyang, Q.; Jia, L.; Tao, N. Citral exerts its antifungal activity against Penicillium digitatum by affecting the mitochondrial morphology and function. Food Chem. 2015, 178, 76–81.
- Scariot, F.J.; Pansera, M.S.; Delamare, A.P.L.; Echeverrigaray, S.J. Citral and geraniol induce necrotic and apoptotic cell death on Saccharomyces cerevisiae. World J. Microbiol. Biotechnol. 2021, 37, 1–10.
- Cai, R.; Hu, M.; Zhang, Y.; Niu, C.; Yue, T.; Yuan, Y.; Wang, Z. Antifungal activity and mechanism of citral, limonene and eugenol against Zygosaccharomyces rouxii. LWT 2019, 106, 50–56.
- Leite, M.C.A.; Bezerra, A.P.d.B.; Sousa, J.P.d.; Guerra, F.Q.S.; Lima, E.d.O. Evaluation of Antifungal Activity and Mechanism of Action of Citral against Candida albicans. Evid.-Based Complement. Altern. Med. 2014, 2014, 378280.
- Wang, L.; Jiang, N.; Wang, D.; Wang, M. Effects of essential oil citral on the growth, mycotoxin biosynthesis and transcriptomic profile of Alternaria alternata. Toxins 2019, 11, 553.
- OuYang, Q.; Tao, N.; Zhang, M. A damaged oxidative phosphorylation mechanism is involved in the antifungal activity of citral against Penicillium digitatum. Front. Microbiol. 2018, 9, 239.
- Tang, N.; Chen, N.; Hu, N.; Deng, W.; Chen, Z.; Li, Z. Comparative metabolomics and transcriptomic profiling reveal the mechanism of fruit quality deterioration and the resistance of citrus fruit against Penicillium digitatum. Postharvest Biol. Technol. 2018, 145, 61–73.
- Mohd Izham, M.N.; Hussin, Y.; Aziz, M.N.M.; Yeap, S.K.; Rahman, H.S.; Masarudin, M.J.; Mohamad, N.E.; Abdullah, R.; Alitheen, N.B. Preparation and characterization of self nano-emulsifying drug delivery system loaded with citraland its antiproliferative effect on colorectal cells in vitro. Nanomaterials 2019, 9, 1028.
- Sheikh, B.Y.; Sarker, M.M.R.; Kamarudin, M.N.A.; Mohan, G. Antiproliferative and apoptosis inducing effects of citral via p53 and ROS-induced mitochondrial-mediated apoptosis in human colorectal HCT116 and HT29 cell lines. Biomed. Pharmacother. 2017, 96, 834–846.
- Fitsiou, E.; Karafoulidou, E.; Arabatzis, S.; Vlachou, D.; Kotsianidis, I.; Pappa, A. Evaluation of the anticancer potential of Lippia citriodora and its major component, citral, and their potential synergy with conventional chemotherapeutic drugs in human colon carcinoma. Facta Univ. Ser. Phys. Chem. Technol. 2018, 16, 175.
- Balusamy, S.R.; Ramani, S.; Natarajan, S.; Kim, Y.J.; Perumalsamy, H. Integrated transcriptome and in vitro analysis revealed anti-proliferative effect of citral in human stomach cancer through apoptosis. Sci. Rep. 2019, 9, 4883.
- Sanches, L.J.; Marinello, P.C.; Panis, C.; Fagundes, T.R.; Morgado-Díaz, J.A.; de-Freitas-Junior, J.C.M.; Cecchini, R.; Cecchini, A.L.; Luiz, R.C. Cytotoxicity of citral against melanoma cells: The involvement of oxidative stress generation and cell growth protein reduction. Tumor Biol. 2017, 39, 1010428317695914.
- Upekkhawong, L.; Tohtong, R. Study of Anti-Cancer Activity of Citral against Cholangiocarcinoma Cell Lines. NGRC Congressional. 2020. Available online: https://api.semanticscholar.org/CorpusID:231696310 (accessed on 22 June 2023).
- Balusamy, S.R.; Perumalsamy, H.; Veerappan, K.; Huq, M.A.; Rajeshkumar, S.; Lakshmi, T.; Kim, Y.J. Citral induced apoptosis through modulation of key genes involved in fatty acid biosynthesis in human prostate cancer cells: In silico and in vitro study. BioMed Res. Int. 2020, 2020, 6040727.
- Di Mola, A.; Massa, A.; De Feo, V.; Basile, A.; Pascale, M.; Aquino, R.P.; De Caprariis, P.J.M.C.R. Effect of citral and citral related compounds on viability of pancreatic and human B-lymphoma cell lines. Med. Chem. Res. 2017, 26, 631–639.
- Szkoda, B.E. The Effects of Citral on Caspase-3 Activation in M624 and Hacat Cells. Ph.D. Thesis, Marietta College, Marietta, OH, USA, 2016.
- Zielińska, A.; Martins-Gomes, C.; Ferreira, N.R.; Silva, A.M.; Nowak, I.; Souto, E.B. Anti-inflammatory and anti-cancer activity of citral: Optimization of citral-loaded solid lipid nanoparticles (SLN) using experimental factorial design and LUMiSizer®. Int. J. Pharm. 2018, 553, 428–440.
- Bachiega, T.F.; Sforcin, J.M. Lemongrass and citral effect on cytokines production by murine macrophages. J. Ethnopharmacol. 2011, 137, 909–913.
- Long, N.; Tang, H.; Sun, F.; Lin, L.; Dai, M. Effect and mechanism of citral against methicillin-resistant Staphylococcus aureus in vivo. J. Sci. Food Agric. 2019, 99, 4423–4429.
- Zarandi, M.H.; Sharifiyazdi, H.; Nazifi, S.; Ghaemi, M.; Bakhtyari, M.K. Effects of citral on serum inflammatory factors and liver gene expression of IL-6 and TNF-alpha in experimental diabetes. Comp. Clin. Pathol. 2021, 30, 351–361.
- Gonçalves, E.C.D.; Assis, P.M.; Junqueira, L.A.; Cola, M.; Santos, A.R.S.; Raposo, N.R.B.; Dutra, R.C. Citral Inhibits the Inflammatory Response and Hyperalgesia in Mice: The Role of TLR4, TLR2/Dectin-1, and CB2 Cannabinoid Receptor/ATP-Sensitive K+ Channel Pathways. J. Nat. Prod. 2020, 83, 1190–1200.
- Emílio-Silva, M.T.; Rodrigues, V.P.; Bueno, G.; Ohara, R.; Martins, M.G.; Horta-Júnior, J.A.C.; Branco, L.G.S.; Rocha, L.R.M.; Hiruma-Lima, C.A. Hypothermic Effect of Acute Citral Treatment during LPS-induced Systemic Inflammation in Obese Mice: Reduction of Serum TNF-α and Leptin Levels. Biomolecules 2020, 10, 1454.
- Uchida, N.S.; Silva-Filho, S.E.; Cardia, G.F.E.; Cremer, E.; Silva-Comar, F.M.d.S.; Silva, E.L.; Bersani-Amado, C.A.; Cuman, R.K.N. Hepatoprotective Effect of Citral on Acetaminophen-Induced Liver Toxicity in Mice. Evid.-Based Complement. Altern. Med. 2017, 2017, 1796209.
- Shen, Y.; Sun, Z.; Guo, X. Citral inhibits lipopolysaccharide-induced acute lung injury by activating PPAR-γ. Eur. J. Pharmacol. 2015, 747, 45–51.
- Liao, P.-C.; Yang, T.-S.; Chou, J.-C.; Chen, J.; Lee, S.-C.; Kuo, Y.-H.; Ho, C.-L.; Chao, L.K.-P. Anti-inflammatory activity of neral and geranial isolated from fruits of Litsea cubeba Lour. J. Funct. Foods 2015, 19, 248–258.
- Pucci, M.; Raimondo, S.; Zichittella, C.; Tinnirello, V.; Corleone, V.; Aiello, G.; Moschetti, M.; Conigliaro, A.; Fontana, S.; Alessandro, R. Biological Properties of a Citral-Enriched Fraction of Citrus limon Essential Oil. Foods 2020, 9, 1290.
- Han, X.; Parker, T.L. Lemongrass (Cymbopogon flexuosus) essential oil demonstrated anti-inflammatory effect in pre-inflamed human dermal fibroblasts. Biochim. Open 2017, 4, 107–111.
- dos Santos, G.C.M.; Gomes, G.A.; Gonçalves, G.M.; de Sousa, L.M.; Santiago, G.M.P.; de Carvalho, M.G.; Marinho, B.G. Essential Oil from Myrcia ovata: Chemical Composition, Antinociceptive and Anti-Inflammatory Properties in Mice. Planta Med. 2014, 80, 1588–1596.
- Azeredo, C.M.; Soares, M.J. Combination of the essential oil constituents citral, eugenol and thymol enhance their inhibitory effect on Crithidia fasciculata and Trypanosoma cruzi growth. Rev. Bras. Farmacogn. 2013, 23, 762–768.
- Cardoso, J.; Soares, M.J. In vitro effects of citral on Trypanosoma cruzi metacyclogenesis. Mem. Inst. Oswaldo Cruz 2010, 105, 1026–1032.
- Moreno, É.M.; Leal, S.M.; Stashenko, E.E.; García, L.T. Induction of programmed cell death in Trypanosoma cruzi by Lippia alba essential oils and their major and synergistic terpenes (citral, limonene and caryophyllene oxide). BMC Complement. Altern. Med. 2018, 18, 225.
- Rojas Armas, J.; Palacios Agüero, O.; Ortiz Sánchez, J.M.; López de la Peña, L. Evaluación de la toxicidad del aceite esencial de Aloysia triphylla Britton (cedrón) y de la actividad anti-Trypanosoma cruzi del citral, in vivo. In Anales de la Facultad de Medicina; UNMSM, Facultad de Medicina: Lima District, Peru, 2015; pp. 129–134.
- Santin, M.R.; dos Santos, A.O.; Nakamura, C.V.; Dias Filho, B.P.; Ferreira, I.C.P.; Ueda-Nakamura, T. In vitro activity of the essential oil of Cymbopogon citratus and its major component (citral) on Leishmania amazonensis. Parasitol. Res. 2009, 105, 1489–1496.
- Machado, M.; Pires, P.; Dinis, A.; Santos-Rosa, M.; Alves, V.; Salgueiro, L.; Cavaleiro, C.; Sousa, M. Monoterpenic aldehydes as potential anti-Leishmania agents: Activity of Cymbopogon citratus and citral on L. infantum, L. tropica and L. major. Exp. Parasitol. 2012, 130, 223–231.
- Shi, C.; Zhao, X.; Liu, Z.; Meng, R.; Chen, X.; Guo, N. Antimicrobial, antioxidant, and antitumor activity of epsilon-poly-L-lysine and citral, alone or in combination. Food Nutr. Res. 2016, 60, 31891.
- Wang, X.; Cui, Y.; Tian, S.; Zhao, R. Antioxidant activities of oregano oil, carvacrol, citral and cinnamaldehyde. Sci. Technol. Food Ind. 2013, 2013, 72.
- Xu, X.L.; Zhu, Q.; Lv, H.; Wu, W.H.; Lv, M.; Liu, K.H. Isolation and biological activities of citral from sweet orange oilAdv. Mater. Res. 2013, 750–752, 1621–1625.
- Bouzenna, H.; Hfaiedh, N.; Giroux-Metges, M.-A.; Elfeki, A.; Talarmin, H. Biological properties of citral and its potential protective effects against cytotoxicity caused by aspirin in the IEC-6 cells. Biomed. Pharmacother. 2017, 87, 653–660.
- Guimarães, L.G.L.; dasGraças Cardoso, M.; Souza, P.E.; de Andrade, J.; Vieira, S.S. Antioxidant and fungitoxic activities of the lemongrass essential oil and citral. Rev. Cienc. Agron. 2011, 42, 464.
- Chen, P.; Ference, C.; Sun, X.; Lin, Y.; Tan, L.; Zhong, T. Antimicrobial efficacy of liposome-encapsulated citral and its effect on the shelf life of shatangju Mandarin. J. Food Prot. 2020, 83, 1315–1322.
- Prakash, A.; Baskaran, R.; Vadivel, V. Citral nanoemulsion incorporated edible coating to extend the shelf life of fresh cut pineapples. LWT 2020, 118, 108851.
- Sharma, A.; Rajendran, S.; Srivastava, A.; Sharma, S.; Kundu, B. Antifungal activities of selected essential oils against Fusarium oxysporum f. sp. lycopersici 1322, with emphasis on Syzygium aromaticum essential oil. J. Biosci. Bioeng. 2017, 123, 308–313.