Nitrous oxide (N2O) is a greenhouse gas contributing to ozone layer depletion and climate
change. Wastewater treatment plants (WWTPs) contribute significantly to the global anthropogenic
N2O emissions. The main factors affecting N2O emissions are the dissolved oxygen concentration
(DO), the nitrite accumulation, the rapidly changing process conditions, the substrate composition
and COD/N ratio, the pH, and the temperature. Low DO in the nitrification process results in higher
N2O emissions, whereas high aeration rate in the nitration/anammox process results in higher N2O
production. High DO in the denitrification inhibits the N2O reductase synthesis/activity, leading to
N2O accumulation. High nitrite accumulation in both the nitrification and denitrification processes
leads to high N2O emissions. Transient DO changes and rapid shifts in pH result in high N2O
production. Ammonia shock loads leads to incomplete nitrification, resulting in NO2- accumulation
and N2O formation. Limiting the biodegradable substrate hinders complete denitrification, leading
to high N2O production. A COD/N ratio above 4 results in 20–30% of the nitrogen load being
N2O emissions. Maximum N2O production at low pH (pH = 6) was observed during nitrification/
denitrification and at high pH (pH = 8) during partial nitrification. High temperature enhances
the denitrification kinetics but produces more N2O emissions.
- N2O production pathways
- hydroxylamine oxidation
- nitrifier denitrification
- heterotrophic denitrification
- influence of DO
- COD/N
- pH and temperature
- N2O sampling
- N2O measurements

Review
Factors Affecting Nitrous Oxide Emissions from Activated Sludge Wastewater Treatment Plants—A Review
Liana Kemmou and Elisavet Amanatidou *[1]
Laboratory of Environmental Chemistry & Water and Wastewater Treatment, Department of Chemical Engineering, University of Western Macedonia, 50100 Kozani, Greece
* Correspondence: eamanatidou@uowm.gr; Tel.: +30-2461068015
Abstract: Nitrous oxide (N2O) is a greenhouse gas contributing to ozone layer depletion and climate change. Wastewater treatment plants (WWTPs) contribute significantly to the global anthropogenic N2O emissions. The main factors affecting N2O emissions are the dissolved oxygen concentration (DO), the nitrite accumulation, the rapidly changing process conditions, the substrate composition and COD/N ratio, the pH, and the temperature. Low DO in the nitrification process results in higher N2O emissions, whereas high aeration rate in the nitration/anammox process results in higher N2O production. High DO in the denitrification inhibits the N2O reductase synthesis/activity, leading to N2O accumulation. High nitrite accumulation in both the nitrification and denitrification processes leads to high N2O emissions. Transient DO changes and rapid shifts in pH result in high N2O production. Ammonia shock loads leads to incomplete nitrification, resulting in NO2− accumulation and N2O formation. Limiting the biodegradable substrate hinders complete denitrification, leading to high N2O production. A COD/N ratio above 4 results in 20–30% of the nitrogen load being N2O emissions. Maximum N2O production at low pH (pH = 6) was observed during nitrifica- tion/denitrification and at high pH (pH = 8) during partial nitrification. High temperature enhances the denitrification kinetics but produces more N2O emissions.

Citation: Kemmou, L.; Amanatidou,
E. Factors Affecting Nitrous Oxide Emissions from Activated Sludge Wastewater Treatment Plants—A Review. Resources 2023, 12, 114. https://doi.org/10.3390/ resources12100114
Academic Editor: Angel F. Mohedano
Received: 10 July 2023
Revised: 7 September 2023
Accepted: 18 September 2023
Published: 25 September 2023

Copyright: © 2023 by the authors. Licensee MDPI, Basel, Switzerland. This article is an open access article distributed under the terms and conditions of the Creative Commons Attribution (CC BY) license (https:// creativecommons.org/licenses/by/ 4.0/).
Resources 2023, 12, 114. https://doi.org/10.3390/resources12100114 https://www.mdpi.com/journal/resources
Keywords: N2O production pathways; hydroxylamine oxidation; nitrifier denitrification; heterotrophic denitrification; influence of DO; COD/N; pH and temperature; N2O sampling; N2O measurements
Introduction
Wastewater treatment plants (WWTPs) generate significant amounts of greenhouse gases, including carbon dioxide, methane and nitrous oxide [1]. According to the IPCC 2023, the global anthropogenic emissions of greenhouse gases (GHGs) were 59 6.6 GtCO2- eq, about 12% (6.5 GtCO2-eq) higher than in 2010 and 54% (21 GtCO2-eq) higher than in 1990 [2]. The contribution of each gas to the total GHG emissions varies: 79.4% for carbon dioxide, 11.5% for methane, and 6.2% for nitrous oxide, with the remainder consisting of fluorinated gases [3]. Nitrous oxide (N2O) is an important greenhouse gas with a global warming potential (GWP) 273 times that of carbon dioxide (CO2) [2], contributing to ozone layer depletion and climate change [4]. Global N2O emissions were 2.7 1.6 GtCO2-eq, according to the IPCC 2023 [2]. Therefore, even small amounts of N2O emissions can signif- icantly contribute to total GHG emissions. Thus, it can be concluded that the minimization of N2O emissions and the identification of the factors controlling these emissions constitute a great challenge.
Human activities such as agriculture and fossil fuel combustion, along with microbial processes occurring in biological wastewater treatment are the main sources of anthro- pogenic N2O emissions [5–8]. Wastewater treatment as a sector contributes approximately 3% of the global anthropogenic N2O emissions [1,9–11]. This percentage has increased in recent years [12–14]. Yao et al., 2022 reported that wastewater treatment was the fourth- largest source of N2O emissions after agriculture, energy production, and other industrial production activities, accounting for 5.6% of total N2O emissions. N2O emissions origi- nating from sludge disposal and treatment are not included in those from the wastewater treatment sector. The total amounts of N2O produced from sludge incineration, reuse in ce- ment, and composting are 645.0 kg N2O/tonne, 294 kg N2O/tonne and 0.37 kg N2O/tonne, respectively [15]. N2O emission from wastewater management contributes 26% of the total GHGs originating from the water sector, which includes drinking water production, water transport, wastewater and sludge treatment and discharge [10,16].
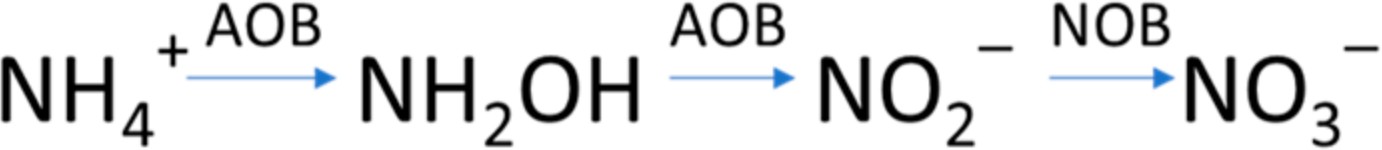
Numerous studies have confirmed that in biological wastewater treatment, the ni- trification and denitrification processes occurring under aerobic and anaerobic/anoxic conditions are generally responsible for N2O emissions [17–26]. The design criteria for con- ventional and extended aeration activated sludge (AS) processes that include nitrification and denitrification are presented in Table 1. Nitrification comprises two coupled processes (Figure 1): (1) ammonium (NH4+) is oxidized to hydroxylamine (NH2OH) and nitrite (NO2) by autotrophic ammonia-oxidizing bacteria (AOB) or by autotrophic ammonia-oxidizing archaea (AOA); (2) NO2− is oxidized to nitrate (NO3−) by nitrite-oxidizing bacteria (NOB) through a reaction known as nitratation [27]. For many decades, it has been known that autotrophic aerobic bacteria are responsible for ammonia and nitrite oxidation. However, under aerobic conditions, a heterotrophic nitrification process can occur, in which inorganic and organic reduced forms of nitrogen are oxidized to nitrate by a wide range of fungi and heterotrophic bacteria [28]. The partial nitrification of ammonia to nitrite is known as nitritation, where the ammonia oxidation is controlled, leading to nitrite instead of nitrate by inhibiting or eliminating nitrite oxidizing bacteria (NOB) under low dissolved oxygen concentrations and high temperatures. During nitritation, ammonia-oxidizing bacteria (AOB) become the dominant nitrifying bacteria, and accumulation of nitrites is achieved [29].
Table 1. Design criteria for conventional and extended aeration activated sludge (AS) processes.
Typical Values
|
Parameters |
Conventional AS Process |
Extended Aeration AS Process |
|
MLSS (mg/L) |
1500–4000 |
2000–6000 |
|
F/M (kgBOD/day/kg MLSS) |
0.2–0.5 |
0.05–0.15 |
|
HRT (hours) |
4–8 |
18–36 |
|
SRT (days) |
5–10 |
20–40 |
|
Cv (kgBOD/day/m3) |
0.4–0.8 |
0.15–0.25 |
Wasted sludge (kg/kg BOD removed)
0.4–0.6 0.15–0.3
 Sludge recycling (%) 50–100 75–150
Figure 1. Nitrification process with ammonia-oxidizing bacteria (AOB) and nitrite-oxidizing bacteria (NOB).
Denitrification is the process by which NO3− is reduced to N2 by heterotrophic anaerobic bacteria using carbon sources as electron donors (Figure 2). The intermediate products of nitrate reduction are NO2−, NO, and N2O [30]. Moreover, heterotrophic denitritation can occur under anaerobic conditions, where nitrite is directly reduced to N2 gas by heterotrophic anaerobic bacteria [21].

Figure 2. Denitrification process by heterotrophic bacteria (HB).
A partial nitritation/anammox process can occur in wastewater treatment processes under low oxygen aerobic conditions, where half of the NH4+ is oxidized to NO2− by AOB
and the remaining NH4+, along with the produced NO2−, is directly converted to nitrogen gas by anammox bacteria [31]. The anammox bacteria were identified by Strous et al., 1999 as an autotrophic member of the order Planctomycetales [32]. Some anammox genera that have been discovered include fresh-water and marine species [33].
Many researchers have investigated the mechanisms of N2O production in WWTPs [5,25,34–41]. It is known that N2O formation pathways include hydroxylamine oxidation, nitrifier denitrification and heterotrophic denitrification [42–48]. The main mechanism favoring N2O production in WWTPs depends on the process configuration and operational parameters [49,50]. Goreau et al., 1980 concluded that the denitrification pathway of AOB was responsible for N2O emissions. In order to reveal possible mecha- nisms of N2O production, many factors affecting N2O emissions have been reported: low dissolved oxygen concentration in aerobic conditions or high dissolved oxygen concen- tration in anoxic conditions, accumulation of nitrite, rapidly changing process conditions, pH, temperature or a low ratio of COD to nitrogen compounds during heterotrophic denitrification [34,51–57].
The aim of this work is to provide a review, using a critical perspective, (a) the possible pathways of N2O production, in order to better understand the formation of N2O in different WWTPs, (b) the factors affecting N2O emissions, and (c) the techniques employed for the measurement of N2O emissions, and the sampling strategies used.
N2O Production Pathways
Many studies have been conducted since 1960 investigating the production mech- anisms of N2O [42–45,58]. It is agreed that N2O can be produced biologically via three pathways: hydroxylamine oxidation, nitrifier denitrification and heterotrophic denitrifica- tion [5,6,42–47,58–61]. N2O can also be formed via abiotic pathways, but this contribution to overall N2O emissions is considered negligible [62]. The main difference among re- searchers lies in the possibility of the production of N2O through pathways related to hydroxylamine oxidation.
-
- Hydroxylamine Oxidation
The oxidation of ammonium to nitrites under aerobic conditions involves a two- step process. In the first step, ammonium is converted to hydroxylamine, and in the second step, hydroxylamine is converted to nitrites through intermediate products. The first step is catalyzed by a membrane-bound ammonia mono-oxygenase (AMO), and the subsequent step is catalyzed by hydroxylamine oxidoreductase (HAO). HAO is an abundant periplasmic cytochrome c of nitrifying chemoautotrophic bacteria Nitrosomonas europaea [63].
Many studies have confirmed that O2 and a pair of electrons are required for the 1st step [6,63,64] while two pairs of electrons are required for the second step. One pair is employed for the oxidation of ammonium to nitrites, and the remaining pair is employed for respiratory electron transfer, terminating in a cytochrome oxidase [63]. However, the complete catalytic cycle of hydroxylamine oxidation to nitrites remains unclear [65]. Different conclusions have been drawn by researchers regarding the intermediate products of the oxidation of hydroxylamine to nitrites.
Igarashi et al., 1997 [45] studied the HAO structure and proposed that the oxidation of hydroxylamine can be divided into two reactions facilitating the simultaneous acceptance and transmission of two electrons. The two reactions occur simultaneously. Hydroxy- lamine is converted into a nitrosyl HNO, and HNO is converted into nitrites. Immediate and continuous oxidation with two electrons is necessary to maintain the electron flow; otherwise, HAO produces N2O or NO from HNO. The intermediates and N2O formed during the oxidation of ammonium to nitrites reported by Igarashi et al., 1997 [45] are presented in Figure 3:
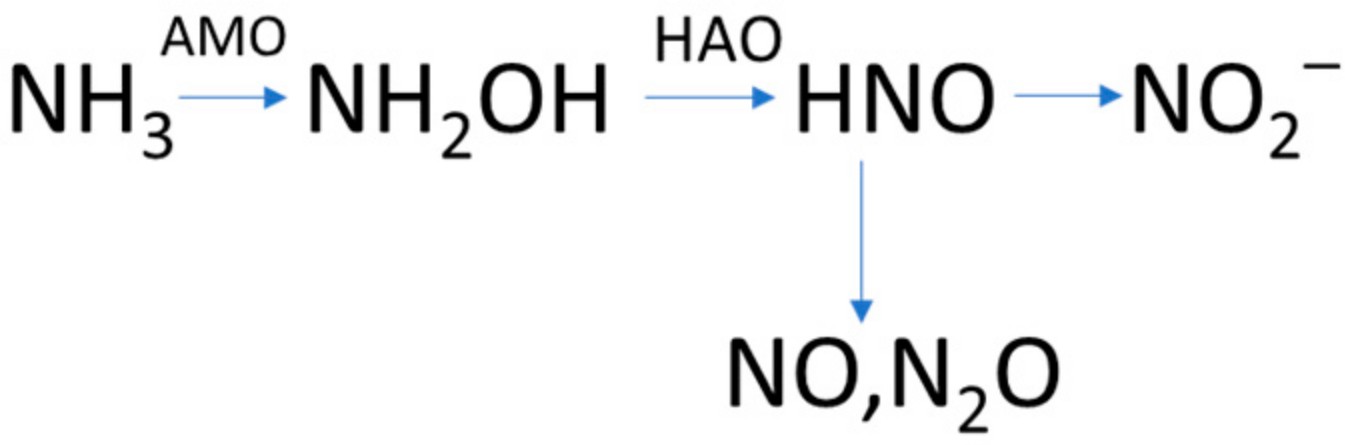
Figure 3. Formation of intermediates and N2O during the oxidation of NH3 to NO2−, adapted from Igarashi et al., 1997 [45].
Chen et al., 2018 [37] agreed with the results of Igarashi et al., 1997 [45] regarding the formation of intermediates and N2O generation pathways during the ammonium oxidation to nitrites. They reported that, under ammonium-oxidizing conditions, O2 or nitrites can be used as the electron acceptor for the oxidation of hydroxylamine to nitrous oxide. These reactions can take place only if hydroxylamine or nitrites have been accumulated (Figure 4). Guo et al., 2018 [39], in agreement with Igarashi et al., 1997 [45], concluded that when conditions are not favorable, hydroxylamine oxidoreductase catalyzes the conversion of hydroxylamine to nitrosyl (NOH), instead to nitrite. The subsequent polymerization and hydrolysis of NOH can yield N2O through the reaction of Equation (1). Caranto et al., 2016 reported that direct production of N2O from hydroxylamine by cytochrome P460 (a c-type heme of hydroxylamine oxidoreductase) under anaerobic conditions can occur [66].
NH2OH −→ 2NOH −→ N2O2H2 −→ N2O + H2O (1)
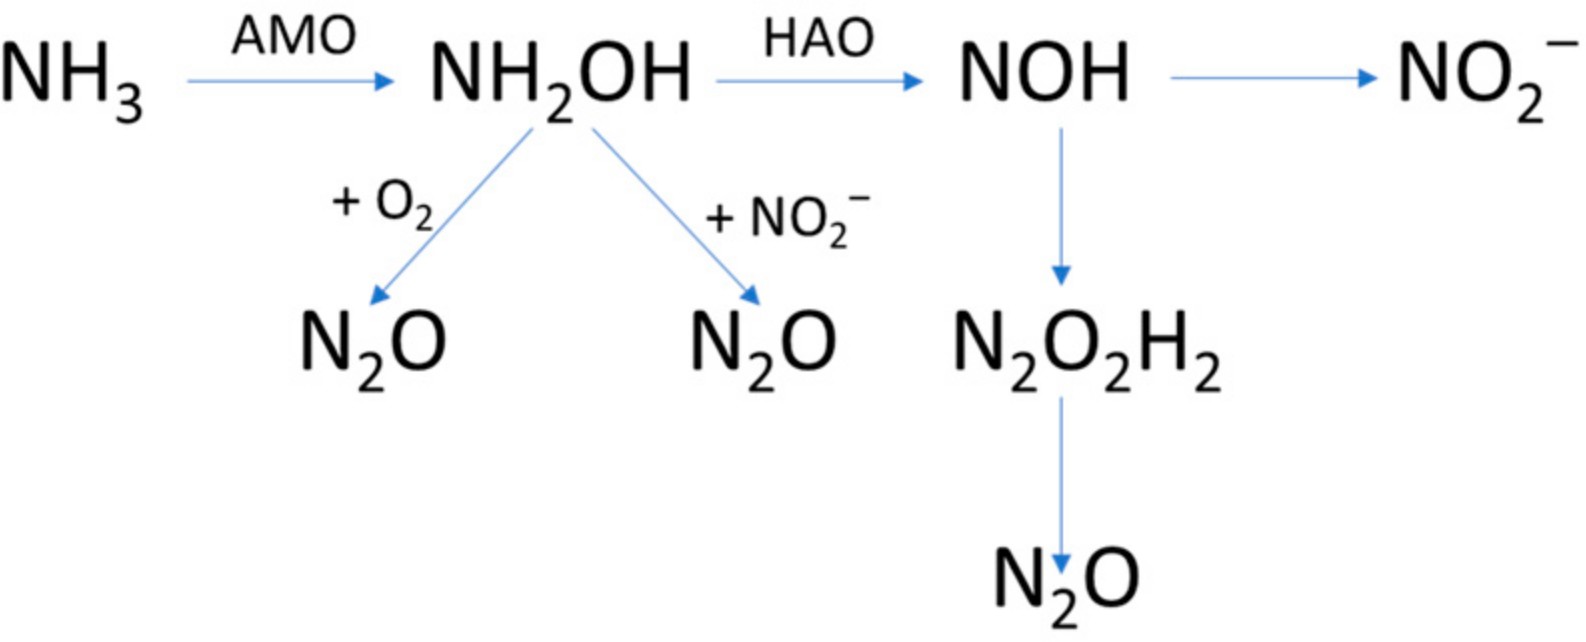
Figure 4. Formation of intermediates and N2O during the oxidation of NH3 to NO2−, adapted from Chen et al., 2018 [37].
Conversely, Anderson 1964 [42] suggested that the metabolism of NH2OH was a two-stage process. In the first stage, NH2OH is dehydrogenated to form NOH (or HNO), which can be further dehydrogenated to NO or to N2O, as described in Equations (2)–(4). In the second stage, NO is converted to NO2− by an enzyme system requiring oxygen (Equation (5)).
NH2OH −→ NOH + 2e− + 2H+ (2) NOH −→ e− + H+ + NO (3)
NOH −→ 0.5N2O + 0.5H2O (4)
NO + H2O −→ NO2−, H+ + e− + H+ (5)
The intermediates and N2O formed during the oxidation of NH3 to NO2−, according to Anderson 1964 [42], are presented in Figure 5. Anderson 1964 [42] concluded that NO was an obligatory intermediate in the oxidation of NH2OH to NO2−. Moreover, Poughon et al., 2001 [46] obtained NO and N2O through several enzymatic and nonenzymatic reactions and confirmed their production directly from the unstable intermediate HNO. They also showed that the production of N2O resulted from the nonenzymatic dehydrogenation of unstable HNO in accordance with Equation (4).

Figure 5. Formation of intermediates and N2O during the oxidation of NH3 to NO2−, adapted from Anderson 1964 [42].
Hooper and Terry 1979 [65], utilizing a sample of purified HAO with low nitrite reductase activity, showed that NO was a product of the hydroxylamine oxidation and was not produced by the reduction of NO2−. The possible inhibition of the HNO to NO oxidation results in the accumulation of N2O. The presence of Mn(II) results in decreased formation of NO and increased formation of N2O. The separate experimental steps of NH2OH oxidation are presented in Equations (6)–(8):
NH2OH −→ HNO (6)
HNO −→ NO (blocked by Mn) (7) NO −→ HNO2 (blocked anaerobically) (8)
Caranto and Lancaster 2017 [35] showed that nitric oxide was not merely a by-product, but rather an obligatory intermediate of the ammonium oxidation to nitrites. They pre- sented a new model for AOB metabolism that implied that there were two obligatory intermediates (hydroxylamine and nitric oxide) during the ammonium oxidation by AOB, and that a mediator was required for the third enzymatic step (Figure 6). They provided evidence that hydroxylamine oxidoreductase oxidizes hydroxylamine with only three electrons to nitric oxide both aerobically and anaerobically. Nitrite found that hydroxy- lamine oxidoreductase activity assays is a nonenzymatic product resulting from the aerobic oxidation of nitric oxide by O2.

Figure 6. Formation of intermediates and N2O during the oxidation of NH3 to NO2−, adapted from Caranto and Lancaster 2017 [35].
As pointed out by Ritchie and Nicholas 1972 [43], NO cannot be considered an obliga- tory intermediate until the enzyme-catalyzed conversion of NO to NO2− has been demon- strated. Yoshida and Alexander 1970 and Ritchie and Nicholas 1972 agreed that N2O was produced by washed cells of Nitrosomonas during the oxidation of ammonia and NH2OH [43,67]. They also indicated N2O2H2 to be an intermediate of the oxidation of hydroxylamine (Figure 7).
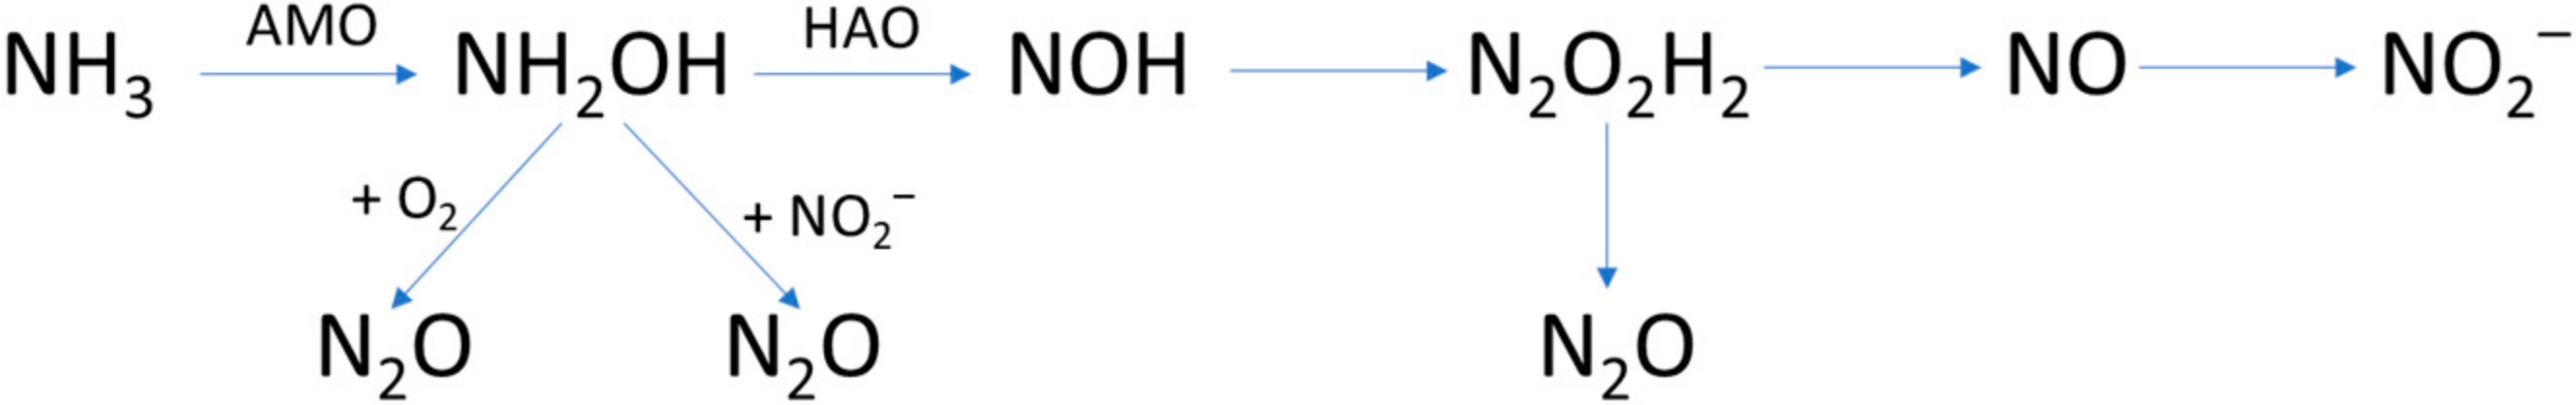
Figure 7. Formation of intermediates and N2O during the oxidation of NH3 to NO2−, adapted from Ritchie and Nicholas 1972 [43].
The N2O production pathways studied by Wunderlin et al., 2012 [5] are in agreement with Ritchie and Nicholas 1972 [43]. Wunderlin et al., 2012 carried out batch tests and
reported that N2O production occurred during biological hydroxylamine oxidation, and intermediates such as HNO or N2O2H2 are directly involved in its formation [43,46]. Wunderlin et al., 2012 [5] also investigated chemical N2O production. Tests were conducted with the addition of hydroxylamine to tap H2O. Low amounts of N2O were formed under oxic conditions but were slightly increased when nitrites were added. Thus, hydroxylamine chemical decomposition and a chemical reaction between hydroxylamine and nitrites could be potential sources of N2O formation. The proposed mechanism is presented in Equations (9) and (10) [43,68]:
NH2OH + 0.5O2 −→ 0.5N2O + 1.5H2O (9)
NH2OH + NO2− + H+ −→ N2O + 2H2O (10)
Massara et al., 2018 [38] described the N2O emissions in municipal WWTPs by de- veloping an ASM2d-N2O model. The formation of intermediates and N2O during the oxidation of NH3 to NO2− are summarized below (Figure 8):

Figure 8. Formation of intermediates and N2O during the oxidation of NH3 to NO2−, adapted from Massara et al., 2018 [38].
Wan et al., 2019 [41] set up a one-stage partial nitrification process (nitritation-anammox reactor), which was in agreement with the N2O production pathways described by Massara et al., 2018 [38]. Wan et al., 2019 [41] also reported the production of N2O by NOB with pyruvate as an electron donor.
-
- Heterotrophic Denitrification
N2O is an intermediate for the heterotrophic denitrification pathway. During denitrifi- cation, nitrates are reduced to nitrites catalyzed by nitrate reductase (NaR), then nitrites to nitric oxide catalyzed by nitrite reductase (NiR), nitric oxide to nitrous oxide catalyzed by nitric oxide reductase (NOR), and, lastly, nitrous oxide to diatomic molecule nitrogen catalyzed by nitrous oxide reductase (N2OR) [28,28,59]. During complete denitrification, consumption of N2O is observed.
-
- Nitrifier Denitrification
AOB contain a periplasmic copper containing NiR and NOR [69,70]. NiR could speed up NH2OH oxidation by channeling electrons from the cytochrome pool to NO2− (to form NO), thus playing a facilitative role in NH3 oxidation itself [69,70]. AOB also possess the inventory to alternatively convert NO into N2O, using a haem-copper nitric oxide reductase, sNOR [70]. Thus, during nitrifier denitrification, nitrites are reduced to NO, NO is reduced to N2O, and then N2O is reduced to diatomic molecular nitrogen by autotrophic ammonium-oxidizing bacteria. However, only genes encoding nitrite and nitric oxide reductases are found in the ammonium-oxidizing bacteria genome, and not nitrous oxide reductase. This means that nitrous oxide, rather than diatomic molecular nitrogen, is the end product of the nitrifier denitrification pathway [71]. Many researchers have suggested that N2O production can be attributed to a pathway involving nitrifier denitrification by ammonia-oxidizing bacteria, especially under anoxic conditions [49,51,71–74]. Kim et al., 2010 also demonstrated that nitrifier denitrification by ammonia-oxidizing bacteria is a ma- jor source for nitrous oxide production in an activated sludge under nitrifying conditions.
-
- Abiotic Pathways
Hydroxylamine and nitrites are intermediates during the oxidation of ammonium to nitrates (nitrification), and they can be involved in the chemical reactions that yield N2O, especially in the presence of trace metals [62]. Hydroxylamine can be oxidized by oxygen or react with nitrous acid (HNO2) to generate N2O in abiotic conditions [75]. The contribution of this abiotic pathway to N2O production is not considered negligible in several nitrogen removal processes, e.g., the partial nitrification (nitritation) process [75]. Hydroxylamine can be oxidized by Fe (III) to form N2O, but in this reaction, the formation of N2O can occur in acidic pH and in soils rather than in WWTPs [76]. Ferrous iron [Fe (II)] can reduce nitrites to nitric oxide, and in the second reaction step, nitric oxide to N2O [76]. The contribution of this abiotic pathway to N2O production is significant in wastewater treatment only if nitrites and Fe (II) are present concomitantly [77]. N2O can be abiotically formed by the degradation of hydroxylamine in the presence of air and low concentrations of copper [78]. Although in most previous studies the contribution of these chemical reactions was considered negligible or unimportant, they are likely to be enhanced in wastewater containing heavy metals [79].
Factors That Affect N2O Emissions
According to different N2O production pathways, the main factors affecting N2O emissions are the dissolved oxygen concentration (DO), the nitrite accumulation, the rapidly changing process conditions (e.g., high ammonia concentration and oxygen limitation), the substrate composition and COD/N ratio, the pH, and the temperature. The climatic zone, the location, the performance, and the influent characteristics of WWTPs also influence N2O emissions. These factors are dependent on the various microorganism species (AOB, NOB, AOA), whereas the microorganisms present in each process are dependent on the substrate and process conditions.
-
- Dissolved Oxygen Concentrations (DO)
The dissolved oxygen concentration is considered a very important parameter control- ling N2O emissions during nitrification (nitration) or nitritation. Low DO concentrations during nitrification result in high N2O emissions, which can be attributed to nitrifier deni- trification (see Section 2.3) [49,51,52,55,80–82]. Li et al., 2015 investigated the synergistic effect of DO and pH on N2O emissions in a pilot-scale SBR process and reported that when DO was decreased from 3 to 0.5 mg/L, more NO2− was accumulated, resulting in N2O production (nitrifier denitrification). Similar observations were made by Zheng et al., 1994 reporting that at DO < 1 mg/L N2O production increased, due to nitrifier denitrification. A weak negative correlation between DO concentration and dissolved N2O emissions (Spearman’s correlation coefficient equal to 0.7) was confirmed by Vasilaki et al., 2020. In addition to nitrifier denitrification, the hydroxylamine oxidation pathway was found to contribute to N2O emissions in the study of Peng et al., 2014. They demonstrated that the specific N2O production rate increased from 0 to 1.9 mgN2O-N/h/grVSS when DO concentration was increased from 0 to 3 mg/L [83]. With an increase in DO from 0.2 to 3 mg/L, the contribution of nitrifier denitrification by AOB decreased from 92% to 73%, ac- companied by a corresponding increase in the contribution by the hydroxylamine oxidation pathway [83]. The transition from anoxic to aerobic conditions resulted in the accumula- tion of hydroxylamine and the formation of N2O through the hydroxylamine oxidation pathway [70]. High N2O production was observed under an increased aeration rate in a partial nitritation anammox reactor [31,41,84]. The stronger aeration, accompanied by an increased DO, stimulates stripping, leading to an increased proportion of the produced N2O leaving via the gas phase [41].
−
Dissolved oxygen affects N2O production during denitrification by inhibiting the
synthesis and activity of nitrous oxide reductase, and its activity has been found to stop immediately when the denitrifying bacteria move from an anaerobic to an aerobic environ-
ment [28]. Nitrite reductase activity continues at a lower rate under the same transition, so that nitrous oxide emissions will occur [6].
-
- Nitrite Accumulation
Nitrites are formed by AOB ammonium oxidation and by the reduction of het- erotrophic bacteria nitrates. NO2− plays a key role in nitrous oxide production. NO2− accumulation increases nitrous oxide emissions during nitrification and denitrification.
During nitrification, increased nitrite concentrations can lead to increased nitrifier denitrification by AOB and increased N2O emissions [6,17,34,54,56,57,71,85]. High nitrite concentrations and low DO concentrations are known triggers for nitrite reductase and nitric oxide reductase expression in AOB, which favors N2O production through the nitrifier denitrification pathway [86].
During nitritation–denitritation applying SBR process, increased nitrous oxide emis- sions were observed at high NO2− concentrations and DO < 1.5 mg/L [87]. This was related to a promoted expression of nitric oxide reductase gene or increased activity of NO2− re- ductase with increasing substrate concentration [88]. Thus, at lower DO (<1.5 mg/L), AOB denitrification was possibly responsible for N2O production during nitritation.
In heterotrophic denitrification, high NO2− concentrations inhibit complete denitrifi-
cation, resulting in nitric oxide and nitrous oxide accumulation and increased nitrous oxide emissions [24,89–93]. Under elevated NO2− concentrations, NiR, NOR and N2OR compete for electrons [94]. Limited generation of nitric oxide reductase under high concentrations of NO2− during denitrification has also been observed, resulting in NO accumulation [89]. This can further affect nitrous oxide emissions, as nitric oxide inhibits the activity of the enzymes involved in the denitrification process.
-
- Rapidly Changing Process Conditions
In many studies, elevated nitrous oxide emissions were reported when the process conditions were changed rapidly (e.g., high ammonia concentration and oxygen limita- tion) [83,95]. Ammonia shock loads lead to incomplete nitrification, resulting in decreased nitrogen removal efficiency, NO2− accumulation and N2O formation. Thus, the perfor- mance of the wastewater treatment plant also influences N2O production. Oxygen limita- tion during nitrification could result in NO2− accumulation and N2O formation (nitrifier denitrification pathway).
Bacterial metabolism likely necessitates a period of adjustment to adapt to shifts in process conditions, leading to significant peaks in nitrous oxide emissions. Variations in bioreactors have also been observed, e.g., a decline in DO concentration owing to elevated influent loading or aeration rate limitation [95,96], resulting in increased N2O production through the nitrifier denitrification pathway (see Section 2.3). Furthermore, the transition from anoxic conditions to aerobic conditions with the presence of accumulated NH4+ resulted in N2O formation, suggesting that the hydroxylamine oxidation pathway is an important contributor in the formation of N2O [31,70,97].
-
- Substrate Composition and COD/N Ratio
The influent characteristics of a WWTP affect nitrous oxide emissions. The composition of different organic substrates is a major factor contributing to N2O emissions. Limiting availability of biodegradable organic carbon hinders complete denitrification, resulting in N2O accumulation [98,99], whereas excess carbon decreases N2O production. Influent nitrogen plays an important role in N2O emissions [5,6]. Thus, the COD/N ratio is an important factor controlling N2O production.
Several researchers have investigated the effect of organic substrates on N2O emissions on the basis of experiments conducted at lab-scale using methanol, sodium acetate and mannitol as carbon sources [100–102]. In the study of Song et al., 2015, lower N2O emissions were observed in the case of acetate compared to those emitted when using methanol as the carbon source. The N2O emission factor was 2.3% of influent nitrogen for the methanol
and 1.3% of influent nitrogen for the acetate, which was attributed to the fact that the biomass became more abundant in bacteria capable of reducing N2O with acetate as carbon source [100]. Conversely, in the study of Adouani et al., 2010, the results showed that the highest N2O and NO emissions were generated when using acetate as the carbon source, which was attributed to the diversity of denitrifying bacteria and their distinct metabolic pathways towards the added carbon substrates. The use of mannitol instead of sodium acetate as a carbon source resulted in lower N2O conversion rates (21% for mannitol and 41% for sodium acetate) [102]. Microbial analysis showed that mannitol lowered the N2OR enzyme inhibition caused by the high nitrite concentration in the partial nitrification system, thus enhancing heterotrophic denitrification. The presence of trace metals (e.g., Fe(II), Fe(III), Cu(II)) and other compounds in the substrate may affect N2O emissions through abiotic reactions [62,69,70,76]. N2O accumulation can be observed in the absence of sufficient Cu in natural waters or in the formation of nonbioavailable complexes with copper [103,104].
Increased N2O emissions were observed during denitrification when the availability of biodegradable organic carbon was limited [98,99]. N2OR is less competitive under limited COD, leading to N2O production [94,105]. Schalk-Otte et al., 2000 conducted experiments in a pure culture, observing that when the availability of organic carbon became limited, 32–64% of the nitrogen load was emitted as nitrous oxide [106]. The various denitrification enzymes (NaR, NiR, NOR and N2OR) compete for electrons when conditions of limited carbon sources are favored. NaR and NiR have relatively higher affinity for electrons than NOR and N2OR [107], resulting in incomplete denitrification and N2O formation. Another cause for increased N2O emissions under conditions in which organic carbon is limited is the microbial consumption of internal storage compounds [6]. Nitrous oxide production is reduced when excess carbon is provided for the removal of electron competition [18].
Regarding the effect of different COD/N ratios (1.5, 2.5, 3.5 and 4.5) on N2O emissions, it was shown that the highest N2O production was obtained under the lowest COD/N ratio in laboratory-scale experiments [108]. Similar observations were made in the studies of Itokawa et al., 2001 and Andalib et al., 2018, where the highest N2O production was reported when the COD/N ratio was below 3.5 [109,110]. Thus, it can be concluded that low COD/N ratios correspond to high nitrogen load in the influent, resulting in elevated N2O production. Moreover, according to Law et al., 2012a, for complete denitrification, a COD/N ratio above 4 is required, with the optimal ratio ranging from 4 to 5 [111]. In agreement with the above statements, Gruber et al., 2021 demonstrated a weak positive correlation between C/N ratio and the N2O emission factor [112]. However, Quan et al., 2012, employing three lab-scale aerobic granular SBRs, reported that lowering the nitrogen loading rate or, equivalently, raising the COD/N ratio did not hinder the heterotrophic denitrification process [113].
-
- pH and Temperature
One of the major factors affecting nitrification in wastewater treatment is pH. Nitrifi- cation systems are sensitive to variations in pH [114]. Wastewater biological nitrification processes are accompanied by DO consumption and pH reduction. Although the optimal pH range for complete nitrification varies between 7.5 and 8 [28,30], the optimum pH for AOB and NOB growth ranges from 8.5 to 8.8 and from 8.3 to 9.3, respectively [115]. Thus, the activity of AOB and NOB can be affected by changes in pH [116], and pH can also cause changes in the concentrations of free ammonia (FA) and free nitrous acid (FNA) (Equations (11) and (12)).
NH+ ↔ NH3 + H+ (11)
4
NO2− + H2O ↔ HNO2 + OH− (12)
High pH shifts the equilibrium to FA, which is the substrate of AOB [117], and is inhibitory to nitrite-oxidizing bacteria (NOB) [118,119]. The ranges of FA concentrations
that begin to inhibit nitrifying organisms are: 10 to 150 mg/L for AOB and 0.1 to 1.0 mg/L for NOB [118]. Low pH increases the FNA concentration, which inhibits both AOB and NOB [4,120]. The inhibition of both AOB and NOB was initiated at concentrations of FNA between 0. 22 and 2.8 mg/L [118].
During nitrification, the highest N2O production was observed at the lowest applied pH (pH = 6.0) [81]. NOB are strongly affected by low pH values (no activity was detected at pH =6.5) [121], thus resulting in the accumulation of nitrites. No inhibition was observed at high pH values (the activity was nearly the same for the pH range 7.5–9.95) [121]. In the partial nitrification (nitritation) process at DO = 0.7 mg/L, accumulation of nitrites was observed at high pH (pH = 7.85) [122], thus resulting in high N2O production.
During denitrification, N2O formation was observed at pH below 6.8 [123]. Similar observations were made by Hanaki et al., 1992, showing that the maximum N2O emissions occurred when pH decreased from 8 to 6.5. This was attributed to N2O reduction rate decreasing at low pH, resulting in N2O accumulation [124].
Wastewater temperature plays a significant role during nitrification. The mass transfer, chemical equilibrium and growth rate of both AOB and NOB are affected by tempera- ture [116], and it could consequently be a major factor influencing nitrous oxide emissions. The temperatures at which the growth rates of AOB and NOB are maximized are 35 ◦C and 38 ◦C, respectively [125]. Van Hulle et al., 2007 suggested that the optimal temperatures for partial nitrification range from 35 ◦C to 45 ◦C [126]. However, only short-term effects on temperature were studied. Prolonged exposure to temperatures higher than 40 ◦C is likely to result in deactivation [127]. Hellinga et al., 1998 reported that at temperatures higher than 25 ◦C, the AOB specific growth rate increases and becomes higher than that of NOB. NOB can be washed out in activated sludge processes operating with high temperatures (30–35 ◦C), leading to the accumulation of nitrites and elevated N2O emissions due to the nitrifier denitrification pathway [128].
It is known that denitrification rates increase with increasing temperature [129]. It is also known that increasing temperature decreases the solubility of N2O. With a temperature increase from 25 ◦C to 35 ◦C, a reduction in the solubility of nitrous oxide in water of 23% was observed [130]. Thus, nitrous oxide solubility plays a key role in controlling nitrous oxide emissions [131]. A low nitrous oxide solubility at elevated temperature leads to more N2O leaving the liquid phase before complete denitrification can be accomplished. Increasing the temperature from 10 ◦C to 20 ◦C leads to higher N2O emissions (a 2.5-fold increase was measured in nitrous oxide emissions) [36]. Poh et al., 2015 investigated the impact of temperature on nitrous oxide emissions during denitrification. The specific reduction rates of nitrates, nitrites and nitrous oxide increased by 62%, 61% and 41%, respectively, when the temperature was increased from 25 ◦C to 35 ◦C. At 35 ◦C, although a higher N2O reduction rate was observed, N2O became less soluble in the mixed liquor, meaning that stripping was occurring more intensively. Thus, the dissolved N2O was found to decrease continuously during the experiment because the stripping was occurring faster. As a result, although high temperatures are employed to increase the denitrification kinetics, they are expected to produce more emissions in the end.
The climate zone and the location of the WWTP also affect N2O emissions. Gruber et al., 2021 attributed the difference in N2O emissions factors between a WWTP in Finland and a WWTP in Switzerland to the influent characteristics and the climate zone. At the Viikinmäki WWTP in Finland, the seasonal dynamics in wastewater temperature are extremely strong due to the snow melting season occurring in March–April (8.8 ◦C). Reaction rates are known to slow down with decreasing temperature, thus resulting in low N2O emissions [132].
N2O Sampling Strategies and Measurement Techniques
Since 1980, a variety of different methods for performing N2O measurements in WWTPs have been developed [5,9,18,24,36,89,108,133–137], while various sampling strate-
gies have been used to facilitate either dissolved and/or gaseous N2O measure- ments [22,23,25,26,40,138–140].
According to literature, different sampling strategies have been employed for the quantification of N2O emissions. Taking samples online for twenty-four hours or online for one week and grabbing a single sample are sampling strategies used in WWTPs. The large variability in N2O emissions can be attributed to differences in the sampling methods, whereas real differences in emissions are attributable to the plant performance and show both diurnal and seasonal fluctuations [141]. Gas sampling locations depend on the tank geometry and the type of aeration system. The sampling point chosen should cover an area of at least 2% of the total tank surface [142].
Sampling protocols should be developed based on the configuration of the WWTP (e.g., the choice of sampling points). The grab-sampling technique used for gaseous fluxes does not always include sampling performed during weekends or at night, resulting in an inade- quate representation of the daily fluctuations in N2O emissions [143]. Furthermore, short- term monitoring campaigns are often unable to record the daily N2O fluctuations [132,144], leading to the underestimation of N2O emissions. The emission factors assessed (0.8–2.9% of the total nitrogen loads) during long-term monitoring campaigns have been shown to be substantially higher than those found by many short-term campaigns [112]. Daelman et al., 2013b suggested that in order to quantify N2O emissions accurately, it is necessary to employ long-term or grab-sampling monitoring campaigns that take into account seasonal temperature fluctuations [145]. In the study by Gujer 2007, in which a long-term monitoring campaign was performed, the seasonal emission patterns were characterized by elevated N2O emissions during the spring season and reduced emissions during autumn [146], whereas in the study of Vieira et al., 2019, elevated N2O emissions were reported during autumn and reduced emissions during spring in a short-term monitoring campaign. The above discrepancy can be attributed to the different operational conditions and microbial species present in each process. There have been fifteen continuous long-term monitoring campaigns with 1 year duration [12,26,60,112,132,144] in which the emission factors were elevated compared to those reported in short-term campaigns [12,60,132,143,144]. Many studies have used default values referred to as emissions factors for the estimation of N2O emissions estimation [6,18,147].
Emission factors are defined as the amount of N2O emitted relative to the influent nitrogen load. The current default N2O emission factor, proposed by IPCC 2023, is 1.6% of the influent nitrogen [2]. Studies have reported that there are wide variations in N2O emission factors in lab- and full-scale WWTPs. Law et al., 2012a demonstrated emission factors ranging from 0% to 25% in different full-scale WWTPs. This variation can be attributed to the different process configurations and dynamic conditions in each case. Ahn et al., 2010 reported emission factors from 0.01% to 1.8% relative to the influent TKN. Foley et al., 2010, investigating seven full-scale WWTPs with various configurations, concluded an N2O emission factor range of 0.6–25.3% relative to the denitrified nitrogen. Bai et al., 2023 determined an emission factor of 0.09% (gr N2O-N/gr TN removed) [148]. Hanaki et al., 1992, conducting lab-scale experiments, reported emission factors ranging from 0 to 8% of the nitrogen load. The different quantification methods and sampling strategies used in each process influence the N2O emission factors.
The lack of standardized measurement methods and the difficulties associated with quantifying N2O emissions from full-scale WWTPs have led to estimations of N2O emis- sions based on models without the input of measured data [6]. For this reason, different empirical methods have been developed to estimate and evaluate N2O emissions in WWTPs by applying fixed (default) emission factors [149–153]. According to literature, the applica- tion of fixed emission factors does not respond to the large variations in N2O emissions, may underestimate emission levels, and does not take into account the impact of the different process conditions and plant configurations [154]. In recent years, calibrated mathematical models adopting real data concerning N2O production in WWTPs have been developed for investigating the factors favoring N2O emissions in WWTPs. These models
constitute extensions of the ASM model that focus on one or more possible pathways of N2O formation, but there is a great variety in their structure depending on the number of pathways included, and their stoichiometry, kinetics, process configuration and opera- tional characteristics [155–157]. This problem, together with the lack of real data for model calibration, complicates model application and makes the comparison of results difficult. The standardization of measurement methods, and the improvement of instrumentation for accurate measurements, together with long-term monitoring data, can make models a useful, reliable and widely applied tool for the minimization of N2O emissions [21,154].
-
- Gas N2O Sampling and Measurements
In full-scale WWTPs, the N2O emissions from activated sludge tanks are usually captured using a closed floating chamber. This technique was first used to measure fluxes from non-aerated liquid surfaces [134]. The size of the floating chamber varies in different studies [9,25,142]. Spinelli et al., 2018 used two different types of gas chamber—fixed and floating—for gas collection. The fixed chambers were attached to the external wall by steel clamps and the floating chamber was fastened by ropes in order to minimize the effect of turbulence. The samples can be taken from the chambers in three different ways:
(a) the outlet of each chamber can be connected through a gas tube online to an infrared gas analyzer or photoacoustic (PA) spectroscopy detection system [9,26,137,158]; (b) gas samples can be grabbed from the chamber headspace into 20 mL nylon syringes at specific time intervals and the nitrous oxide analyzed using Gas Chromatography (GC) [6]; and
(c) gas samples can be obtained with suitable sampling bags, connected through a valve to the floating chamber and N2O analyzed via Gas Chromatography [142,159,160]. Moreover, N2O can be directly measured with a gas N2O sensor (Unisense A/S, Denmark) attached to the chamber [23].
In lab-scale WWTPs the off-gas can be gathered at the sample point approximately 2 cm below the top of the reactor, using a 100 mL gas syringe and N2O analyzed by GC [61]. Off-gas can also be collected continuously from the lab-scale reactor headspace and conducted via a gas tube to the online infrared analyzer [36]. Furthermore, N2O can be collected from the head of a reactor by a gas-collecting bag and analyzed via gas analyzer or GC [40].
-
- Measurement of Dissolved N2O
The dissolved N2O concentration can be measured in situ using an electrochemical sensor (Unisense Environment A/S, Aarhus, Denmark) placed in the center of or next to the chamber [9,22–26,74,147]. It can be also determined in liquid samples based on the salt-induced stripping approach using gas sampling bags [161]. The salt-induced stripping methodology is based on the N2O solubility in water, which is caused by the formation of a hydration shell that surrounds the gas molecules. When ionic compounds are added to a sample containing N2O, the ion-dipole forces result in the salting out of N2O. When the transfer of N2O from the liquid phase to the gas phase is complete, it can easily be quantified using GC. Another method for the measurement of dissolved N2O in liquid samples is its extraction in the gas phase using the equilibration headspace technique [137,142,159,162,163]. The liquid sample is sealed into a glass vial or a 50 mL syringe. After shaking, the vial and the syringe are left at room temperature for one hour without stirring. The resulting gas phase in the headspace is collected and analyzed by GC. Finally, the dissolved N2O concentration can be indirectly determined using mass balance calculations [36].
The monitoring campaign, the different sampling strategies, the measurement tech- niques, the process configurations, and the results obtained from each process are gathered and presented in Table 2.
Table 2. The monitoring campaign, the different sampling strategies, the measurements techniques, the process configurations and results obtained from each process.
Monitoring Campaign Sampling Strategy Measurement Techniques Process Configurations Results References
Two photoacoustic (PA) spectroscopy systems were tested, one employing a quantum
A floating chamber was employed for off-gas collection.
Off-gas collection was conducted from the reactor headspace. Data were logged every minute for long periods of time (4–12 h of nitrous oxide monitoring).
Nitrous oxide samples collection in gas bags (GSB-P/0.5).
cascade laser (QCL) source and one using a distributed feedback (DFB) laser source for gas-phase measurements. Dissolved nitrous oxide was measured by an electrochemical nitrous oxide sensor (Unisense Environment A/S, Denmark).
Nitrous oxide was measured in the off-gas via an online analyzer. Dissolved nitrous oxide was not directly measured, but calculated with mass balances.
Liquid N2O was measured based on the salt-induced stripping approach and analyzed in GC.
A full-scale WWTP performing a two-stage deammonification process.
Lab-scale granular sludge airlift reactor performing partial nitritation.
Lab-scale reactor.
N2O concentration in the gas phase: 200–800 ppm.
N2O concentration in the liquid phase: 1–6 mg/L.
N2O concentration in the off-gas:
0.08 0.01 mg/L at 10 ◦C,
±
0.09 0.02 mg/L at 15 ◦C and
±
0.18 0.01 mg/L at 20 ◦C.
±
N2O concentration in liquid phase: 0.12 ± 0.02 mg/L at 10 ◦C,
0.11 ± 0.04 mg/L at 15 ◦C and
0.24 ± 0.03 mg/L at 20 ◦C.
N2O emissions: 0.22 0.01 kg/m3–
±
1.14 0.05 kg/m3 based on the use of different inorganic salts.
±
K.M. Thaler et al., 2017 [164]
C. Reino et al., 2017 [36]
P. Kosse et al., 2017 [161]
Table 2. Cont.
Monitoring Campaign Sampling Strategy Measurement Techniques Process Configurations Results References
52 days
Four days in June 2016
The aerobic tank headspace was chosen as the sampling point. Fixed and floating chambers were employed for gas collection. The monitoring duration for each chamber was seven days.
A floating hood was employed for gas sample collection. The hood was placed in 12 different positions. One-liter Tedlar bags were used for off-gas sample collection. Gas syringes were used for dissolved N2O collection after the extraction of liquid samples.
Gas sampling bags (50 mL) were used for gas collection. During gas sampling, a closed gas-tight chamber with a gas-sampling outlet was fixed to the tank.
Off-gas N2O was measured using an online analyzer.
GC with BID detector (Shimadzu 2010 Plus Tracera) was used for N2O measurements in gas and liquid phases. Dissolved N2O was extracted with the equilibration headspace technique.
The N2O concentrations were analyzed using a gas chromatograph (Agilent 7890B, USA) with an electron capture detector (ECD).
Microelectrode analysis was conducted for N2O measurements using microelectrodes (Unisense MM-Meter, Denmark).
Full-scale modified Ludzack–Ettinger plant.
Municipal water resource recovery facility with a modified Ludzack–Ettinger configuration, consisting of a series
of anoxic and aerobic reactors.
Lab-scale SBR.
The average N2O emission rate was 0.856 0.905 gN2O/h when the COD:TN was 3.2, while
it increased to 1.850 0.972 gN2O/h
±
±
when COD:TN ratio was 1.9.
Dissolved N2O concentrations varied between 9.09 and
346.9 µg/L at the different sampling points.
N2O emissions varied between
2.56 and 34.99 µg/L.
N2O emissions varied between 0 and 0.8 mg/h and 0 and
0.5 mg/h at DO = 1 mg/L and DO = 2 mg/L, respectively.
Dissolved N2O concentrations varied between 0 and 0.9 mg/h
and 0 and 0.3 mg/h at
DO = 1 mg/L and DO = 2 mg/L, respectively.
M. Spinelli et al., 2018 [158]
D. Caniani et al., 2019 [142]
X. Yan et al., 2019 [160]
Table 2. Cont.
Monitoring Campaign Sampling Strategy Measurement Techniques Process Configurations Results References
N2O concentration was
Gaseous N2O was collected
determined using gas chromatography (GC) equipped with an electron capture detector (GC-6890N, Agilent, USA).
N2O off-gas was measured using the N2O detector (HA80–N2O,
Biological aerated filter.
Laboratory-scale sequencing
N2O emission rate varied M. Zheng et al., 2019 [139]
N2O emissions were 0.0741 ± 0.0025 mg/(L·h) with
between 4 and 8 mg/h.
Eighty days
Two campaigns, one in summer 2015 and one in winter 2016. Each campaign lasted for one week.
from the head of sequencing
batch biofilm reactors and sealed in a gas-collecting bag.
A floating chamber was employed for gas collection. The gas N2O microsensor was placed in the anoxic and aeration reactor in each WWTP. The liquid-phase
N2O microsensor was located close to the gas sensor.
China). The N2O concentration
in the liquid phase was calculated based on equations reported by Kong et al., 2002.
Dissolved nitrous oxide was monitored online using electrochemical N2O sensors (UNISENSE A/S, Århus,
Denmark). Off-gas nitrous oxide measurements were conducted continuously and logged on a minute basis (Teledyne API,
San Diego, USA).
Off-gas and dissolved N2O was measured by online N2O microsensors.
batch biofilm reactors (SBBRs).
Intermittently fed lab-scale sequencing batch
reactor (SBR).
Three full-scale WWTPs, one performing a Modified Ludzack–Ettinger process, one CAS system with five plug-flow parallel
reactors and one secondary treatment employing an anaerobic/anoxic/oxic (A2/O) configuration.
one-time dosing, whereas N2O
emissions were
0.0402 0.0016 mg/(L h) with methanol step dosing.
± ·
Off-gas N2O concentrations varied between 0 and 0.4 mg/L
and 0 and 0.3 mg/L at pH = 8 and pH = 7, respectively; dissolved N2O concentrations varied between 0.3 and 1 mg/L
and 0.1 and 1 mg/L at pH = 8 and pH = 7, respectively.
For the 1st campaign (summer 2015): Dissolved N2O concentrations ranged from 0.04 to 190.21 mg/L/day and N2O emissions ranged from 1.16 to
22.48 g/day.
For the 2nd campaign (winter 2016): Dissolved N2O concentrations ranged from 0.04 to 353.63 mg/L/day and N2O emissions ranged from 0.21 to
492.14 g/day.
H. Chai et al., 2019 [40]
Q. Su et al., 2019 [62]
A. Vieira et al., 2019 [23]
Table 2. Cont.
Monitoring Campaign Sampling Strategy Measurement Techniques Process Configurations Results References
The collected gas measurements were conducted using an N2O analyzer (Horiba VA-30 0 0 &
Two campaigns, one for four weeks and one with a duration of
three days
Four months (January 2019–April 2019)
N2O monitoring with gas analyzer lasted for March to April 2019)
27 March to 5 April of
2012 and 5th–9th of March 2013
Floating hoods were used for gas collection. Sampling locations were chosen in order to cover the influent inlet area, the middle of the aeration tank, and the effluent outlet area.
There is an air duct above each of the covered anoxic, aeration, and membrane tanks to directly
measure N2O.
VS-30 02). The N2O analyzer measurements were checked independently by analysing gas samples using a Shimadzu
GC-9A equipped with a micro-electron capture detector (ECD) and a flame ionization detector (FID). The dissolved
nitrous oxide was measured based on the equilibration of gas and liquid phases.
Dissolved nitrous oxide measurements were conducted employing an electrochemical sensor. Off-gas nitrous oxide emissions were continuously monitored using an MIR9000CLD gas analyzer.
N2O emissions measurements were conducted via a gas nitrous oxide analyzer.
A full-scale sequencing batch reactor (SBR).
A full-scale SCENA (Short-Cut Enhanced Nutrient Abatement) SBR.
A full-scale anoxic/aerobic membrane bioreactor.
N2O fluxes range from 0 to
0.8 gr/hr*m2 at different DO concentrations, whereas the dissolved N2O concentrations ranged from 0 to 0.06 mg/L.
N2O emissions
ranged from 0 to 6 mg/m3 and dissolved N2O concentrations ranged from 0 to 2.5 mg/L.
N2O flux was 1.11 g/d in the anoxic tank, 1.03 g/d in the aerobic tank and 0.2 g/d in the membrane tank at
DO = 0.5 mg/L, whereas N2O flux was 0.63 g/d in the anoxic and the aerobic tank at
DO = 3.5 mg/L.
H. Duan et al., 2020 [137]
V. Vasilaki et al., 2020 [143]
J. Wen et al., 2020 [138]
Table 2. Cont.
Monitoring Campaign Sampling Strategy Measurement Techniques Process Configurations Results References
Aeration tanks monitoring for 1 week, including weekends. Cascade tanks monitoring in consecutive weeks. The off-gas was
Twenty-two campaigns (2012–2018), monitoring twice, once in winter and once in summer
Long-term monitoring (April 2018–July 2019)
continuously sampled using a custom-made floating gas hood (1 m2 surface area; approximately 0.3 m3 headspace), placed in the middle of the monitored aerated zone. A constant
off-gas flowrate was pumped out of the headspace through polyvinyl chloride tubings to a unit for dust and humidity removal (PSS-5, M&C Tech Group, Germany) and then split between the N2O and CO2 infrared analyzers.
A floating hood was employed for off-gas N2O collection.
Data collection once per minute for both gas and liquid samples.
A beaker was used for dissolved N2O collection. An injection syringe was used for off-gas N2O collection.
The dissolved N2O measurement was conducted using an electrochemical N2O sensor, whereas off-gas N2O measurements were performed via an infrared gas analyzer.
Results comparison between the gas analyzer and GC-MS
was performed.
Off-gas N2O was measured via an infrared gas analyzer.
Dissolved N2O was measured via an electrochemical microsensor.
The gaseous N2O was measured via GC. The dissolved N2O was measured based on the headspace method.
Ten full-scale WWTPs, mainly municipal, with different configurations.
A full-scale SBR performing nitrification.
A lab-scale SBR.
Average N2O–N emission factors normalized to the TKN load in the influent to the WWTP ranged from 0.002 to 1.52%.
N2O production rates ranged from 0.02 to 0.70 kg/day Dissolved N2O concentrations ranged from 0 to 0.38 mg/L Off-gas N2O concentrations ranged from 0 to 50 ppmv.
N2O emissions in the aerobic phase ranged from 0 to
0.1 mgN/min and from 0.025 to
0.23 mgN/min when C/N ratios were 6.5 and 9.3, respectively.
T. Valkova et al., 2021 [25]
W. B. Bae et al., 2021 [26]
R. Yang et al., 2021 [61]
Table 2. Cont.
Monitoring Campaign Sampling Strategy Measurement Techniques Process Configurations Results References
The reactor top was sealed
Seven campaigns with one-year duration on full wastewater treatments plants
with a gas-tight membrane for off-gas N2O collection. The gases were drawn via sampling tube to a conditioning unit and then sent to a gas analyzer.
Floating chambers were utilized for off-gas N2O collection. On WWTPs with consecutive fed lanes, one or more lanes were monitored, each with three or more floating chambers per lane placed on the aerated compartments.
Infrared gas analyzer for off-gas measurements.
Infrared gas analyzer for off-gas measurements.
A pilot-scale aerobic granular sludge (AGS) SBR and a pilot-scale conventional
activated sludge (CAS) SBR.
Seven full-scale WWTPs with different configurations including conventional activated sludge (CAS), anoxic/aerobic (AO), anaerobic/anoxic/aerobic (A2O)), alternatingly fed intermittently aerated (A/I), and sequencing batch reactors (SBR)) and biofilm systems (hybrid fixed bed and activated sludge (IFAS), fixed bed (FB)).
N2O fluxes ranged from 0 to
0.29 grN2O/hr*m2 and from 0 to
0.3 grN2O/hr*m2 for the AGS and CAS systems, respectively.
N2O emission factor ranged from 0.1% to 8% of the total influent nitrogen load.
B.J. Thwaites et al., 2021 [140]
W. Gruber et al., 2021 [112]
Strategies, Novel N2O Minimization Technologies and Techniques under Development
The optimization of operational conditions in order to achieve the required effluent quality while minimizing the operating costs and energy consumption of WWTPs has been investigated by many researchers [165,166]. Control and regulations of critical operational conditions, such as DO, pH, availability of carbon sources, and solids retention time (SRT) can be applied in order to minimize N2O emissions. High DO and high SRT can be achieved by applying the Complete solids Retention AS (CRAS) process. CRAS is an aerobic process that can be used to achieve the longest possible SRT (up to complete retention), maintain highly aerobic conditions in the aerobic bioreactor (DO > 4 mg/L), and perform successful microbial manipulation and efficient solid/liquid separation [167,168]. New technologies should be developed for N2O emissions mitigation. Algal technologies present a hopeful solution for wastewater treatment through nitrogen and phosphorus uptake [169–171], but these technologies should be studied further to reduce N2O emissions. The design and evaluation of automatic control schemes is essential to improving the performance and operational management of WWTPs and reducing N2O emissions [172]. The development and employment of novel optimal control/operational strategies is necessary to improve the performance of WWTPs, such as the implementation of proportional and integral (PI) controllers or fuzzy logic control (FLC) systems [128,173].
Conclusions
In wastewater treatment plants, the production of N2O can be attributed to the hy- droxylamine oxidation, nitrifier denitrification and heterotrophic denitrification pathways. The contribution of each pathway to N2O emissions depends on the different microbial species present (AOB, AOA, NOB, anammox) and on the process conditions. There are many different methods for measuring N2O and sampling strategies for N2O quantification. Gaseous N2O concentration is usually analyzed by GC or via an infrared gas analyzer, whereas dissolved N2O concentration is usually measured in situ using an electrochemical sensor. New strategies and controlling factors should be imposed in order to mimimize N2O emissions. To reduce N2O emissions during the denitrification process, a sufficient carbon source (COD/N ratio above 4), a low DO and a high pH should be maintained. For complete nitrite oxidation to nitrates, high DO (above 2 mgO2/L), low nitrite concentration and high pH (pH = 8) should be ensured in order to hinder N2O production. For partial nitrification (the nitritation/anammox process), low DO (<1 mgO2/L) and low pH (pH = 6) are required. A long solids retention time is required to prevent nitrite accumulation during nitrification. Sudden shifts in pH or DO in the reactor should be avoided. All operational process conditions should be further studied and standardized as a guide for operators with the aim of minimizing N2O emissions.
Author Contributions: Conceptualization, L.K. and E.A.; methodology, L.K and E.A.; software, L.K.; validation, L.K.; formal analysis, L.K. and E.A.; investigation, L.K.; resources, L.K.; data curation, L.K.; writing—original draft preparation, L.K.; writing—L.K. and E.A.; visualization, L.K.; supervision, E.A.; project administration, E.A.; funding acquisition, E.A. All authors have read and agreed to the published version of the manuscript.
Funding: This research was funded by Region of Western Macedonia’s (MIS) 5047197 project.
Data Availability Statement: All data are available upon request.
Conflicts of Interest: The authors declare no conflict of interest.
Glossary/Abbreviations
AOB, ammonia-oxidizing bacteria; AOA, ammonia-oxidizing archaea; NOB, nitrite-oxidizing bacteria; AMO, ammonia mono-oxygenase; HAO, hydroxylamine oxidoreductase; NaR, nitrate reductase; NiR, nitrite reductase; NOR, nitric oxide reductase; N2OR, nitrous oxide reductase; FA,
free ammonia; FNA, free nitrous acid; WWTP, wastewater treatment plant; GWP, global warming potential; DO, dissolved oxygen; GHG, greenhouse gas.
References
- Gupta, D.; Singh, S.K. Greenhouse Gas Emissions from Wastewater Treatment Plants: A Case Study of Noida. J. Water Sustain.
2012, 2, 131–139.
- IPCC. Summary for Policymakers. In Climate Change 2023: Synthesis Report. A Report of the Intergovernmental Panel on Climate Change; Contribution of Working Groups I, II and III to the Sixth Assessment Report of the Intergovernmental Panel on Climate Change; Core Writing Team, Lee, H., Romero, J., Eds.; IPCC: Geneva, Switzerland, 2023; pp. 1–34.
- USEPA. Inventory of U.S. Greenhouse Gas Emissions and Sinks; USEPA: Washington, DC, USA, 2021.
- Montzka, S.A.; Reimann, S. Ozone depleting Substances (ODSs) and Related Chemicals (Chapter 1). In Scientific Assessment of Ozone Depletion: 2010; Global Ozone Research and Monitoring Project, Report No. 52; World Meteorological Organization: Geneva, Switzerland, 2011; p. 516.
- Wunderlin, P.; Mohn, J.; Joss, A.; Emmenegger, L.; Siegrist, H. Mechanisms of N2O production in biological wastewater treatment under nitrifying and denitrifying conditions. Water Res. 2012, 46, 1027–1037. [CrossRef] [PubMed]
- Law, Y.; Ye, L.; Pan, Y.; Yuan, Z. Nitrous oxide emissions from wastewater treatment processes. Philos. Trans. R. Soc. 2012, 367,
1265–1277. [CrossRef]
- Wang, C.; Amon, B.; Schylz, K.; Mehdi, B. Factors That Influence Nitrous Oxide Emissions from Agricultural Soils as Well as Their Representation in Simulation Models: A Review. Agronomy 2021, 11, 770. [CrossRef]
- Rout, P.; Das, R.; Das, S.N. Rise in nitrous oxide levels due to fossil fuel combustion in urban atmosphere. J. Sci. Ind. Res. 2005,
64, 46–52.
- Domingo-Felez, C.; Smets, B.F. Regulation of key N2O production mechanisms during biological water treatment. Curr. Opin. Biotechnol. 2019, 57, 119–126. [CrossRef]
- Kampschreur, M.J.; Temmink, H.; Kleerebezem, R.; Jetten, M.S.M.; van Loosdrecht, M.C.M. Nitrous oxide emission during wastewater treatment. Water Res. 2009, 43, 4093–4103. [CrossRef] [PubMed]
- Daelman, M. Emissions of Methane and Nitrous Oxide from Full-Scale Municipal Wastewater Treatment Plants. PhD Thesis, Technical University of Delft, Delft, The Netherlands, October 2014.
- Gruber, W.; Villez, K.; Kipf, M.; Wunderlin, P.; Siegrist, H.; Vogt, L.; Joss, A. N2O emission in full-scale wastewater treatment: Proposing a refined monitoring strategy. Sci. Total Environ. 2020, 699, 134–157. [CrossRef]
- Yao, H.; Gao, X.; Guo, J.; Wang, H.; Zhang, L.; Fan, L.; Jia, F.; Guo, J.; Peng, Y. Contribution of nitrous oxide to the carbon footprint of full-scale wastewater treatment plants and mitigation strategies—A critical review. Environ. Pollut. 2022, 314, 120295. [CrossRef]
- Płuciennik-Koropczuk, E.; Myszograj, S. Significance of wastewater treatment to nitrous oxide emission. Civ. Environ. Eng. Rep.
2021, 31, 237–248. [CrossRef]
- Chen, Y.C.; Kuo, J. Potential of greenhouse gas emissions from sewage sludge management: A case study of Taiwan. J. Clean. Prod. 2016, 129, 196–201. [CrossRef]
- Frison, N.; Chiumenti, A.; Katsou, E.; Malamis, S.; Bolzonella, D.; Fatone, F. Mitigating off-gas emissions in the biological nitrogen removal via nitrite process treating anaerobic effluents. J. Clean. Prod. 2015, 93, 126–133. [CrossRef]
- Colliver, B.B.; Stephenson, T. Production of nitrogen oxide and dinitrogen oxide by autotrophic nitrifiers. Biotechnol. Adv. 2000, 18,
- Ahn, J.H.; Kim, S.; Park, H.; Katehis, D.; Pagilla, K.; Chandran, K. Spatial and Temporal Variability in Atmospheric Nitrous Oxide Generation and Emission from Full-Scale Biological Nitrogen Removal and Non-BNR Processes. Water Environ. Res. 2010, 82, 2362–2372. [CrossRef]
- Malamis, S.; Katsou, E.; Fatone, F. Integration of energy efficient processes in carbon and nutrient removal from sewage. In Sewage Treatment Plants: Economic Evaluation of Innovative Technologies for Energy Efficiency; Stamatelatou, K., Tsagarakis, K., Eds.; IWA Publishing: London, UK, 2015; pp. 71–94.
- Baresel, C.; Andersson, S.; Yang, J.; Andersen, M.H. Comparison of nitrous oxide (N2O) emissions calculations at a Swedish wastewater treatment plant based on water concentrations versus off-gas concentrations. Adv. Clim. Chang. Res. 2016, 7, 185–191. [CrossRef]
- Mannina, G.; Ekama, G.; Caniani, D.; Cosenza, A.; Esposito, G.; Gori, R.; Garrido-Baserba, M.; Rosso, D.; Olsson, G. Greenhouse gases from wastewater treatment—A review of modelling tools. Sci. Total Environ. 2016, 551–552, 254–270. [CrossRef]
- Su, Q.; Domingo-Felez, C.; Zhang, Z.; Blum, J.; Jensen, M.M.; Smets, B.F. The effect of pH on N2O production in intermittently-fed nitritation reactors. Water Res. 2019, 156, 223–231. [CrossRef]
- Vieira, A.; Galinha, C.F.; Oehmen, A.; Carvalho, G. The link between nitrous oxide emissions, microbial community profile and function from three full-scale WWTPs. Sci. Total Environ. 2019, 651, 2460–2472. [CrossRef]
- Vasilaki, V.; Conca, V.; Frison, N.; Eusebi, A.L.; Fatone, F.; Katsou, E. A knowledge discovery framework to predict the N2O emissions in the wastewater sector. Water Res. 2020, 178, 115799. [CrossRef]
- Valkova, T.; Parravicini, V.; Saracevic, E.; Tauber, J.; Svardal, K.; Krampe, J. A method to estimate the direct nitrous oxide emissions of municipal wastewater treatment plants based on the degree of nitrogen removal. J. Environ. Manag. 2021, 279, 111563. [CrossRef]
- Bae, W.B.; Park, Y.; Chandran, K.; Shin, J.; Kang, S.B.; Wang, J.; Kim, Y.M. Temporal triggers of N2O emissions during cyclical and seasonal variations of a full-scale sequencing batch reactor treating municipal wastewater. Sci. Total Environ. 2021, 797, 149093. [CrossRef] [PubMed]
- Rodriguez-Caballero, A.; Ribera, A.; Balcázar, J.L.; Pijuan, M. Nitritation versus full nitrification of ammonium-rich wastewater: Comparison in terms of nitrous and nitric oxides emissions. Bioresour. Technol. 2013, 139, 195–202. [CrossRef] [PubMed]
- Metcalf & Eddy Inc. Wastewater Engineering: Treatment and Resource Recovery, 5th ed.; Tchobanoglous, G., Burton, F.L., Stensel,
H.D., Eds.; McGraw-Hill Education: New York, NY, USA, 2014.
- Hellinga, C.; Schellen, A.A.J.C.; Mulder, J.W.; van Loosdrecht, M.C.M.; Heijnen, J.J. The SHARON process: An innovative method for nitrogen removal from ammonium-rich wastewater. Water Sci. Technol. 1998, 37, 135–142. [CrossRef]
- Gerardi, M.H. Wastewater Microbiology: Nitrification/Denitrification in the Activated Sludge Process; John Wiley and Sons, Inc.: New
York, NY, USA, 2002.
- Castro-Barros, C.M.; Daelman, M.; Mampaey, K.; Van Loosdrecht, M.C.M.; Volcke, E. Effect of aeration regime on N2O emission from partial nitritation-anammox in a full-scale granular sludge reactor. Water Res. 2015, 68, 793–803. [CrossRef] [PubMed]
- Strous, M.; Fuerst, J.A.; Kramer, E.H.; Logemann, S.; Muyzer, G.; van de Pas-Schoonen, K.T.; Webb, R.; Kuenen, J.G.; Jetten, M.S. Missing lithotroph identified as new planctomycete. Nature 1999, 400, 446–449. [CrossRef]
- Jetten, M.S.; van Niftrik, L.; Strous, M.; Kartal, B.; Keltjens, J.T.; Op den Camp, H.J. Biochemistry and molecular biology of anammox bacteria. Crit. Rev. Biochem. Mol. Biol. 2009, 44, 65–84. [CrossRef]
- Law, Y.; Lant, P.; Yuan, Z. The Confounding Effect of Nitrite on N2O Production by an Enriched Ammonia-Oxidizing Culture.
Environ. Sci. Technol. 2013, 47, 7186–7194. [CrossRef]
- Caranto, J.D.; Lancaster, K.M. Nitric oxide is an obligate bacterial nitrification intermediate produced by hydroxylamine oxidoreductase. Proc. Natl. Acad. Sci. USA 2017, 114, 8217–8222. [CrossRef]
- Reino, C.; van Loosdrecht, M.C.M.; Carrera, J.; Perez, J. Effect of temperature on N2O emissions from a highly enriched nitrifying granular sludge performing partial nitritation of a low strength wastewater. Chemosphere 2017, 185, 336–343. [CrossRef]
- Chen, S.; Harb, M.; Sinha, P.; Smith, A.L. Emerging investigators series: Revisiting greenhouse gas mitigation from conventional activated sludge and anaerobic-based wastewater treatment systems. Environ Sci. Water Res. Technol. 2018, 4, 17–39. [CrossRef]
- Massara, T.M.; Solís, B.; Guisasola, A.; Katsou, E.; Baeza, J.A. Development of an ASM2d-N2O model to describe nitrous oxide emissions in municipal WWTPs under dynamic conditions. Chem. Eng. J. 2018, 335, 85–196. [CrossRef]
- Guo, G.; Wang, Y.; Hao, T.; Wu, D.; Chen, G.H. Enzymatic nitrous oxide emissions from wastewater treatment. Front. Environ. Sci. Eng. 2018, 12, 10. [CrossRef]
- Chai, H.; Deng, S.; Zhou, X.; Su, C.; Xiang, Y.; Yang, Y.; Shao, Z.; Gu, L.; Xu, X.; Ji, F.; et al. Nitrous oxide emission mitigation during low–carbon source wastewater treatment: Effect of external carbon source supply strategy. Environ. Sci. Pollut. Res. 2019, 26, 23095–23107. [CrossRef]
- Wan, X.; Baeten, J.E.; Volcke, E.I.P. Effect of operating conditions on N2O emissions from one-stage partial nitritation-anammox reactors. Biochem. Eng. J. 2019, 143, 24–33. [CrossRef]
- Anderson, J.H. The metabolism of hydroxylamine to nitrite by Nitrosomonas. Biochem. J. 1964, 91, 8–17. [CrossRef] [PubMed]
- Ritchie, G.A.F.; Nicholas, D.J.D. Identification of the sources of nitrous oxide produced by oxidative and reductive processes in
Nitrosomonas europaea. Biochem. J. 1972, 126, 1181–1191. [CrossRef]
- Hooper, A.B.; Terry, K.R. Hydroxylamine oxidoreductase of Nitrosomonas, production of nitric oxide from hydroxylamine. Biochim. Biophys. Acta 1979, 571, 12–20. [CrossRef] [PubMed]
- Igarashi, N.; Moriyama, H.; Fujiwara, T.; Fukumori, Y.; Tanaka, N. The 2.8 A structure of hydroxylamine oxidoreductase from a nitrifying chemoautotrophic bacterium, Nitrosomonas europaea. Nat. Struct. Mol. Biol. 1997, 4, 276–284. [CrossRef] [PubMed]
- Poughon, L.; Dussap, C.G.; Gros, J.B. Energy model and metabolic flux analysis for autotrophic nitrifiers. Biotechnol. Bioeng. 2001,
72, 416–433. [CrossRef]
- Arp, D.J.; Stein, L.Y. Metabolism of inorganic N compounds by ammonia-oxidizing bacteria. Crit. Rev. Biochem. Mol. Biol. 2003,
38, 471–495. [CrossRef]
- Stein, L.Y. Surveying N2O-producing pathways in bacteria. Methods Enzymol. 2010, 486, 131–152.
- Goreau, T.J.; Kaplan, W.A.; Wofsy, S.C.; McElroy, M.B.; Valois, F.W.; Watson, S.W. Production of NO2− and N2O by nitrifying bacteria at reduced concentrations of oxygen. Appl. Environ. Microbiol. 1980, 40, 526–532. [CrossRef]
- Kim, S.W.; Miyahara, M.; Fushinobu, S.; Wakagi, T.; Shoun, H. Nitrous oxide emission from nitrifying activated sludge dependent on denitrification by ammonia-oxidizing bacteria. Bioresour. Technol. 2010, 101, 3958–3963. [CrossRef]
- Hynes, R.K.; Knowles, R. Production of nitrous oxide by Nitrosomonas europaea: Effects of acetylene, pH, and oxygen. Can. J. Microbiol. 1984, 30, 1397–1404. [CrossRef]
- Zheng, H.; Hanaki, K.; Matsuo, T. Production of nitrous oxide gas during nitrification of wastewater. Water Sci. Technol. 1994, 30, 133–141. [CrossRef]
- Kester, R.A.; De Boer, W.; Laanbroek, H.J. Production of NO and N2O by pure cultures of nitrifying and denitrifying bacteria during changes in aeration. Appl. Environ. Microbiol. 1997, 63, 3872–3877. [CrossRef] [PubMed]
- Desloover, J.; De Clippeleir, H.; Boeckx, P.; Du Laing, G.; Colsen, J.; Verstraete, W.; Vlaeminck, S.E. Floc-based sequential partial nitritation and anammox at full scale with contrasting N2O emissions. Water Res. 2011, 45, 2811–2821. [CrossRef]
- Aboobakar, A.; Cartmell, E.; Stephenson, T.; Jones, M.; Vale, P.; Dotro, G. Nitrous oxide emissions and dissolved oxygen profiling in a full-scale nitrifying activated sludge treatment plant. Water Res. 2013, 47, 524–534. [CrossRef] [PubMed]
- Peng, L.; Ni, B.J.; Ye, L.; Yuan, Z. The combined effect of dissolved oxygen and nitrite on N2O production by ammonia oxidizing bacteria in an enriched nitrifying sludge. Water Res. 2015, 73, 29–36. [CrossRef]
- Santín, I.; Barbu, M.; Pedret, C.; Vilanova, R. Control strategies for nitrous oxide emissions reduction on wastewater treatment plants operation. Water Res. 2017, 125, 466–477. [CrossRef] [PubMed]
- Andersson, K.K.; Hooper, A.B. O2 and H2O are each the source of one O in NO2− produced from NH3 by Nitrosomonas:
15N-NMR evidence. FEBS Lett. 1983, 164, 236–240. [CrossRef]
- Ni, B.J.; Yuan, Z. Recent advances in mathematical modeling of nitrous oxides emissions from wastewater treatment processes.
Water Res. 2015, 87, 336–346. [CrossRef] [PubMed]
- Chen, X.; Mielczarek, A.T.; Habicht, K.; Andersen, M.H.; Thornberg, D.; Sin, G. Assessment of Full-Scale N2O Emission Characteristics and Testing of Control Concepts in an Activated Sludge Wastewater Treatment Plant with Alternating Aerobic and Anoxic Phases. Environ. Sci. Technol. 2019, 53, 12485–12494. [CrossRef]
- Yang, R.; Yuan, L.; Wang, R.; He, Z.; Chen, X. New insight on the regulation of N2O production in aerobic condition: An N2O metabolic perspective based on enzymatic analysis of nitrous oxide reductase. J. Water Process Eng. 2021, 41, 102090. [CrossRef]
- Su, Q.; Domingo-Félez, C.; Jensen, M.M.; Smets, B.F. Abiotic Nitrous Oxide (N2O) Production Is Strongly pH Dependent but Contributes Little to Overall N2O Emissions in Biological Nitrogen Removal Systems. Environ. Sci. Technol. 2019, 53, 3508–3516. [CrossRef]
- Prince, R.C.; George, G.N. The remarkable complexity of hydroxylamine oxidoreductase. Nat. Struct. Biol. 1997, 4, 247–250. [CrossRef]
- Whittaker, M.; Bergmann, D.; Arciero, D.; Hooper, A.B. Electron transfer during the oxidation of ammonia by the chemolithotrophic bacterium Nitrosomonas europaea. Biochim. Biophys. Acta 2000, 1459, 346–355. [CrossRef]
- Hooper, A.B.; Terry, K.R. Hydroxylamine oxidoreductase from Nitrosomonas: Inactivation by hydrogen peroxide. Biochemistry
1979, 16, 455–459. [CrossRef] [PubMed]
- Caranto, J.D.; Vilbert, A.C.; Lancaster, K.M. Nitrosomonas europaea cytochrome P460 is a direct link between nitrification and nitrous oxide emission. Proc. Natl. Acad. Sci. USA 2016, 113, 14704–14709. [CrossRef] [PubMed]
- Yoshida, T.; Alexander, M. Nitrous oxide formation by Nitrosomonas europaea and heterotrophie microorganisms. Soil. Sci. Soc. Am. Proc. 1970, 34, 880. [CrossRef]
- Stüven, R.; Vollmer, M.; Bock, E. The impact of organic matter on nitric oxide formation by Nitrosomonas europaea. Arch. Microbiol. 1992, 158, 439–443. [CrossRef]
- Hooper, A.B.; Vannelli, T.; Bergmann, D.J.; Arciero, D.M. Enzymology of the oxidation of ammonia to nitrite by bacteria. Antonie Leeuwenhoek 1997, 71, 59–67. [CrossRef] [PubMed]
- Chandran, K.; Stein, L.Y.; Klotz, M.G.; Van Loosdrecht, M.C.M. Nitrous oxide production by lithotrophic ammonia-oxidizing bacteria and implications for engineered nitrogen-removal systems. Biochem. Soc. Trans. 2011, 39, 1832–1837. [CrossRef] [PubMed]
- Shiskowski, D.M.; Mavinic, D.S. The influence of nitrite and pH (nitrous acid) on aerobic-phase, autotrophic N2O generation in a wastewater treatment bioreactor. J. Environ. Eng. Sci. 2006, 5, 273–283. [CrossRef]
- Poth, M.; Focht, D. 15N Kinetic analysis of N2O production by Nitrosomonas europaea: An examination of nitrifier denitrification.
Appl. Environ. Microbiol. 1985, 49, 1134–1141. [CrossRef]
- Bock, E.; Schmidt, I.; Stüven, R.; Zart, D. Nitrogen loss caused by denitrifying Nitrosomonas cells using ammonium or hydrogen as electron donors and nitrite as electron acceptor. Arch. Microbiol. 1995, 163, 16–20. [CrossRef]
- Kampschreur, M.J.; Tan, N.C.G.; Kleerebezem, R.; Picioreanu, C.; Jetten, M.S.M.; Van Loosdrecht, M.C.M. Effect of dynamic process conditions on nitrogen oxide emission from a nitrifying culture. Environ. Sci. Technol. 2008, 42, 429–435. [CrossRef] [PubMed]
- Soler-Jofra, A.; Stevens, B.; Hoekstra, M.; Picioreanu, C.; Sorokin, D.; van Loosdrecht, M.C.M.; Pérez, J. Importance of abiotic hydroxylamine conversion on nitrous oxide emissions during nitritation of reject water. Chem. Eng. J. 2015, 287, 720–726. [CrossRef]
- Schreiber, F.; Wunderlin, P.; Udert, K.M.; Wells, G.F. Nitric oxide and nitrous oxide turnover in natural and engineered microbial communities: Biological pathways, chemical reactions, and novel technologies. Front. Microbiol. 2012, 3, 372. [CrossRef]
- Kampschreur, M.J.; Kleerebezem, R.; de Vet, W.W.J.M.; van Loosdrecht, M.C.M. Reduced iron induced nitric oxide and nitrous oxide emission. Water Res. 2011, 45, 5945–5952. [CrossRef]
- Harper, J.W.F.; Takeuchi, Y.; Riya, S.; Hosomi, M.; Terada, A. Novel abiotic reactions increase nitrous oxide production during partial nitrification: Modeling and experiments. Chem. Eng. J. 2015, 281, 1017–1023. [CrossRef]
- Chen, H.; Zeng, L.; Wang, D.; Zhou, Y.; Yang, X. Recent advances in nitrous oxide production and mitigation in wastewater treatment. Water Res. 2020, 184, 116168. [CrossRef] [PubMed]
- Xie, W.M.; Ni, B.J.; Li, W.W.; Sheng, G.P.; Yu, H.Q.; Song, J. Formation and quantification of soluble microbial products and N2O production by ammonia-oxidizing bacteria (AOB)-enriched activated sludge. Chem. Eng. Sci. 2012, 71, 67–74. [CrossRef]
- Li, P.; Wang, S.; Peng, Y.; Liu, Y.; He, J. The synergistic effects of dissolved oxygen and pH on N2O production in biological domestic wastewater treatment under nitrifying conditions. Environ. Technol. 2015, 36, 1623–1631. [CrossRef] [PubMed]
- Lv, Y.; Ju, K.; Sun, T.; Wang, L.; Miao, R.; Liu, T.; Wang, X. Effect of the dissolved oxygen concentration on the N2O emission from an autotrophic partial nitritation reactor treating high ammonium wastewater. Int. Biodeterior. Biodegrad. 2016, 114, 209–215. [CrossRef]
- Peng, L.; Ni, B.J.; Erler, D.; Ye, L.; Yuan, Z. The effect of dissolved oxygen on N2O production by ammonia-oxidizing bacteria in an enriched nitrifying sludge. Water Res. 2014, 66, 12–21. [CrossRef] [PubMed]
- Rathnayake, R.M.; Oshiki, M.; Ishii, S.; Segawa, T.; Satoh, H.; Okabe, S. Effects of dissolved oxygen and pH on nitrous oxide production rates in autotrophic partial nitrification granules. Bioresour. Technol. 2015, 197, 15–22. [CrossRef]
- Massara, T.M.; Malamis, S.; Guisasola, A.; Baeza, J.A.; Noutsopoulos, C.; Katsou, E. A review on nitrous oxide (N2O) emissions during biological nutrient removal from municipal wastewater and sludge reject water. Sci. Total Environ. 2017, 596–597, 106–123. [CrossRef]
- Ahn, J.H.; Kwan, T.; Chandran, K. A comparison of partial and full nitrification processes applied for treating high-strength nitrogen wastewaters: Microbial ecology through nitrous oxide production. Environ. Sci. Technol. 2011, 45, 2734–2740. [CrossRef]
- Peng, L.; Carvajal-Arroyo, J.M.; Seuntjens, D.; Prat, D.; Colica, G.; Pintucci, C.; Vlaeminck, S.E. Smart operation of nitrita- tion/denitritation virtually abolishes nitrous oxide emission during treatment of co-digested pig slurry centrate. Water Res. 2017, 127, 1–10. [CrossRef]
- Beaumont, H.J.E.; Lens, S.I.; Reijnders, W.N.M.; Westerhoff, H.V.; Van Spanning, R.J.M. Expression of nitrite reductase in Nitrosomonas europaea involves NsrR, a novel nitrite-sensitive transcription repressor. Mol. Microbiol. 2004, 54, 148–158. [CrossRef] [PubMed]
- Schulthess, R.V.; Kuhni, M.; Gujer, W. Release of Nitric and Nitrous Oxides from Denitrifying Activated Sludge. Water Res. 1995,
29, 215–226. [CrossRef]
- Alinsafi, A.; Adouani, N.; Béline, F.; Lendormi, T.; Limousy, L.; Sire, O. Nitrite effect on nitrous oxide emission from denitrifying activated sludge. Process Biochem. 2008, 43, 683–689. [CrossRef]
- Zhou, Y.; Pijuan, M.; Zeng, R.J.; Yuan, Z. Free nitrous acid inhibition on nitrous oxide reduction by a denitrifying-enhanced biological phosphorus removal sludge. Environ. Sci. Technol. 2008, 42, 8260–8265. [CrossRef] [PubMed]
- Zhou, Y.; Lim, M.; Harjono, S.; Ng, W.J. Nitrous oxide emission by denitrifying phosphorus removal culture using polyhydrox- yalkanoates as carbon source. J. Environ. Sci. 2012, 24, 1616–1623. [CrossRef]
- Kinh, C.T.; Ahn, J.; Suenaga, T.; Sittivorakulpong, N.; Noophan, P.; Hori, T.; Riya, S.; Hosomi, M.; Terada, A. Free nitrous acid and pH determine the predominant ammonia-oxidizing bacteria and amount of N2O in a partial nitrifying reactor. Appl. Microbiol. Biotechnol. 2017, 101, 1673–1683. [CrossRef] [PubMed]
- Pan, Y.; Ni, B.J.; Bond, P.L.; Ye, L.; Yuan, Z. Electron competition among nitrogen oxides reduction during methanol-utilizing denitrification in wastewater treatment. Water Res. 2013, 47, 3273–3281. [CrossRef]
- Burgess, J.E.; Colliver, B.B.; Stuetz, R.M.; Stephenson, T. Dinitrogen oxide production by a mixed culture of nitrifying bacteria during ammonia shock loading and aeration failure. J. Ind. Microbiol. Biotechnol. 2002, 29, 309–313. [CrossRef]
- Butler, M.D.; Wang, Y.Y.; Cartmell, E.; Stephenson, T. Nitrous oxide emissions for early warning of biological nitrification failure in activated sludge. Water Res. 2009, 43, 1265–1272. [CrossRef]
- Yu, R.; Kampschreur, M.J.; van Loosdrecht, M.C.M.; Chandran, K. Oxide and Nitric Oxide Generation during Transient Anoxia.
Environ. Sci. Technol. 2010, 44, 1313–1319. [CrossRef]
- Chung, Y.C.; Chung, M.S. BNP Test to Evaluate the Influence of C/N Ratio on N2O Production in Biological Denitrification. Water Sci. Technol. 2000, 42, 23–27. [CrossRef]
- Schulthess, R.V.; Gujer, W. Release of nitrous oxide (N2O) from denitrifying activated sludge: Verification and application of a mathematical model. Water Res. 1996, 30, 521–530. [CrossRef]
- Song, K.; Harper, J.W.F.; Hori, T.; Riya, S.; Hosomi, M.; Terada, A. Impact of carbon sources on nitrous oxide emission and microbial community structure in an anoxic/oxic activated sludge system. Clean Technol. Environ. Policy 2015, 17, 2375–2385. [CrossRef]
- Adouani, N.; Lendormi, T.; Limousy, L.; Sire, O. Effect of the carbon source on N2O emissions during biological denitrification.
Resour. Conserv. Recycl. 2010, 54, 299–302. [CrossRef]
- Zhang, X.; Wang, X.; Zhang, J.; Huang, X.; Wei, D.; Lan, W.; Hu, Z. Reduction of nitrous oxide emissions from partial nitrification process by using innovative carbon source (mannitol). Bioresour. Technol. 2016, 218, 789–795. [CrossRef]
- Twining, B.S.; Mylon, S.E.; Benoit, G. Potential role of copper availability in nitrous oxide accumulation in a temperate lake.
Limnol. Oceanogr. 2007, 52, 1354–1366. [CrossRef]
- Moffett, J.W.; Tuit, C.B.; Ward, B.B. Chelator-induced inhibition of copper metalloenzymes in denitrifying bacteria. Limnol. Oceanogr. 2012, 57, 272–280. [CrossRef]
- Ren, Y.; Ngo, H.H.; Guo, W.; Ni, B.J.; Liu, Y. Linking the nitrous oxide production and mitigation with the microbial community in wastewater treatment: A review. Bioresour. Technol. Rep. 2019, 7, 100191. [CrossRef]
- Schalk-Otte, S.; Seviour, R.J.; Kuene, J.G.; Jetten, M.S.M. Nitrous oxide (N2O) production by Alcaligenes faecalis during feast and famine regimes. Water Res. 2000, 34, 2080–2088. [CrossRef]
- Knowles, R. Denitrification. Microbiol. Rev. 1982, 46, 43–70. [CrossRef]
- Hanaki, K.; Hong, Z.; Matsuo, T. Production of nitrous oxide gas during denitrification of wastewater. Water Sci. Technol. 1992, 26, 1027–1036. [CrossRef]
- Itokawa, H.; Hanaki, K.; Matsuo, T. Nitrous oxide production in high-loading biological nitrogen removal process under low cod/n ratio condition. Water Res. 2001, 35, 657–664. [CrossRef]
- Andalib, M.; Taher, E.; Donohue, J.; Ledwell, S.; Andersen, M.H.; Sangrey, K. Correlation between nitrous oxide (N2O) emission and carbon to nitrogen (COD/N) ratio in denitrification process: A mitigation strategy to decrease greenhouse gas emission and cost of operation. Water Sci. Technol. 2018, 77, 426–438. [CrossRef]
- Christensen, M.H.; Lie, E.; Welander, T. A Comparison Between Ethanol and Methanol as Carbon Sources for Denitrification.
Water Sci. Technol. 1994, 30, 83–90. [CrossRef]
- Gruber, W.; Von Kanel, L.; Vogt, L.; Luck, M.; Biolley, L.; Feller, K.; Moosmann, A.; Krahenbühl, N.; Kipf, M.; Loosli, R.; et al. Estimation of countrywide N2O emissions from wastewater treatment in Switzerland using long-term monitoring data. Water Res. X 2021, 13, 100122. [CrossRef]
- Quan, X.; Zhang, M.; Lawlor, P.G.; Yang, Z.; Zhan, X. Nitrous oxide emission and nutrient removal in aerobic granular sludge sequencing batch reactors. Water Res. 2012, 46, 4981–4990. [CrossRef]
- Amatya, I.M.; Kansakar, B.R.; Tare, V.; Fiksdal, L. Role of pH on biological Nitrification Process. J. Inst. Eng. 2011, 8, 119–125.
[CrossRef]
- Meyerhof, O.F. Process Chemistry and Biochemistry of Nitrification. Stud. Environ. Sci. 1916, 54, 55–118.
- Van Hulle, S.W.H.; Vandeweyer, H.J.P.; Meesschaert, B.D.; Vanrolleghem, P.A.; Dejans, P.; Dumoulin, A. Engineering aspects and practical application of autotrophic nitrogen removal from nitrogen rich streams. Chem. Eng. J. 2010, 162, 1–20. [CrossRef]
- Suzuki, I.; Dular, U.; Kwok, S.C. Ammonia or ammonium ion as substrate for oxidation by Nitrosomonas europaea cells and extracts. J. Bacteriol. 1974, 120, 556–558. [CrossRef]
- Anthonisen, A.C.; Loehr, R.C.; Prakasam, T.B.S.; Srinath, E.G. Inhibition of nitrification by ammonia and nitrous acid. J. Water Pollut. Control Fed. 1976, 48, 835–852.
- Vadivelu, V.M.; Keller, J.; Yuan, Z. Effect of free ammonia on the respiration and growth processes of an enriched Nitrobacter culture. Water Res. 2007, 41, 826–834. [CrossRef] [PubMed]
- Vadivelu, V.M.; Yuan, Z.; Fux, C.; Keller, J. The inhibitory effects of free nitrous acid on the energy generation and growth processes of an enriched Nitrobacter culture. Environ. Sci. Technol. 2006, 40, 4442–4448. [CrossRef] [PubMed]
- Jimιnez, E.; Gimιnez, J.B.; Ruano, M.V.; Ferrer, J.; Serralta, J. Effect of pH and nitrite concentration on nitrite oxidation rate.
Bioresour. Technol. 2011, 102, 8741–8747. [CrossRef]
- Ruiz, G.; Jeison, D.; Chamy, R. Nitrification with high nitrite accumulation for the treatment of wastewater with high ammonia concentration. Water Res. 2003, 37, 1371–1377. [CrossRef]
- Thörn, M.; Sörensson, F. Variation of nitrous oxide formation in the denitrification basin in a wastewater treatment plant with nitrogen removal. Water Res. 1996, 30, 1543–1547. [CrossRef]
- Pan, Y.; Ye, L.; Ni, B.J.; Yuan, Z. Effect of pH on N2O reduction and accumulation during denitrification by methanol utilizing denitrifiers. Water Res. 2012, 46, 4832–4840. [CrossRef]
- Grunditz, C.; Dalhammar, G. Development of nitrification inhibition assays using pure cultures of Nitrosomonas and Nitrobacter.
Water Res. 2001, 35, 433–440. [CrossRef]
- Van Hulle, S.W.H.; Volcke, E.I.P.; Teruel, J.L.; Donckels, B.; van Loosdrecht, M.C.M.; Vanrolleghem, P.A. Influence of temperature and pH on the kinetics of the SHARON nitritation process. J. Chem. Technol. Biotechnol. 2007, 82, 471–480. [CrossRef]
- Hellinga, C.; van Loosdrecht, M.C.M.; Heijnen, J.J. Model based design of a novel process for nitrogen removal from concentrated flows. Math. Comput. Model. Dyn. Syst. 1999, 5, 351–371. [CrossRef]
- Boiocchi, R.; Gernaey, K.V.; Sin, G. A novel fuzzy-logic control strategy minimizing N2O emissions. Water Res. 2017, 123, 479–494.
- Poh, L.S.; Jiang, X.; Zhang, Z.; Liu, Y.; Ng, W.J.; Zhou, Y. N2O accumulation from denitrification under different temperatures.
Appl. Microbiol. Biotechnol. 2015, 99, 9215–9226. [CrossRef] [PubMed]
- Weiss, R.F.; Price, B.A. Nitrous oxide solubility in water and seawater. Mar. Chem. 1980, 8, 347–359. [CrossRef]
- Zumft, W.G. Cell Biology and Molecular Basis of Denitrification. Microbiol. Mol. Biol. Rev. 1997, 61, 533–616. [PubMed]
- Kosonen, H.; Heinonen, M.; Mikola, A.; Haimi, H.; Mulas, M.; Corona, F.; Vahala, R. Nitrous oxide production at a fully covered wastewater treatment plant: Results of a long-term online monitoring campaign. Environ. Sci. Technol. 2016, 50, 5547–5554. [CrossRef]
- Smith, C.J.; DeLaune, R.D.; Patrick, W.H., Jr. Nitrous oxide emission from Gulf Coast wetlands. Geochim. Cosmochim. Acta 1983,
47, 1805–1814. [CrossRef]
- Czepiel, P.; Crill, P.; Harriss, R. Nitrous oxide emissions from municipal wastewater treatment. Environ. Sci. Technol. 1995, 29, 2352–2356. [CrossRef]
- Pascale, R.; Caivano, M.; Buchicchio, A.; Mancini, I.M.; Bianco, G.; Caniani, D. Validation of an analytical method for simultaneous high-precision measurements of greenhouse gas emissions from wastewater treatment plants using a gas chromatography-barrier discharge detector system. J. Chromatogr. A 2017, 1480, 62–69. [CrossRef]
- Bellandi, G.; Porro, J.; Senesi, E.; Caretti, C.; Caffaz, S.; Weijers, S.; Nopens, I.; Gori, R. Multi-point monitoring of nitrous oxide emissions in three full scale conventional activated sludge tanks in Europe. Water Sci. Technol. 2018, 77, 880–890. [CrossRef]
- Duan, H.; Van den Akker, B.; Thwaites, B.J.; Peng, L.; Herman, C.; Pan, Y.; Ni, B.J.; Watt, S.; Yuan, Z.; Ye, L. Mitigating nitrous oxide emissions at a full-scale wastewater treatment plant. Water Res. 2020, 185, 116196. [CrossRef]
- Wen, J.; LeChevallier, M.W.; Tao, W.; Liu, Y. Nitrous oxide emission and microbial community of full-scale anoxic/aerobic membrane bioreactors at low dissolved oxygen setpoints. J. Water Process Eng. 2020, 38, 101654. [CrossRef]
- Zheng, M.; Zhou, N.; Liu, S.; Dang, C.; Liu, Y.; He, S.; Zhao, Y.; Liu, W.; Wang, X. N2O and NO emission from a biological aerated filter treating coking wastewater: Main source and microbial community. J. Clean. Prod. 2019, 213, 365–374. [CrossRef]
- Thwaites, B.J.; Stuetz, R.; Short, M.; Reeve, P.; Alvarez-Gaitan, J.P.; Dinesh, N.; Philips, R.; Van den Akker, B. Analysis of nitrous oxide emissions from aerobic granular sludge treating high saline municipal wastewater. Sci. Total Environ. 2021, 756, 143653. [CrossRef]
- Van Loosdrecht, M.C.M.; Nielsen, P.H.; Lopez-Vazquez, C.M.; Brdjanovic, D. Experimental Methods in Wastewater Treatment; IWA Publishing: London, UK, 2016.
- Caniani, D.; Caivano, M.; Pascale, R.; Bianco, G.; Mancini, I.M.; Masi, S.; Mazzone, G.; Firouzian, M.; Rosso, D. CO2 and N2O from water resource recovery facilities: Evaluation of emissions from biological treatment, settling, disinfection, and receiving water body. Sci. Total Environ. 2019, 648, 1130–1140. [CrossRef] [PubMed]
- Vasilaki, V.; Massara, T.M.; Stanchev, P.; Fatone, F.; Katsou, E. A decade of nitrous oxide (N2O) monitoring in full-scale wastewater treatment processes: A critical review. Water Res. 2019, 161, 392–412. [CrossRef] [PubMed]
- Daelman, M.R.J.; Van Voorthuizen, E.M.; Van Dongen, U.G.J.M.; Volcke, E.I.P.; Van Loosdrecht, M.C.M. Seasonal and diurnal variability of N2O emissions from a full-scale municipal wastewater treatment plant. Sci. Total Environ. 2015, 536, 1–11. [CrossRef] [PubMed]
- Daelman, M.R.J.; Van Voorthuizen, E.M.; Van Dongen, U.G.J.M.; Volcke, E.I.P.; Van Loosdrecht, M.C.M. Methane and nitrous oxide emissions from municipal wastewater treatment results from a long-term study. Water Sci. Technol. 2013, 67, 2350–2355. [CrossRef]
- Gujer, W. Siedlungswasserwirtschaft; Springer: Berlin/Heidelberg, Germany, 2007.
- Foley, J.; de Haas, D.; Yuan, Z.; Lant, P. Nitrous oxide generation in full-scale biological nutrient removal wastewater treatment plants. Water Res. 2010, 44, 831–844. [CrossRef] [PubMed]
- Bai, R.; Jin, L.; Fu, H.; Zhuang, M.; Wei, Y. Estimating nitrous oxide emissions based on TN discharge from municipal wastewater treatment plants: A case study for the city of Xiamen, China. Greenh. Gases Sci. Technol. 2023. [CrossRef]
- Doorn, M.R.; Liles, D.S. Quantification of Methane Emissions and Discussion of Nitrous Oxide, and Ammonia Emissions from Septic Tanks, Latrines and Stagnant Open Sewers in the World; EPA: Washington, DC, USA, 1999.
- Mamais, D.; Noutsopoulos, C.; Dimopoulou, A.; Stasinakis, A.; Lekkas, T.D. Wastewater treatment process impact on energy savings and greenhouse gas emissions. Water Sci. Technol. 2015, 71, 303–308. [CrossRef]
- Scheehle, E.A.; Doorn, M.R. Improvements to the U.S. Wastewater Methane and Nitrous Oxide Emissions Estimates; U.S. EPA:
Washington, DC, USA, 2004.
- Thomsen, M.; Lyck, E. Emission of CH4 and N2O from Wastewater Treatment Plants (6B); Research Notes from NERI no. 208; National Environmental Research Institute: Roskilde, Denmark, 2005; 46p. Available online: http://research-notes.dmu.dk (accessed on 9 July 2023).
- Farrell, A.E.; Kerr, A.C.; Brandt, A.R.; Franco, G.; Barkalow, G. Research Roadmap for Greenhouse Gas Inventory Methods; California
Energy Commission: Sacramento, CA, USA, 2005.
- Blomberg, K.; Kosse, P.; Mikola, A.; Kuokkanen, A.; Fred, T.; Heinonen, M.; Mulas, M.; Lubken, M.; Wichern, M.; Vahala, R. Development of an extended ASM3 model for predicting the nitrous oxide emissions in a full-scale wastewater treatment plant. Eviron. Sci. Technol. 2018, 52, 5803–5811. [CrossRef]
- Mampaey, K.E.; Beuckels, B.; Kampschreur, M.J.; Kleerebezem, R.; van Loosdrecht, M.C.M.; Volcke, E.I.P. Modelling nitrous and nitric oxide emissions by autotrophic ammonia- oxidizing bacteria. Environ. Technol. 2013, 34, 1555–1566. [CrossRef] [PubMed]
- Law, Y.; Ni, B.J.; Lant, P.; Yuan, Z. N2O production rate of an enriched ammonia-oxidizing bacteria culture exponentially correlates to its ammonia oxidation rate. Water Res. 2012, 46, 3409–3419. [CrossRef]
- Pocquet, M.; Wu, Z.; Queinnec, I.; Sperandio, M. A two-pathway model for N2O emissions by ammonium oxidizing bacteria supported by the NO/N2O variation. Water Res. 2016, 88, 948–959. [CrossRef] [PubMed]
- Spinelli, M.; Eusebi, A.L.; Vasilaki, V.; Katsou, E.; Frison, N.; Cingolani, D.; Fatone, F. Critical analyses of nitrous oxide emissions in a full scale activated sludge system treating low carbon-to-nitrogen ratio wastewater. J. Clean. Prod. 2018, 190, 517–524. [CrossRef]
- Kimochi, Y.; Inamori, Y.; Mizuochi, M.; Xu, K.Q.; Matsumura, M. Nitrogen removal and N2O emission in a full-scale domestic wastewater treatment plant with intermittent aeration. J. Ferment. Bioeng. 1998, 86, 202–206. [CrossRef]
- Yan, X.; Zheng, S.; Qiu, D.; Yang, J.; Han, Y.; Huo, Z.; Su, X.; Sun, J. Characteristics of N2O generation within the internal micro-environment of activated sludge flocs under different dissolved oxygen concentrations. Bioresour. Technol. 2019, 291, 121867. [CrossRef]
- Kosse, P.; Lübken, M.; Schmidt, T.C.; Wichern, M. Quantification of nitrous oxide in wastewater based on salt-induced stripping.
Sci. Total Environ. 2017, 601–602, 83–88. [CrossRef]
- Hall, K.C. Gas Chromatographic Measurement of Nitrous Oxide Dissolved in Water Using a Headspace Analysis Technique. J. Chromatogr. Sci. 1980, 18, 22–24. [CrossRef]
- Townsend-Small, A.; Pataki, D.E.; Tsang, L.Y.; Tsai, C.Y.; Rosso, D. Nitrous Oxide Emissions from Wastewater Treatment and Water Reclamation Plants in Southern California. J. Environ. Qual. 2011, 40, 1542–1550. [CrossRef]
- Thaler, K.M.; Berger, C.; Leix, C.; Drewes, J.; Niessner, R.; Haisch, C. Photoacoustic spectroscopy for the quantification of N2O in the off gas of wastewater treatment plants. Anal. Chem. 2017, 89, 3795–3801. [CrossRef]
- Pang, J.W.; Yang, S.S.; He, L.; Chen, Y.D.; Ren, N.Q. Intelligent control/operational strategies in WWTPs through an integrated Q-learning algorithm with ASM2d-guided reward. Water 2019, 11, 927. [CrossRef]
- Zhou, H.B.; Qiao, J.F. Multiobjective optimal control for wastewater treatment process using adaptive MOEA/D. Appl. Intell.
2019, 49, 1098–1126. [CrossRef]
- Samiotis, G.; Tzelios, D.; Trikoilidou, E.; Koutelias, A.; Amanatidou, E. Innovative approach on aerobic activated sludge process towards more sustainable wastewater treatment. Proceedings 2018, 2, 645.
- Amanatidou, E.; Samiotis, G.; Trikoilidou, E.; Pekridis, G.; Tsikritzis, L. Complete solids retention activated sludge process. Water Sci. Technol. 2016, 73, 1364–1369. [CrossRef]
- Samiotis, G.; Stamatakis, K.; Amanatidou, E. Assessment of Synechococcus elongatus PCC 7942 as an option for sustainable wastewaterTreatment. Water Sci. Technol. 2021, 84, 1438–1451. [CrossRef] [PubMed]
- Nasr, M. Design Considerations of Algal Systems for Wastewater Treatment. In Application of Microalgae in Wastewater Treatment; Gupta, S.K., Bux, F., Eds.; Springer: Cham, Switzerland, 2019.
- Gupta, S.K.; Sriwastav, A.; Ansari, F.A.; Nasr, M.; Nema, A.K. Phycoremediation: An Eco-friendly Algal Technology for Bioremediation and Bioenergy Production. In Phytoremediation Potential of Bioenergy Plants; Bauddh, K., Singh, B., Korstad, J., Eds.; Springer: Singapore, 2017.
- Lu, H.; Wang, H.; Wu, Q.; Luo, H.; Zhao, Q.; Liu, B.; Si, Q.; Zheng, S.; Guo, W.; Ren, N. Automatic control and optimal operation for greenhouse gas mitigation in sustainable wastewater treatment plants: A review. Sci. Total Environ. 2023, 855, 158849. [CrossRef] [PubMed]
- Flores-Alsina, X.; Corominas, L.; Snip, L.; Vanrolleghem, P.A. Including greenhouse gas emissions during benchmarking of wastewater treatment plant control strategies. Water Res. 2011, 45, 4700–4710. [CrossRef] [PubMed]
Disclaimer/Publisher’s Note: The statements, opinions and data contained in all publications are solely those of the individual author(s) and contributor(s) and not of MDPI and/or the editor(s). MDPI and/or the editor(s) disclaim responsibility for any injury to people or property resulting from any ideas, methods, instructions or products referred to in the content.