Your browser does not fully support modern features. Please upgrade for a smoother experience.
Please note this is an old version of this entry, which may differ significantly from the current revision.
Subjects:
Health Policy & Services
Given the recent increase in the number of Nigerians estimated to be at risk of food insecurity, it is crucial to explore the array of tools used to quantify food insecurity (FI). This exploration will help determine the prevalence and severity of FI in Nigeria.
- Food Security
- Zero hunger
- Farm households
- SDG 2
- Nigeria
- Measurement tools
- Malnutrition
1. Introduction
The global community is faced with one of the most challenging issues in recent times—food insecurity. Food insecurity (FI) is experienced in almost all regions of the world, especially in Asia and Africa, as more than 50% (425 million) of the people in the world affected by hunger in 2021 were in Asia and more than one third (278 million) lived in Africa [1]. About 12% of the world’s population was affected by severe FI, while more than 2 billion people were either moderately or severely food insecure in 2021 [1].
According to the 2023 Global Report on Food Crises, more than one quarter of a billion people are experiencing acute levels of hunger, while some are on the verge of extreme deprivation of food [2]. Increases in conflict events, rising poverty, escalating inequalities, widespread underdevelopment, climate crises, and the COVID-19 pandemic have also contributed to the worsening of global food insecurity [2]. It is worth noting that Africa (especially sub-Saharan Africa) is experiencing worsening FI, which is reflected in the inclusion of six African countries (Sierra Leone 40.5/100, Madagascar 40.6/100, Burundi 40.6/100, Nigeria 42/100, Sudan 42.8/100, and the Congo Dem. Rep. 43/100) among the top 10 bottom-ranking countries with the lowest Global Food Security Index (GFSI) score in the 2022 overall food security environment. No African countries were among the top 10 high-ranking countries [3]. According to the Food and Agriculture Organization (FAO) and its partners’ projections, the impact of the Russia–Ukraine war threatens food security globally. The ripple effect of the war will have numerous implications for global agricultural markets, and this can potentially worsen the state of food and nutrition security for many nations in the coming years [1].
Food insecurity and hunger are on the rise in Nigeria. In January 2023, the United Children Fund (UNICEF) projected that 25 million Nigerians are at risk of experiencing hunger by the third quarter of 2023. This revealed an increase of about 8 million in hunger from the 2022 estimates [4]. Nigeria ranked 107th out of 113 countries and 25th out of 28 sub-Saharan Africa (SSA) countries with a GFSI score of 42/100 in the GFSI 2022 [3,5]. Also, in the 2022 Global Hunger index (GHI), Nigeria ranked 103rd out of 121 countries, scoring 27.3/100. This indicates a serious level of hunger and suggests that Nigeria is not on track to achieve the Sustainable Development Goal 2 (SDG2) target by 2030 [5,6].
X-raying the food security environment in Nigeria, as reported in the GFSI 2022 under the four pillars for food security (Figure 1), indicated that Nigeria had the lowest score (25/100) globally on the affordability category. In the availability category, Nigeria ranked 108th globally and 26th in the region. The report showed that the very weak performance score (39.5) was a result of the “very weak” (0–39.9) scores obtained in certain indicators, such as agricultural research and development (30.7/100), supply-chain infrastructure (23.9/100), sufficiency of supply (25.5/100), political and social barriers to access (31.6/100), and food security and access policy commitments (0/100) [3].
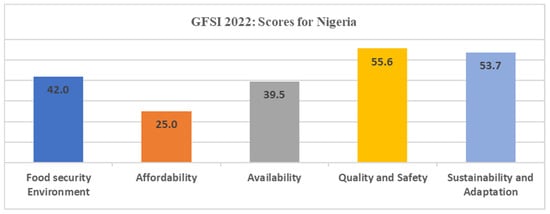
Figure 1. Authors’ graph using data from the Global Food Security Index, 2022.
Food security (according to the United Nations definition) is referred to as “People having at all times, physical, social and economic access to sufficient, safe and nutritious food which meets their dietary needs and food preferences for an active and healthy life” [7]. The term “food insecurity” simply refers to the opposite of food security, where conditions of food security are not met, and it can be broadly conceptualized along a range from mild to severe [8]. The definition contains four widely established pillars of food security, namely: availability, accessibility, utilization, and stability. The four pillars are important in understanding food security at any level, such as regional, household, and individual levels [9,10,11,12,13,14,15].
Generally, conditions that expose people to FI and hunger include extreme poverty, unemployment, corruption, unstable food access, ill health, non-existent social protection programmes, and terrorism [8,14,15,16,17,18,19]. FI is not only experienced in developing nations, as developed nations are also affected. In Australia, for instance, over 2 million households were affected by severe FI in 2022 [20], while in the United States of America (USA), an estimated 14.8% of children resided in food-insecure households [8,21]. It is generally believed that FI risk is unevenly distributed. The most vulnerable groups, such as children, women, the elderly, and internally displaced people (IDPs), usually suffer higher levels of FI [8,19,22,23,24,25]. FI may be momentary in nature, given the possibility of households slipping into and coming out of FI in response to evolving situations, supporting the idea that FI is best conceptualized as a dynamic phenomenon rather than a fixed construct [15,26,27,28,29]. In consideration of the weighty possible implications of FI, comprehending the methods employed by researchers to study FI, and the results obtained, are instrumental in designing food- and nutrition-sensitive policies and their implementation. About two and a half decades ago, many researchers carried out FI research in Nigeria, utilizing various measuring tools like their counterparts in other parts of the world. Several approaches have been established to study FI across global, national, and household/individual domains [11]. About three decades ago, FI measurement tools were used to assess economic access to food, using, for instance, household income or the Household Consumption and Expenditure Survey (HCES) as proxies for food security, although the measures did not capture the experiences of households accessing food or the strategies employed in coping with insufficient food access. To overcome this limitation, the Radimer/Cornell scale (experience-based) was created [30]. In most cases, other experience-based approaches that were developed from [30] hinged on three central themes: “anxiety/uncertainty over running out of food, concerns over and adjustments to the quality, and quantity of food in the diet” [8,30]. The tools used different recall periods (30-day, 12 months) where the gravity of FI is in relation to the quantity of agreeable answers, with a higher number revealing extreme conditions [8,30]. The United States Department of Agriculture (USDA) Household Food Security Survey Module (HFSSM) is another approach commonly used in US-based studies for measuring FI, and it has been extensively adopted in many other countries. The module contains a lineup of questions (18 items) developed from the collective insights of FI at the household level, and it is executed through a survey-based measurement, usually within the timeframe of the prior 12 months. The findings may be presented as an unbroken continuum of severity, or by applying cutoff levels to assign households to four specific categories. In the absence of children, the module utilizes 10-item questions. It is crucial to highlight that HFFSSM adopts a flexible scoring system instead of a strict numerical threshold for classifying households [8,15,31,32].
2. Common Features of Studies
About 17% (13) of the studies utilized secondary data sources [29,40,60,61,85,98,104,105,110,113,117,120,128] within five years (2018, 2020–2023). The first research article that employed a secondary data source was published in 2018 [85]. About 84% (66) of the studies used primary data in investigating and measuring FI in Nigeria. Three notable states in Nigeria with the highest number of FI studies (using primary data) were conducted in Oyo (15), Ogun (10), and Enugu (9), respectively. It is worth noting that no research works (employing primary data sources) were conducted in three states in northwest Nigeria; namely, Jigawa, Katsina, and Zamfara states. According to recent Cadre Harmonise data surveys (2018/2019 household survey), the northwest and the northeast were the two regions having the most acute levels of FI in Nigeria [130]. The southwest had the highest number of FI research studies (45) conducted in the region, while the south–south had the least (9) FI research studies conducted in the region, and only three were reported in Federal Capital Territory (FCT), Abuja. Furthermore, about 9% (7 articles) of studies employed qualitative methodology [68,76,87,101,103,113,118], while the remaining 91% (72) studies were quantitative in nature. Apart from the survey nature of the studies, some (five studies) incorporated focus group discussion (FGDs) and key informant interviews (KIIs) [59,72,82,83,97].
3. Quantifying Food Insecurity
Sixty-three (80%) of the studies included employed the most common FI measurement tool. The commonest method of measuring FI was through HFIAS, with eighteen studies [19,72,74,77,81,84,89,90,91,93,95,110,111,112,115,121,125]. The FI prevalence measured through the HFIAS module ranged from 36.9%, reported from a study that investigated the dynamics of FI using secondary data collected in 2010/2011 and 2015/2016 among households in rural Nigeria [110], to 98.8%, reported in research of household FI and feeding patterns of preschool children in north–central Nigeria [125]. Apart from [125], seven other studies reported a prevalence of FI that is above 90%; for instance, [80] (93.5%), [96] (92.8%), [102] (92.7%), [113] (90.8%), [19] (90.9%), [41] (95.8%), and [127] (95.8%).
Furthermore, twelve studies utilized the HFSSM approach. For instance, refs. [67,94] used 10-item and 16-item forms of HFSSM, while other studies [57,70,80,96,97,100,105,107,108,124] used the conventional full 18-item module. The use of the minimum recommended daily calorie required per adult equivalent is another common method for measuring FI in Nigeria in recent times. Thirteen studies utilized it, while three studies [50,83,122] utilized the same minimum value of 2100 Kcal for their studies in the southwestern and north–central states of Nigeria. Studies by [47,48] utilized 2260 Kcal from Kwara and Oyo states, respectively. Other studies used different daily calorie requirements; for instance, both [88] and [62] used 2250 Kcal, while [71] used 2500 Kcal; ref. [75] used 2550 Kcal; ref. [68] used 2470 Kcal; and ref. [49] utilized the highest value of 2710 Kcal. Also, ref. [126] utilized a 2145 Kcal per capita calorie intake, while [119] used three minimum recommended calorie benchmarks of 2100 Kcal, 1800 Kcal, and 2700 Kcal in their study, which focused on the perceived effects of COVID-19 on food security in southeastern Nigeria. Furthermore, an approach through the per capita food expenditure of households was used in ten studies. Apart from this method, ref. [129] added other methods, such as dietary diversity score (DDS) and Foster–Greer–Thorbecke (FGT), while [104] only added DDS to their study using nationally representative data from the National Bureau of Statistics (NBS).
Additionally, it was observed that studies that employed the “mean per capita food expenditure” approach used varying food security lines (FSL) for which households were categorized as either food secure (if the households met the threshold of a two third mean per capita food expenditure) and food insecure, if otherwise. For instance, refs. [46,66,73,79,86,92] had food security lines of NGN 7967, NGN 1948, NGN 4219, NGN 2643, NGN 10,704, and NGN 20,132 respectively. Furthermore, [114] specified an FSL of NGN 2900 for their study that focused on the effects of climate-smart agricultural practices on food security among farming households in Kwara state, while [99] did not specify the FSL used in categorizing the households into food secure/food insecure households in their study. Furthermore, seven studies employed the FIES approach. Out of these five were COVID-19-related studies in Nigeria [40,41,106,127,128], while two studies were not related to COVID-19 [39,123]. All of the COVID-19-related studies reported that household food access was hampered by the COVID-19 lockdowns in many parts of Nigeria. The study by Samuel et al. [40] reported that lockdown restrictions increased food expenditure and experiences of FI among the respondents. Meanwhile, ref. [106] utilized the COVID-19 National Longitudinal Phone Survey (COVID-19 NLPS) and found that 58.5% of Nigerian households experienced severe FI. Using the standard eight-item FIES in their study, ref. [41] found that only 6.9% of the Nigerian households were food secure, while emphasizing the inadequacies or non-existence of safety net programs, which further plunged the households into severe food insecurity during the pandemic. The study of Bwala et al. [127], which captured the psychosocial stress factors amid COVID-19, reported an increasing level of aggression and irritation among all categories of households, but this was greater among the low-income earners of the selected households in southwest and north–central Nigeria. Out of the 1674 households used in the study by [128] using the COVID-19 NPLS, about 4% were severely FI in the pre-pandemic, but they recorded 43% severe FI during the COVID-19 pandemic.
Only two studies used FCS [85,116]. The investigation by [116] using the FCS and coping strategy index (CSI) found that 21.4% of the households were quality-food insecure, while 34.8% were economically vulnerable to FI. The study by [85] did not report the FI prevalence rate among the polygamous family structure in Nigeria but found polygamous households having better food security outcomes than monogamous households using nationally representative data collected in three waves (2011, 2013, and 2015). Some studies (for instance, [61,78,98]), employed two-item, three-item, and four-item questions to assess FI among the participants, respectively. The three-item version of the HFSSM was adapted by [60,82]. Also, ref. [102] utilized a nine-item food security questionnaire for older children to evaluate the effectiveness of health education intervention on food security and other factors among adolescent girls in Maiduguri, Borno state, while [68,107] adapted the “Freedom from Hunger scale” (FFH) in assessing households’ FI status in Enugu state [131]. The study by [59] adapted the “Household Hunger Scale” (HHS) by [132] and DDS for assessing household food and nutrition security in Ohafia matrilineal society in Nigeria and found a 66% FI level among the households. The Dietary Diversity Score (DDS) was also used by [117] among households using nationally representative data; in addition, ref. [103] employed income level, education, and government policy in investigating farming households’ food security in northern Nigeria. The study by [101] employed perception of the food security situation in the prevailing year (2019) to assess the FHHs in Enugu East Senatorial zone of the state, while [113] used changes in food intake as influenced by COVID-19 in exploring FI among residents in Nigeria during the first wave of COVID-19. The use of FI risk perception and management strategies was utilized by [87] in assessing FI among households in Oyo and Osun states and reported 87.6% FI prevalence. The work of [76] employed food habits and coping strategies among the elderly in Ogun state, while [118] adopted a self-reported one-item question “Since the COVID-19 crisis began, do you eat less or skip meals because there was no enough money or food” [133] to investigate the effects of COVID-19 on FI and other factors among women and girls living with or at risk of HIV in Nigeria and reported 76.1% FI prevalence. The food availability pillar of food security measurement was the focus of the study of [120], which also adopted a one-item self-reported question [134], “do you reduce the size of meal eaten in the household because of insufficient food,” among female-headed households and reported 43.1% prevalence of FI among them.
4. Exploring Food Insecurity in Different Settings
The studies reviewed were carried out in diverse populations in Nigeria. Thirteen studies investigated FI using the Nigerian public [29,40,60,61,85,98,104,106,110,113,117,120,128]. Among these studies, three utilized online surveys with a state-wide population. Three studies also employed COVID-19 NLPS, while seven studies used secondary datasets from the General Household Survey (GHS) made available through NBS. Twenty-seven studies were carried out among farming households in different population groups in different states. The work of [47] measured FI among farming households in Kwara state and reported 38% FI prevalence. The study of [67] used farming households in Ekiti state and reported about 88% FI, while [69] was carried out among urban farm households in Abuja with 30% FI recorded. Other studies were carried out among farming households in southwestern Nigeria; for instance, [99] (Ogun and Oyo), [46] (Ogun), [81] (Ondo), [122] (Oyo, Ekiti and Ondo), [19] (Oyo and Ogun), [79] (Ondo and Ogun), and [124] (Oyo). Also, some studies were carried out among farming households (crop and livestock) in northern Nigeria. For instance, refs. [88,89,100,103,109] reported 37%, 73.9%, 54.5%, 73.5%, and 81.5% FI. Studies involving farming households in the southeast include [96,101]. Also, ref. [123] carried out their study among farming households in the Niger Delta region (Bayelsa and Rivers states) employing the FIES method and reported 72% FI. Two studies reported on people (women and adolescent girls) living with or at risk of the human immunodeficiency virus (HIV) [84,118] and found 72% and 76% FI, respectively. Further studies reported on primary and secondary school children [57], preschool children [125], and households with under-five children [112] and found a higher percent of FI—76.3%, 98.8%, and 63%, respectively. Ukegbu et al. [94] reported research on university undergraduate students, while [103] was about school-aged adolescents, and they found 93% and 81% FI, respectively. Bwala et al. [127] reported on households with varying income groups during COVID-19 and found about 96% FI.
This entry is adapted from the peer-reviewed paper 10.3390/agriculture13101873
This entry is offline, you can click here to edit this entry!