Cichorium intybus L. is the most economically important species of its genus and among the most important of the Asteraceae family. In chicory, many linkage maps have been produced, several sets of mapped and unmapped markers have been developed, and dozens of genes linked to traits of agronomic interest have been investigated. This treasure trove of information, properly cataloged and organized, is of pivotal importance for the development of superior commercial products with valuable agronomic potential in terms of yield and quality, including reduced bitter taste and increased inulin production, as well as resistance or tolerance to pathogens and resilience to environmental stresses.
1. Introduction
Chicories (2n = 2x = 18) are economically important dicot species belonging to the Asteraceae family. The Cichorium genus contains six main species, of which four are exclusively wild (
Cichorium bottae Deflers.,
Cichorium spinosum L.,
Cichorium calvum Sch. Bip. ex Asch., and
Cichorium pumilum Jacq.), one is exclusively cultivated (
Cichorium endivia L.), and one contains both cultivated and wild individuals (
Cichorium intybus L.) [
1]. The main botanical variety in terms of economic impact is
Cichorium intybus var.
foliosum, widely appreciated for its leaves, which are eaten raw or cooked, and characterized by a distinctive bitter taste and crispiness. This variety includes ‘Witloof Chicory’ or ‘Belgian Endive’, commonly known in Europe for its typical etiolated buds named ‘chicon’, and Red Chicory, known as ‘Radicchio’, mostly distributed in northeastern Italy [
2,
3,
4,
5]. Apart from leaf chicory, mainly known for its nutritional and health-beneficial properties, an upsurge of interest has been observed in ‘industrial’ or ‘root’ chicory (
C. intybus var.
sativum), which is mostly used for inulin extraction and as a coffee substitute [
6,
7,
8]. Inulin, as a carbohydrate reserve, accumulates during the first year’s growing season in taproot chicory and is used for food and nonfood applications [
9,
10].
The other economically relevant species from the same genus is
C. endivia, whose curly and smooth leaves (var.
crispum and var.
latifolium, respectively) are consumed worldwide in fresh salads, with Spain, France, and Italy as major EU producers [
9].
From a reproductive point of view,
Cichorium intybus is a diploid plant species that is prevalently allogamous due to its efficient sporophytic self-incompatibility system [
3,
11,
12]. Male sterility represents another efficient sexual barrier widely used in chicory to promote outcrossing and to facilitate the exploitation of heterosis through the production of F1 hybrids. In contrast, endive is an autogamous species with a rate of outcrossing of approximately 1% [
13]. Chicory and endive, as closely related but distinct species, are completely interfertile and offer a vast genetic pool that, through cross-breeding schemes, might be exploited to obtain progeny with wide genetic diversity [
3,
4].
One of the main goals in chicory breeding programs is to achieve the best selections with valuable agronomic potential, such as yield, reduced bitter taste, increased inulin production, and resistance to both biotic and abiotic stressors. Molecular markers are fully addressed to assess genetic information on parental genotypes, heterozygosity evaluation and prediction, population uniformity and distinctiveness [
13,
14]. Moreover, these tools are employed not only in phylogenetic studies and genetic linkage map construction but also for the genetic traceability of the final commercial product [
15,
16]. As a result, the aim of generating a superior commercial product in accordance with market acceptance could be facilitated through the efficient implementation of marker-assisted breeding (MAB) and marker-assisted selection (MAS) programs [
17,
18,
19].
2. Toward a Genetic Genomic Map of Chicory Useful for Marker-Assisted Breeding
Linkage maps lay the groundwork for marker-assisted breeding. In chicory, the assembly of the first linkage map based on 371 markers (16 RAPDs, 72 SAMPLs and 283 AFLPs; 1201 cM) was reported in 1997 using an interspecific hybrid cross between
C. intybus L. and an inbred line of
C. endivia L. [
21]. Similarly, Van Stallen et al. built a genetic linkage map based on an intraspecific cross between two inbred lines of witloof chicory (129 RAPD, 609.6 cM) [
22]. A further RAPD-based genetic map was focused on the characterization of QTLs for the length and browning of pith [
23]. Cassan et al. constructed a RAPD- and SSR-based genetic map (987 cM) to identify QTLs controlling physiological and agronomical traits under two levels of nitrogen fertilization during the vegetative phase of witloof chicory [
24]. Unfortunately, all the above-mentioned maps, due to the type of markers (i.e., dominant markers), cannot be used for comparative studies. A turning point was the development by Cadalen et al. of a consensus genetic map from two industrial chicory progenies and one witloof chicory progeny, containing 472 SSR markers and covering 878 cM [
25]. This study was further deepened by Gonthier et al. for the identification of markers associated with nuclear male sterility (NMS) and sporophytic self-incompatibility (SSI) loci [
12]. Starting from the data produced in the two previous studies, Ghedina et al. developed an efficient multiplex assay for genotyping elite breeding stocks developed from old landraces of Radicchio of Chioggia [
26]. This assay, composed of 27 SSR markers selected according to the polymorphism index and distribution, was further integrated with two additional SSR markers and successfully applied by Patella et al., 2019 [
13]. Muys et al. produced a genetic map for industrial chicory that included 237 marker loci and spanned a total length of 1208 cM [
27]. The map was built combining AFLPs, SSRs, SNPs, and 26 coding sequences. Finally, a high-density linkage map of leaf chicory was constructed using genotyping-by-sequencing (GBS) technology [
28]. The map contained 727 SNP markers, covering a total length of 1413 cM. Most importantly, the map was pivotal for the identification of the putative locus responsible for male sterility. All the genetic maps produced in chicory are summarized in
Table 1.
Table 1. Genetic and physical maps developed over the years for Cichorium intybus. When available, for each map, we report the correspondence between each linkage group (LG) and the chromosome (Chr) of the consensus map (from Fan et al., 2022 [
20]), the number and type of markers employed, the length of each map, and the taxonomy of the sample used for map construction.
In addition to the aforementioned genetic maps, authors of several studies developed sets of unmapped markers, some of which had applications for a wide range of purposes. Thirty-one EST-SSRs with a high level of transferability potential between Cichorium species were proposed but never validated by Ince [
29]. Raulier et al. developed a new set of 15 SSR marker loci to characterize the genetic diversity of the germplasm that originated in the current industrial chicory and to establish the relationships between and within chicory and endive species [
1]. However, the sequences of this new set have never been made public by the authors. An additional set of 12 SSR markers was generated by Zavada et al. and used along with chloroplast DNA sequences to assess the temporal genetic changes and diversity in North America and in New England chicory populations [
30,
31].
Ideally, plant breeders draw on genetic maps and markers to mine information useful for MAB purposes [
32]. However, as in the case of chicory, the availability of multiple linkage maps (each based on single and independent populations) and unmapped markers makes the interpretation and exploitation of the data very challenging. This challenge can be overcome through the production of consensus maps.
The observed discrepancy between the number of markers actually used for the consensus map and the total number of markers developed over the years essentially relies on two factors. The first, which is far from negligible, is that in many cases, the authors of the maps have not made (completely or partially) available the markers used. The second is that some of the available markers did not map. This last aspect is not surprising at all considering that almost all the markers were derived from extragenic and therefore less-conserved regions. This observation assumes particular relevance if we take into account that the different genetic maps and marker sets have been developed using interspecific hybrids (
C. endivia ×
C. intybus) or different botanical varieties (
C. intybus var.
sativum and var.
foliosum). The consensus map allowed us to anchor to specific chromosome positions those markers that until now lacked a position (i.e., all the unmapped markers), such as those from Ince and Zavada et al. [
29,
30]. Furthermore, the consensus map enabled us to establish the correspondences between the linkage groups of the genetic maps produced by Cadalen et al., Muys et al., and Palumbo et al., and the chromosomes assembled by Fan et al. (
Table 1) [
20,
25,
27,
28]. An example is provided in
Figure 1, where chromosome 3 (JAKNSD010000003.1) was found to correspond to LG6 of Cadalen et al. and LG1 of Palumbo et al. [
20,
25,
28]. Within each linkage group/chromosome, most of the markers showed full collinearity. The cases in which collinearity was not observed could be the result of species/variety-specific rearrangements, errors in the construction of the genetic maps, or errors during genome assembly [
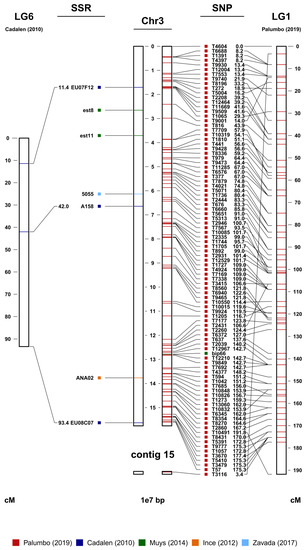
32]. Finally, it should be noted that, thanks to the integration between the genetic maps and the physical map, it was possible to improve the latter by assigning some of the 199 unassembled contigs (JAKNSD010000010.1-JAKNSD010000208.1) to specific chromosomes.
Figure 1. Chromosome 3 (in the center) from the marker-assisted breeding (MAB) map. On the left are the SSR sequences and their genetic distances in cM derived from LG6 of Cadalen et al. [
25] and other unmapped SSRs from Ince et al. [
29] and Zavada et al. [
30]. On the right are all the available SNPs and LG1 of Palumbo et al. [
28], with the respective genetic distances in cM, and the SNPs deriving from the work of Muys et al. [
27]. Contig 15 was associated with chromosome 3 due to the mapping of the SNP marker on the right.
3. A Comprehensive Map for Marker-Assisted Selection Purposes
Linkage maps based on molecular markers also have the potential to bridge the gap between a given genotype and the resulting phenotype [
33]. The basic principle of MAS is to identify a tight linkage between a marker and a gene controlling a trait of interest (e.g., disease resistance, plant cycle length, flowering time, or the reproductive system). This association can be used for practical purposes, including the preliminary screening of plant materials or to verify the introgression of a given gene. Thus, knowing the association with the gene of interest, traditional breeding methods, such as hybridization, backcrossing, self-pollination, and selection, are facilitated in the constitution of new varieties [
34]. In this section, we first reviewed the scientific literature dealing with the identification of genes underlying ten topics of interest in
C. intybus, as summarized in
Table 2.
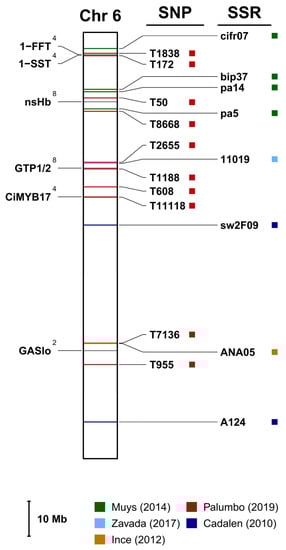
Table 2. The most relevant traits/features investigated in chicory, the responsible genes and/or the associated markers, and the methods used for their identification are reported. The superscript numbers (from 1 to 10) reported for each trait/topic were used to facilitate the correspondence with the genes shown in Figure 2 (for chromosome 6).
Figure 2. Chromosome 6 from the marker-assisted selection (MAS) map. On the left are the genes with their trait identity number (in the form of an apex: 2: sesquiterpene lactone biosynthesis (STL); 4: inulin metabolism; 8: somatic embryogenesis). On the right are reported the markers (SSRs or SNPs) closest to each gene and retrieved from Cadalen et al. [
25], Muys et al. [
27], Palumbo et al. [
28], Ince et al. [
29] and Zavada et al. [
30]. Each gene is also described in detail in
Table 2.
This entry is adapted from the peer-reviewed paper 10.3390/ijms241411663