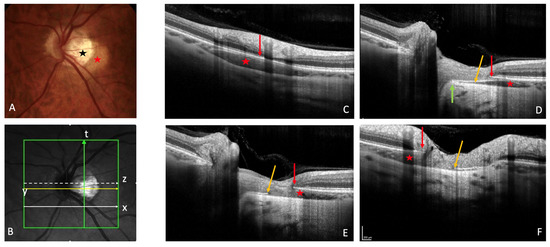
Peripapillary intrachoroidal cavitation (PICC) is a yellow-orange lesion, located at the outer border of the myopic conus. First described as a localized detachment of the retinal pigment epithelium, its intrachoroidal location was later revealed, justifying its current name. PICC is related to other myopic complications such as posterior staphyloma, but its pathogenesis is not clear to date. Although it has been considered a benign condition, most eyes with PICC show visual field defects, which leads to diagnostic uncertainty as these deficits resemble those seen in glaucoma. Furthermore, eyes with PICC may develop macular detachment with retinoschisis.
- peripapillary intrachoroidal cavitation
- border tissue
- myopic complication
- optical coherence tomography
- angiography
1. Introduction
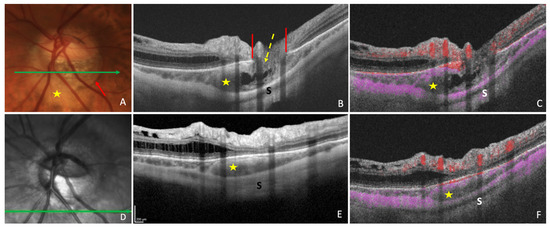
2. Fundoscopy and OCT
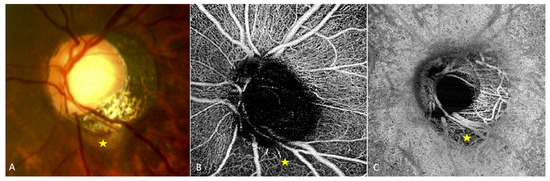
3. Fluorescein Angiography
4. Indocyanine Green Angiography
5. OCT-Angiography
6. Other Modalities
This entry is adapted from the peer-reviewed paper 10.3390/jcm12144712
References
- Freund, K.B.; Ciardella, A.P.; Yannuzzi, L.A.; Pece, A.; Goldbaum, M.; Kokame, G.T.; Orlock, D. Peripapillary detachment in pathologic myopia. Arch. Ophthalmol. 2003, 121, 197–204. [CrossRef]
- Toranzo, J.; Cohen, S.Y.; Erginay, A.; Gaudric, A. Peripapillary intrachoroidal cavitation in myopia. Am. J. Ophthalmol. 2005, 140, 731–732. [CrossRef] [PubMed]
- Spaide, R.F.; Akiba, M.; Ohno-Matsui, K. Evaluation of peripapillary intrachoroidal cavitation with swept source and enhanced depth imaging optical coherence tomography. Retina 2012, 32, 1037–1044. [CrossRef]
- You, Q.S.; Peng, X.Y.; Chen, C.X.; Xu, L.; Jonas, J.B. Peripapillary intrachoroidal cavitations. The Beijing eye study. PLoS ONE 2013, 8, e78743. [CrossRef] [PubMed]
- Okuma, S.; Mizoue, S.; Ohashi, Y. Visual field defects and changes in macular retinal ganglion cell complex thickness in eyes with intrachoroidal cavitation are similar to those in early glaucoma. Clin. Ophthalmol. 2016, 10, 1217–1222. [CrossRef] [PubMed]
- Shimada, N.; Ohno-Matsui, K.; Iwanaga, Y.; Tokoro, T.; Mochizuki, M. Macular retinal detachment associated with peripapillary detachment in pathologic myopia. Int. Ophthalmol. 2009, 29, 99–102. [CrossRef]
- Rajagopal, J.; Chandra Kumar, H.V.; Ganesh, S. Macular detachment associated with peripapillary detachment in pathologic myopia. Retin. Cases Brief Rep. 2014, 8, 103–106. [CrossRef]
- Yoshizawa, C.; Saito, W.; Noda, K.; Ishida, S. Pars plana vitrectomy for macular schisis associated with peripapillary intrachoroidal cavitation. Ophthalmic Surg. Lasers Imaging Retin. 2014, 45, 350–353. [CrossRef]
- Chen, T.C.; Yang, C.H.; Sun, J.P.; Chen, M.S.; Yang, C.M. Macular retinal detachment associated with intrachoroidal cavitation in myopic patients. Graefe’s Arch. Clin. Exp. Ophthalmol. 2015, 253, 1437–1446. [CrossRef]
- Ando, Y.; Inoue, M.; Ohno-Matsui, K.; Kusumi, Y.; Iida, T.; Hirakata, A. Macular detachment associated with Intrachoroidal Cavitation in nonpathological myopic eyes. Retina 2015, 35, 1943–1950. [CrossRef]
- Aoki, S.; Imaizumi, H. Vitrectomy for macular retinoschisis associated with peripapillary intrachoroidal cavitations in a moderately myopic eye. Int. J. Retin. Vitr. 2022, 8, 62. [CrossRef]
- Liu, R.; Li, Z.; Xiao, O.; Zhang, J.; Guo, X.; Loong Lee, J.T.; Wang, D.; Lee, P.; Jong, M.; Sankaridurg, P.; et al. Characteristics of peripapillary intrachoroidal cavitation in highly myopic eyes: The Zhongshan Ophthalmic Center-Brien Holden Vision Institute High Myopia Cohort Study. Retina 2021, 41, 1057–1062. [CrossRef]
- Wang, X.; Rumpel, H.; Lim, W.E.; Baskaran, M.; Perera, S.A.; Nongpiur, M.E.; Aung, T.; Milea, D.; Girard, M.J. Finite Element Analysis Predicts Large Optic Nerve Head Strains During Horizontal Eye Movements. Investig. Ophthalmol. Vis. Sci. 2016, 57, 2452–2462. [CrossRef] [PubMed]
- Demer, J.L. Optic Nerve Sheath as a Novel Mechanical Load on the Globe in Ocular Duction. Investig. Ophthalmol. Vis. Sci. 2016, 57, 1826–1838. [CrossRef] [PubMed]
- Chang, M.Y.; Shin, A.; Park, J.; Nagiel, A.; Lalane, R.A.; Schwartz, S.D.; Demer, J.L. Deformation of Optic Nerve Head and Peripapillary Tissues by Horizontal Duction. Am. J. Ophthalmol. 2017, 174, 85–94. [CrossRef]
- Ehongo, A.; Bacq, N.; Kisma, N.; Dugauquier, A.; Alaoui Mhammedi, Y.; Coppens, K.; Bremer, F.; Leroy, K. Analysis of Peripapillary Intrachoroidal Cavitation and Myopic Peripapillary Distortions in Polar Regions by Optical Coherence Tomography. Clin. Ophthalmol. 2022, 16, 2617–2629. [CrossRef]
- Shimada, N.; Ohno-Matsui, K.; Yoshida, T.; Yasuzumi, K.; Kojima, A.; Kobayashi, K.; Futagami, S.; Tokoro, T.; Mochizuki, M. Characteristics of peripapillary detachment in pathologic myopia. Arch. Ophthalmol. 2006, 124, 46–52. [CrossRef]
- Yeh, S.I.; Chang, W.C.; Wu, C.H.; Lan, Y.W.; Hsieh, J.W.; Tsai, S.; Chen, L.J. Characteristics of peripapillary choroidal cavitation detected by optical coherence tomography. Ophthalmology 2013, 120, 544552.[CrossRef] [PubMed]
- Dai, Y.; Jonas, J.B.; Ling, Z.; Wang, X.; Sun, X. Unilateral peripapillary intrachoroidal cavitation and optic disk rotation. Retina 2015, 35, 655–659. [CrossRef] [PubMed]
- Shimada, N.; Ohno-Matsui, K.; Nishimuta, A.; Tokoro, T.; Mochizuki, M. Peripapillary changes detected by optical coherence tomography in eyes with high myopia. Ophthalmology 2007, 114, 2070–2076. [CrossRef][PubMed]
- Wei, Y.H.; Yang, C.M.; Chen, M.S.; Shih, Y.F.; Ho, T.C. Peripapillary intrachoroidal cavitation in high myopia: Reappraisal. Eye 2009, 23, 141–144. [CrossRef] [PubMed]
- Kim, J.; Kim, J.; Lee, E.J.; Kim, T.W. Parapapillary Intrachoroidal Cavitation in Glaucoma: Association withChoroidal Microvas- culature Dropout. Korean J. Ophthalmol. 2021, 35, 44–50. [CrossRef]
- Freund, K.B.; Mukkamala, S.K.; Cooney, M.J. Peripapillary choroidal thickening and cavitation. Arch. Ophthalmol. 2011, 129, 1096–1097. [CrossRef]
- Forte, R.; Pascotto, F.; Cennamo, G.; de Crecchio, G. Evaluation of peripapillary detachment in pathologicmyopia with en face optical coherence tomography. Eye 2008, 22, 158–161. [CrossRef] [PubMed]
- Marticorena-Álvarez, P.; Clement-Fernández, F.; Iglesias-Ussel, L. Peripapillary intrachoroidal cavitation in pathological myopia. Arch. Soc. Esp. Oftalmol. 2014, 89, 316–319. (In English, In Spanish) [CrossRef]
- Azar, G.; Leze, R.; Affortit-Demoge, A.; Faure, C. Peripapillary Intrachoroidal Cavitation in Myopia Evaluated with Multimodal Imaging Comprising “En-Face” Technique. Case Rep. Ophthalmol. Med. 2015, 2015, 890876. [CrossRef]
- Chen, Q.; He, J.; Hua, Y.; Fan, Y. Exploration of peripapillary vessel density in highly myopic eyes with peripapillary intrachoroidal cavitation and its relationship with ocular parameters using optical coherence tomography angiography. Clin. Exp. Ophthalmol. 2017, 45, 884–893. [CrossRef]
- Comune, C.; Montorio, D.; Cennamo, G. Optical coherence tomography angiography in myopic peripapillary intrachoroidal cavitation complicated by choroidal neovascularization. Eur. J. Ophthalmol. 2021, 31, 19201924. [CrossRef] [PubMed]
- Parlak, M.; Ipek, S.C.; Saatci, A.O. Peripapilläre Aufhellung bei hoher Myopie: Nur ein Staphyloma posticum? [Peripapillary whitening in high myopia: Only a staphyloma posticum?]. Ophthalmologe 2020, 117, 379–383. (In German) [CrossRef] [PubMed]
- Mazzaferro, A.; Carnevali, A.; Zucchiatti, I.; Querques, L.; Bandello, F.; Querques, G. Optical coherence tomography angiography features of intrachoroidal peripapillary cavitation. Eur. J. Ophthalmol. 2017, 27,e32–e34. [CrossRef]
- Chen, Y.; Ma, X.; Hua, R. Multi-modality imaging findings of huge intrachoroidal cavitation and myopic peripapillary sinkhole. BMC Ophthalmol. 2018, 18, 24. [CrossRef] [PubMed]
- Shen, K.L.; Foroozan, R.; Weng, C.Y. Peripapillary intrachoroidal cavitation. Clin. Exp. Ophthalmol. 2019, 47, 1200–1202. [CrossRef]
- Chawla, R.; Kumar, A.; Mandal, S. Three-Dimensional Reconstruction Imaging of Peripapillary Intrachoroidal Cavitation in a Myopic Patient. Ophthalmol. Retin. 2019, 3, 928. [CrossRef]
- Venkatesh, R.; Pereira, A.; Gupta, A. Conventional colour fundus photography over multicolour imaging in identifying peripapillary intrachoroidal cavitation in myopic eyes. BMJ Case Rep. 2021, 14, e246837. [CrossRef]
- Fujimoto, S.; Miki, A.; Maruyama, K.; Mei, S.; Mao, Z.; Wang, Z.; Chan, K.; Nishida, K. Three-Dimensional Volume Calculation of Intrachoroidal Cavitation Using Deep-Learning-Based Noise Reduction of Optical Coherence Tomography. Transl. Vis. Sci. Technol. 2022, 11, 1. [CrossRef]