1. Introduction
Malnutrition, the number one contributor to the burden of disease, remains a major global public health problem [
1,
2]. The Eastern Mediterranean Region (EMR) is no exception with many countries experiencing a double burden of malnutrition, involving undernutrition and micronutrient deficiencies coupled with elevated rates of overweight, obesity, and non-communicable diseases (NCDs) [
3,
4,
5]. Despite some progress, key drivers of malnutrition have been shown to persist especially among infants, young children, adolescents, and women [
3,
5]. Throughout the different stages of the life-cycle, malnutrition has been shown to hinder individuals’ physiological, sensory, or mental health and wellbeing [
6]. Undernutrition in children, especially in the early stages of life, is a risk factor for impaired physical and cognitive growth and a weakened immunity [
6,
7,
8,
9]. Additionally, childhood obesity is associated with short-term adverse health effects including psychological, physiological, and metabolic complications, as well as long-term consequences including an increased risk of premature death, disability, and NCDs later in life [
10,
11]. In women, malnutrition can increase the likelihood of poor fetal development, suboptimal birthweight, complications during pregnancy, maternal mortality, and NCDs [
6,
9,
12]. Moreover, malnutrition hinders economic development, particularly through imposing elevated healthcare expenses and decreasing productivity [
1].
Jordan, a middle-income country in the EMR [
13], is witnessing an escalating pace of nutrition transition that may be associated with an increased burden of malnutrition and related NCDs [
3,
14]. Combating malnutrition in all its forms is challenging and requires the need to combine multifactorial interventions to secure the provision and accessibility to healthy and sustainable diets [
4,
5]. These interventions should be led by a comprehensive analysis of the nutrition status in Jordan, which is crucial for developing evidence-based country-specific policies and strategies, prioritizing action plans, and measuring progress. To the best of our knowledge, findings on the nutrition situation in Jordan are lacking. Therefore, the purpose of this paper is to examine the available evidence and secular trends pertinent to specific nutrition-related indicators including infant and young child feeding (IYCF) practices; low birthweight (LBW); stunting, wasting, and underweight among children under 5 years; micronutrient deficiencies including anemia, vitamin A, vitamin D, and iodine deficiencies; overweight/obesity; and food consumption patterns among different age groups; as well as available information on current national nutrition policies and strategies in Jordan.
2. Breastfeeding Indicators
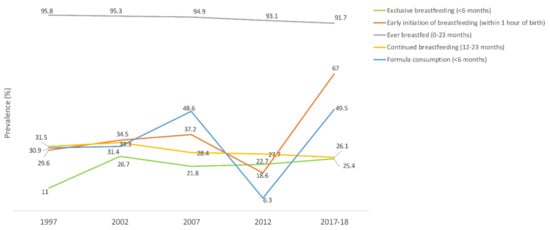
The prevalence of exclusive breastfeeding under 6 months of age was 25.4% in 2017‒2018 [
36]. Rates decreased with the infant’s age, from 42.8% among children aged 0–1 month to 23.3% among those aged 2–3 months and 10.9% among those aged 4–5 months [
36]. Two-thirds of infants (67%) were breastfed within the first hour of birth, and 91.7% of children were breastfed at some point between 0 and 23 months of age. As for continued breastfeeding, only 26.1% of 12–23 months old children were breastfed, of which 36% were at the age of 1 year and 15% at their second birthday [
36]. The proportion of formula-fed infants below 6 months of age was almost 50% [
37]. In terms of trend, the rate of exclusive breastfeeding under 6 months of age and that of early initiation of breastfeeding within 1 hour of birth fluctuated with an overall increase [
15,
37]. The proportion of ever breastfed children (0–23 months) and that of continued breastfeeding (12–23 months) decreased [
15], while that of formula consumption (<6 months) increased over time [
37]. More details are shown in
Figure 1.
Figure 1. Trends in the prevalence (%) of breastfeeding indicators in Jordan, national surveys (1997–2017/18). Source: UNICEF, 2021; Neves et al., 2021 [
15,
37].
3. Complementary Feeding Indicators
More than 8 out of 10 (83%) Jordanian children were introduced to solid, semisolid, or soft foods at 6–8 months of age in 2017–2018, as compared to a higher prevalence of 92% that was recorded in 2012 [
15]. In terms of feeding practices, the minimum acceptable dietary standards were met by only 23% of children aged 6–23 months old, with 35% having an adequately diverse diet and 62% meeting the minimum meal frequency required for their age group [
15,
36]. When compared to earlier national data in 2012, the minimum acceptable diet, minimum diet diversity, and minimum meal frequency among 6–23 months old children showed a decreased proportion (33%, 39%, and 81%, respectively) [
15]. Trends of complementary feeding indicators over longer periods were not derived due to the limited availability of data.
3.2. Low Birthweight
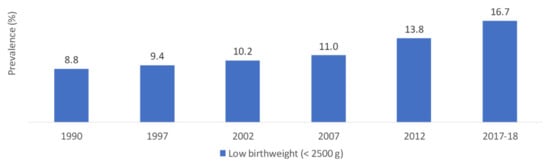
National data collected over time reported an increasing trend in the prevalence of LBW, which almost doubled between 1990 and 2017–2018 (8.8% and 16.7%, respectively) (
Figure 2) [
36,
38,
39,
40,
41,
42,
43].
Figure 2. Trends in the prevalence (%) of low birthweight (<2500 g) in Jordan, national surveys (1990–2017). Source: DOS, 1992; DOS, 1998; DOS, 2003; DOS, 2008; DOS, 2013; DOS, 2019; Islam et al., 2020 [
36,
38,
39,
40,
41,
42,
43].
4. Stunting, Wasting and Underweight among Children under 5 Years
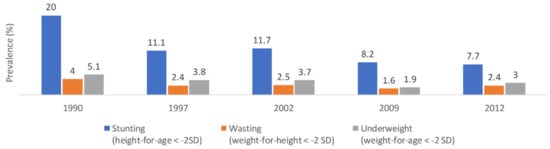
National data in 2012 reported that the rates of stunting, wasting, and underweight among children under 5 years were 7.7%, 2.4%, and 3%, respectively [
39]. The prevalence of stunting was higher among males compared to females (9.2% and 6.1%, respectively) and among children aged 0–23 months old compared to 24–59 months (9.6% and 6.6%, respectively). The rates of wasting were comparable between males and females and between children aged 0–23 months and 24–59 months (2.5% and 2.4%, respectively). Underweight was more prevalent among males (3.3%) compared to females (2.7%) and among 0–23 months old (3.5%) compared to 24–59 months old (0.9%) [
16,
39]. Over time, the prevalence of stunting showed a decreasing trend from 20% in 1990 to 7.7% in 2012 (
Figure 3) [
16,
39], with an average annual rate of change estimated at −2.8%. These findings were in line with modeled data reporting a decreasing trend in the prevalence of stunting [
16,
44]. As for wasting and underweight, the prevalence rates slightly fluctuated but showed an overall decreasing trend (4% and 5.1% in 1990 vs. 2.4% and 3% in 2012, respectively) (
Figure 3) [
16,
39].
Figure 3. Trends in the prevalence (%) of stunting, wasting, and underweight among children under 5 years in Jordan, national surveys (1990–2012). Abbreviations: SD: standard deviation. Source: UNICEF, 2021 [
16,
17].
5. Micronutrient Deficiencies
5.1. Anemia
Children under 5 Years
Based on the latest national Jordan Population and Family Health Survey (JPFHS) study in 2017–2018, the overall prevalence of anemia among children aged 6–59 months was reported at 32%. Most anemic children (21%) had mild anemia, whereas 11% and <1% had moderate and severe anemia, respectively [
36]. When compared to earlier national studies, the prevalence of anemia was stable at 34% for seven years from 2002 to 2009, after which it slightly decreased to 32% in 2012 and 2017–2018 [
36,
45]. Among children aged 12–59 months, two national micronutrient surveys conducted in 2002 and 2010 measured the prevalence of anemia, iron deficiency, and iron deficiency anemia. Findings showed a significant decrease in the prevalence rates of iron deficiency (26.2% in 2002 and 13.7% in 2010) and iron deficiency anemia (10.1% in 2002 and 4.8% in 2010), and a non-significant decline in anemia (20.2% in 2002 and 17% in 2010) [
46,
47]. Modeled data showed that the prevalence of anemia among children aged 6–59 months old fluctuated, starting with a decreasing trend from 32.6% in 2000 to 30.4% in 2010 followed by an increase to reach 32.7% in 2019 [
48].
Women of Reproductive Age
Findings from the latest national JPFHS survey in 2017–2018 showed that, among women aged 15–49 years, the overall prevalence of anemia was 43%. Mild and moderate anemia were found among 36% and 6% of women, respectively [
26,
36]. Compared to earlier JPFHS surveys, the prevalence of anemia among WRA showed an escalating trend starting from 26% in 2002 [
36]. Moreover, among non-pregnant women ages 15–49 years, data from the national micronutrient survey indicated that the prevalence rates of anemia, iron deficiency, and iron deficiency anemia were 30.6%, 35.1%, and 19.8%, respectively [
46].
5.2. Vitamin A Deficiency
Children under 5 Years
Among children ages 12–59 months, national data showed an increasing trend in the prevalence of vitamin A deficiency from 15.1% in 2002 to 18.3% in 2010 [
45,
46,
49].
Women of Reproductive Age
According to national data in 2010, the prevalence of vitamin A deficiency among non-pregnant women aged 15–49 years was 4.8%. The risk of deficiency was higher in women of younger age, who were unmarried, or living in rural areas [
45,
46]. National representative studies assessing vitamin A status among WRA in Jordan over time are lacking.
5.3. Vitamin D Deficiency
Children under 5 Years
National findings in 2010 showed that 56.5% of children aged 12–59 months had vitamin D insufficiency (<20 ng/mL), and 19.8% had vitamin D deficiency (<12 ng/mL). Additionally, the prevalence of deficiency was significantly higher among females compared to males (25.9% and 14%, respectively) [
50]. The scarcity of studies assessing the prevalence of vitamin D deficiency limited the assessment of trends over time.
Adults and Women of Reproductive Age
A nationally representative study conducted in 2017 showed that 89.7% of adults (>17 years old) had low vitamin D levels (<30 ng/mL), with higher rates reported in males (92.4%) compared to females (88.6%). As for vitamin D deficiency (<20 ng/mL), the prevalence was 71.2% and was higher among females compared to males (78.5% vs. 54%) [
51]. Much lower estimates were recorded by a previous nationally representative study by Batieha et al. [
52] where 29.4% of adults (≥19 years old) had low vitamin D levels (<30 ng/mL). Significantly higher prevalence rates were observed among females (37.3%) compared to males (5.1%) [
52]. Moreover, El-Khateeb et al. [
51] re-measured samples from Batieha et al. [
52] using similar assays and indicated that 91% of the study population had low vitamin D levels (<30 ng/mL).
Among women aged 15–59 years, findings from El-Khateeb et al. (2019) showed the prevalence rates of having vitamin D levels < 30 ng/mL and <20 ng/mL were 89% and 80%, respectively [
51]. Another nationally representative study conducted among non-pregnant WRA (15–49 years) in 2010 showed that 95.7% and 60% of participants had levels of vitamin D < 20 ng/mL and <12 ng/mL, respectively [
53,
54].
5.4. Iodine Deficiency
A national iodine study conducted in 2010 among school-aged children aged 8–10 years old showed that the median UIC was 203 μg/L [
46,
55], a value much higher than previous national findings (154 μg/L in 2000 and 40 μg/L in 1993) [
45,
46,
55,
56]. Moreover, the prevalence of goiter showed a sharp decreasing trend, where rates dropped from 37.7% in 1993 and 33.5% in 2000 to 4.9% in 2010 [
45,
46,
55,
56]. Some disparities in the rates were reported among governorates such as Amman, Balqa, Jarash, and Ma’an where iodine deficiency persisted as a mild public health problem [
45]. At the household level, the consumption of iodized salt showed an escalating trend from 88.3% in 2000 to 96.4% in 2010 [
46].
6. Overweight and Obesity
6.1. Children under 5 Years
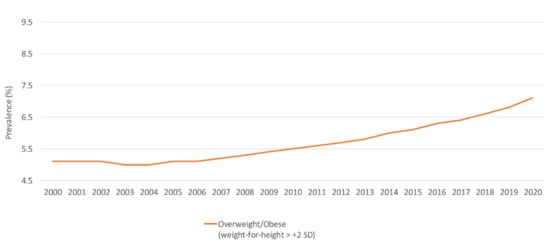
According to national data in 2012, the prevalence of overweight and obesity was 4.7% among children under 5 years, with higher rates observed among males (5.6%) as compared to females (3.8%) [
39]. National survey data reported a fluctuating trend in the prevalence of overweight and obesity over time [
16,
39]. Available modeled data suggested an escalating trend (
Figure 4) [
44].
Figure 4. Trends in the prevalence (%) of overweight/obesity among children under 5 years in Jordan, modeled data (2000–2020). Abbreviations: SD: standard deviation. Source: WHO, 2021 [
44].
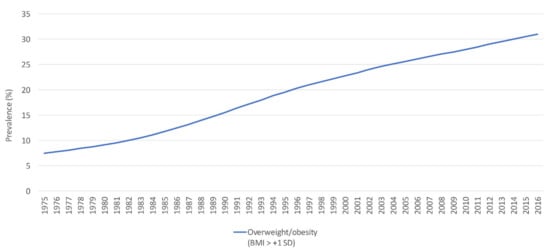
6.2. School-Aged Children and Adolescents
Among 6- to 17-year-old children and adolescents, national data in 2015–2016 indicated that the prevalence of overweight (BMI-for-age ≥ 85th–<95th percentile) was 17.3% and that of obesity (BMI-for-age ≥ 95th percentile) was 15.7%. Overweight was more common among females compared to males (18.9% and 15.3%, respectively), while obesity was more common among males than females (18.9% vs. 11.2%) [
57]. Moreover, according to GSHS data collected in 2007 among students aged 13–15 years, 14.3% and 3.9% were categorized as having BMI-for-age ≥ 85th–<95th percentile and ≥95th percentile, respectively [
58]. Slightly lower results were documented by GSHS data in 2004 (13.9% and 3.5%, respectively) [
59]. According to modeled data, the prevalence of overweight and obesity (BMI > +1 SD) among 5- to 19-year-olds showed an increasing trend from 7.5% in 1975 to 31% in 2016 (
Figure 5) [
60].
Figure 5. The trend in the prevalence (%) of overweight/obesity (BMI > + 1 SD) among school-aged children and adolescents (5–19 years old), modeled data (1975–2016). Abbreviations: BMI: body mass index; SD: standard deviation. Source: WHO, 2021 [
60].
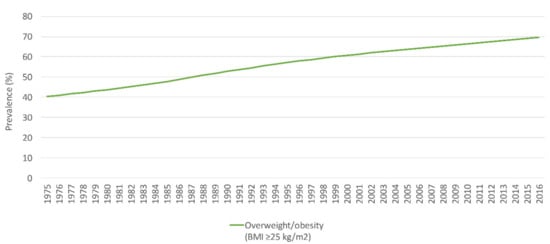
6.3. Adults and Women of Reproductive Age
Based on recent national data from the 2019 STEPS survey, the prevalence of overweight and obesity (BMI > 25 kg/m
2) was 60.8%. The proportion of overweight (BMI 25–29.9 kg/m
2) was 28.7% and was comparable between males (29%) and females (28.4%). The prevalence of obesity (BMI > 30 kg/m
2) was 32.1% and was more common among females (40.4%) compared to males (24.2%) [
61]. Findings from STEPS surveys over time showed that the prevalence of overweight and obesity among adults fluctuated, with an overall increase from 57% in 2004 to 60.8% in 2019 [
61,
62,
63]. Moreover, modeled data estimated an increasing trend of overweight and obesity from 36.4% in 1975 to 66.5% in 2016 (
Figure 6) [
64].
Figure 6. The trend in the prevalence (%) of overweight and obesity (BMI ≥ 25 kg/m
2) among adults in Jordan, modeled data (1975–2016). Abbreviations: BMI: body mass index; kg: kilogram; m: meter. Source: WHO, 2021 [
65].
Among women aged 18–44 years, the prevalence of overweight and obesity in 2019 reached 60%, of which 30% were overweight and 30% were obese [
61]. Compared to earlier national surveys, the rates of overweight and obesity showed a fluctuating trend [
36,
39,
40,
61], with rates predicted to reach 75% in 2030 [
66].
7. Food Consumption Patterns
7.1. Children under 5 Years and Adolescents
Among children aged 6–23 months, national data showed an increasing trend in the proportions of children not consuming fruits and vegetables on a daily basis. The prevalence of not consuming any fruits or vegetables during the day preceding the survey almost doubled between 2007 and 2017–2018 (21.3% in 2007, 29.5% in 2012, and 41.1% in 2017-2018) [
15]. Among adolescents aged 13–15 years, the comparison of national GSHS data (2004 vs. 2007) showed a reduction in the overall daily consumption of fruits and vegetables. Consuming fruits one or more times per day during the 30 days preceding the survey decreased from 73.9% to 69.2% in this age group, and that of vegetables declined from 80.4% to 77.5%, from 2004 to 2007, respectively. The overall consumption of five or more fruits and vegetables per day during the 30 days preceding the survey remained stable (24.7% in 2004 and 25.2 in 2007) [
58,
59]. Conversely, an increase in the consumption of fast food, three or more times during the seven days preceding the survey, was also recorded (11.4% in 2004 and 14.6% in 2007) [
58,
59]. Similar trends were observed when assessing the percentage of soft drinks’ consumption two or more times per day and that of milk or milk products three or more times per day during the 30 days preceding the survey (27.8% vs. 38.1% and 16.4% vs. 35.8%, in 2004 and 2007, respectively) [
58,
59].
7.2. Adults and Women of Reproductive Age
According to the national STEPS survey conducted in 2019 among adults (18–69 years old), the average consumption of fruits was 1 serving a day for 3 days per week, and that of vegetables was 2 servings a day for 6 days per week. The average consumption of both fruits and vegetables was equivalent to 3 servings per day, and the prevalence of consuming <5 servings per day was 84.4%. Similar data were documented between males and females and among women aged 18–44 years [
61]. Findings from a previous STEPS survey in 2007 showed that adults consumed an average of 2 servings per day of fruits for 4 days per week and an average of 3 servings per day of vegetables for 6 days per week, and 14.2% reported consuming <5 servings of fruits and vegetables per day [
67].
In terms of salt intake, the 2019 national STEPS survey showed that the mean estimated amount consumed among adults (18–69 years old) was 11 g/day, with slightly higher levels reported among males compared to females (12.5 g/day vs. 9.6 g/day). Women aged 18–44 years consumed 9.7 g of salt per day. Furthermore, 30.6% of adults always or often added salt to their food, and a high proportion was recorded among women, particularly those aged 18–44 years (33.6%). The addition of salt when cooking or when preparing food at home was reported among 79.3% of adults, and similar proportions were documented between genders and among women aged 18–44 years. Processed foods of high salt content were always or often consumed by 33.4% of adults, particularly females aged 18–44 years (38.8%) [
61].
8. National Nutrition Policies and Strategies in Jordan
Jordan is one of the few countries in the EMR which responded to the recommendations of the ICN-1 and accordingly developed a “National Plan of Action” in 1996 [
68], which was then further reviewed and successfully implemented. Another plan of action was developed in 2006 and updated in 2010 by the Ministry of Health and WHO in coordination with all sectors. Despite the challenges faced, Jordan created an enabling environment for setting up successful national nutrition programs [
68].
8.1. The Baby Friendly Hospital Initiative (BFHI) and the International Code of Marketing of Breast-Milk Substitutes
The baby friendly hospital initiative (BFHI) was launched in 1991 by UNICEF and WHO as a means of protecting, promoting, and supporting breastfeeding [
69]. The revised initiatives in 2018 required the implementation of the International Code of Marketing of breast-milk substitutes (The Code) [
70]. In Jordan, although the Code is adequately promoted to the general public and in health facilities, it has been shown to lack proper implementation and lacks adequate monitoring and evaluation [
71]. Only three hospitals were designated for the BFHI, without proper monitoring and follow-up [
72].
8.2. Food Fortification and Micronutrient Supplementation
Since April 2006, Jordan implemented a mandatory national wheat flour fortification program, which initially comprised iron and folic acid, followed by zinc, vitamins A, B1, B2, B3, B6, and B12, after which vitamin D was added in 2010. The monitoring system included internal methods undertaken by the millers and external monitoring by the government, where non-compliant mills were subject to fines [
54]. The program witnessed financial challenges related to funding the premix and the cost of the subsidized bread for refugees, in addition to the need of training employees in the mills across the country. Priority actions included assessing the efficiency of the program and strengthening its enforcement through enhanced capacity building, finances, and reporting systems. Moreover, in response to alarming suboptimal iodine levels in 1993, a mandatory universal salt iodization program was introduced in 1995 and has been efficiently progressing to date [
45].
Additionally, as means of decreasing vitamin A deficiency, a vitamin A supplementation program was initiated in 2005. This program provided one shot of 100,000 IU of vitamin A at the time of measles vaccination at 10 months of age, followed by a second shot of 200,000 IU when giving the measles, mumps, and rubella vaccination (MMR) at 18 months of age. In 2008, the national higher committee of nutrition in Jordan modified this process by maintaining only the first dose of 100,000 IU. Then in 2012, in response to the increased prevalence of vitamin A deficiency, the national higher committee of nutrition retained the second dose of 200,000 IU vitamin A and requested to continuously monitor and evaluate the distribution of vitamin A capsules and documents provided in the national vaccines card [
28,
72].
3.7.3. Multisectoral Coordination to Tackle Obesity
As a means of tackling nutrition-related challenges in Jordan, the National Framework of Action on Obesity Prevention (2018–2023) was founded in 2019 as a multisectoral approach. In addition to enhancing the quality and quantity of dietary fat and oils, the committee’s agenda included optimizing salt and sugar content in the diet, decreasing sedentary behavior, and enforcing marketing policies on food commodities and their labeling and breast milk substitutes. The committee managed to reduce the proportion of salt in bread, optimize the fat content of dairy products and food served in public institutions especially by eliminating industrially-produced trans-fat, and enhance the quality of food served in youth camps. Educational material including country-specific food consumption tables, food-based dietary guidelines, and dietary recommendations for managing NCDs were also provided [
73].
This entry is adapted from the peer-reviewed paper 10.3390/nu14010135